RDP 9004: Saving and Investment in the 1980s 2. Trends in Saving and Investment
August 1990
- Download the Paper 2.8MB
2.1 Household and Private Sector Saving Ratios
Saving is broadly defined as the difference between income and consumption, but this definition leaves open a number of questions, not only about how consumption and income should be measured, but also about the appropriate sectoral boundaries for any study of saving behaviour. In Australia the most commonly discussed measure of saving is probably the household saving ratio, which defines saving as the difference between net household disposable income and consumption. The behaviour of this ratio over the past three decades is shown in Figure 1.[1]

The household saving ratio has averaged about 10 per cent in the period under discussion, but in the late 1980s has been somewhat below this level, coming in at under 7 per cent in 1988/89. More worrying for some commentators has been the consistent downward trend evident over the past 15 years. This feature has some parallels with overseas experience, as has been noted for example by Hayashi (1986, 1989) in his comparative studies of the United States and Japan.
Before any attempt is made to explain the underlying saving behaviour it is important to examine the extent to which these apparent trends may be the result of poor measurement. There are in fact a number of reasons why the household saving ratio may give an inaccurate picture. First, there is the failure of conventional national accounts to recognise the transfer of income between borrowers and lenders effected by inflation. Anstie, Gray and Pagan (1983) showed that adjusting for this effect substantially reduces the mid-seventies anomaly in measured saving. A second issue, which emerges particularly strongly from international comparisons (for example Dean et al, 1989), is that saving patterns of the private sector as a whole tend to be more stable than those of households; there is a strong tendency for movements in household and business saving to offset one another. Given that the boundary between households and businesses is to some extent arbitrary in any case, this suggests that a narrow focus on the household sector may sometimes be misleading. Other measurement problems concern the estimation of depreciation values used in net saving measures, the treatment of consumer durables, and the potential inclusion of capital gains in income This list is far from exhaustive; Eisner (1988) provides a detailed critique of the national accounting measures which are used to derive estimates of saving. Some of the adjustments which Eisner advocates would raise almost insurmountable problems of data availability, and this Section of the paper focuses on a selection of the measurement issues raised above for which reasonably good data are available to make the necessary adjustments. Specifically, it will examine the issues of inflation adjustment, depreciation calculations, and the treatment of consumer durables. The further issue of the role of capital gains and wealth will be discussed in Section 3.
(i) Private Saving and Inflation
Gross private sector saving (shown in Figure 2) is equal to the sum of household saving and corporate retained earnings, where both are measured before deduction of depreciation. It is apparent from the graph that much of the variation in household saving over the period shown has been offset by compensating changes in business saving, resulting in a considerably more stable picture when the private sector is taken as a whole. The mid-1970s peak in saving remains, but at 19 per cent of income this is only 2 percentage points above the three-decade average. Dean et al (1989) suggest measuring the degree of offset between household and business saving using a simple regression of one variable against the other. Their results using a pooled cross-section and time series sample of OECD countries showed an estimated offset coefficient of 0.8, implying that a dollar rise in business saving is associated with a fall in household saving of about 80 cents. Our estimates using Australian data are very similar.

The idea that households adjust their saving to take account of corporate behaviour is sometimes described in terms of households “seeing through the corporate veil”, recognising their ownership of corporate earnings irrespective of the extent to which they are distributed as dividends. There are certain similarities between this and the Ricardian equivalence proposition, which essentially asserts that households recognise the net present value of government cash flows as part of their wealth. But there is an important difference which makes the corporate-household behavioural link a much more plausible one than the corresponding link between households and governments. Corporate wealth has a market value which can be more or less continually observed by shareholders. Provided sharemarkets do not suffer from “dividend illusion” (i.e. valuing companies inconsistently before and after dividend distributions), shareholder wealth will be unaffected by the way companies divide their profits between dividends and retained earnings. It seems reasonable to suppose that consumption by shareholders would be similarly unaffected.[2] To this point it might be added that the dividing line between the household and corporate sectors is in any case to some extent arbitrary. The corporate sector includes many entities like family businesses and private investment vehicles which exist as accounting devices for the purpose of gaining corporate tax treatment for households; and the household sector is generally defined to include unincorporated enterprises which for many purposes could be expected to behave like companies. For these reasons we conclude that household and corporate saving should not be studied as separate aggregates.
The conclusion that private saving in Australia has been relatively stable becomes stronger when adjustments are made for the redistributive impact of inflation. In the national accounts all interest flows are measured on a purely nominal basis and do not make any allowances for the effect of inflation in transferring income from lenders to borrowers. Generally this means that private sector income (and hence saving) is overstated because the private sector is a large net holder of government liabilities. Estimates of the size of this effect are fairly straightforward to calculate, and are set out in detail in the appendix; saving rates adjusted for the inflation transfer between public and private sectors are shown in Figure 3.[3]

Since the private sector has been a substantial net holder of government liabilities throughout the three decades, the main effect of the inflation adjustment, shown in Figure 3, is to reduce private income, and hence saving, throughout the period. Public sector income is correspondingly raised. Not surprisingly, the downward adjustment to private saving is largest in the mid 1970s when domestic inflation rates were highest. Inflation adjustment removes the peak that occurred in 1974/75, and leaves a measure of private saving which has been remarkably stable over three decades.
Using the revised measure, the largest deviation from average behaviour occurred in 1982/83, when the adjusted saving ratio fell to a little over 11 per cent of GDP. This coincided with the most severe recession of the post-war period, and it will be argued in Section 3 that saving behaviour at that time can be well explained by models of consumption smoothing which predict that saving rates vary inversely with incomes. After 1982/83, adjusted saving rates quickly recovered to levels around their long run average.
(ii) Gross and Net Saving
Net saving rates are calculated by deducting from income the estimated depreciation of the capital stock. In principle this results in a saving measure which is more in accord with the theoretical notion of saving representing net increments to wealth. Unfortunately however, depreciation cannot be directly measured, and must be derived from gross investment data using a variety of assumptions about the length of asset lives. Using depreciation estimates provided in the national accounts, in conjunction with the adjusted gross private saving figures derived above, an estimate of inflation-adjusted net saving can be calculated (Figure 4).

In contrast to the impression given by gross saving data, it would appear that net private saving rates in the 1980s have been considerably below levels of the previous two decades. However, in what follows it is argued that this conclusion is extremely sensitive to assumptions and is inconsistent with other information relevant to the estimation of aggregate depreciation.
The sensitivity of depreciation estimates to changes in basic assumptions has recently been demonstrated in the case of the manufacturing sector by Lattimore (1989). Official figures for capital stock and depreciation are calculated using a complicated formula which distinguishes between “retirement” and depreciation of capital (see Walters and Dippelsman (1985)). Since neither concept is directly observable, it seems sensible for the purposes of this paper to adopt the more transparent approach of assuming constant proportional depreciation. Lattimore shows that this closely approximates the ABS method for the manufacturing sector, and Figure 5 confirms this in the aggregate case using an assumed constant depreciation rate of 6.5 per cent. The point to be made here is that the existence or otherwise of an upward trend in depreciation as a share of income depends basically on the assumed depreciation rate. At 6.5 per cent, both depreciation and the net capital stock show an upward trend relative to income; a lower depreciation rate exacerbates this trend because capital is allowed to accumulate more quickly in the earlier years, while a higher depreciation rate of about 10 per cent is sufficient to remove it (Figures 6 and 7).


An argument which supports use of the higher depreciation rate is that the derived capital stock valuations need to be consistent with other information about returns to capital. Roughly speaking, corporate gross profits represent the value of the capital stock times the rate of return on capital, so that given estimates for any two of these concepts, the third can be inferred. As is evident from Figure 8, corporate profits have not shown any long-run tendency to increase as a proportion of national income, so the upward trend in capital stock valuation would therefore imply a strong downward trend in the rate of return on capital in the 1970s and 1980s. Estimates of the rate of return calculated by Dews (1988) in fact show the reverse. In resolving this inconsistency we would argue that the official capital stock data is probably the least reliable of the three pieces of information, thus providing some justification for preferring a capital stock measure in which the upward trend is removed.

These considerations do not of course justify a claim that 10 per cent (or some other Figure) represents the “correct” rate of depreciation for the purposes of calculating net saving.[4] They do however cast doubt on official figures which imply strong rises in the ratios of depreciation and the capital stock to national income in the 1970s and 1980s. To avoid these problems we are advocating a focus on gross rather than net saving rates, and a corresponding focus on gross investment rather than investment net of depreciation. (These issues do not affect any analysis of saving-investment imbalances, measures of which are unaffected by adjustments for depreciation.)
(iii) Consumer Durables
Many of the components of household spending have to some extent the characteristics of investment goods which are not fully consumed when purchased. It is often argued that such expenditures should be recorded in consumption as their benefits accrue, in much the same way as is done with housing expenditure, rather than being recorded at the time of purchase. While undoubtedly valid in principle, this argument can be taken to almost any lengths, and sometimes is. An extreme example would be Shiller's (1982) suggestion that expenditures on holidays be counted as an investment which yields a subsequent flow of services in the form of happy memories.
Similarly, Heijdra and James (1989) have argued that all expenditures have some element of durability. From a practical point of view the main issue would seem to rest on the rate of depreciation of such expenditures: those which depreciate relatively quickly are likely to be well approximated at an aggregate level by the conventional method based on recording at the time of purchase; for longer-lived goods, such as motor vehicles, this might not be a good approximation.
To give an idea of the potential size of these effects, Figure 9 shows an alternative measure of household saving obtained by excluding expenditure on durables from consumption, and adding back an imputed service flow from the stock of durables outstanding (calculations are shown in the appendix). As might be expected, the main effect of this adjustment is to change the timing rather than the level of consumption, and it would appear that the adjustment does not have an important quantitative effect on the general trends. This is not to deny that adjustments for consumer durables may be important in certain econometric studies (for example, McKibbin and Richards (1988) and various recent overseas studies) where the timing of consumption expenditure is of fundamental importance.

2.2 Private Investment
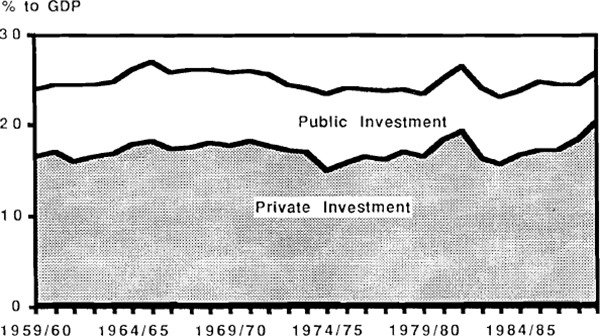
Measured on a gross basis, investment expenditures are not subject to the same conceptual difficulties associated with the measurement of saving and, with the exception of any problems in the reliability of the basic sources (an issue discussed further in Section 2.7), measurement errors can be safely ignored. Figure 10 shows Australia's gross private investment ratio over the past three decades. The investment ratio has tended to show a stronger cyclical behaviour than saving, with total private investment varying between about 15 and 20 per cent of nominal GDP over the period.

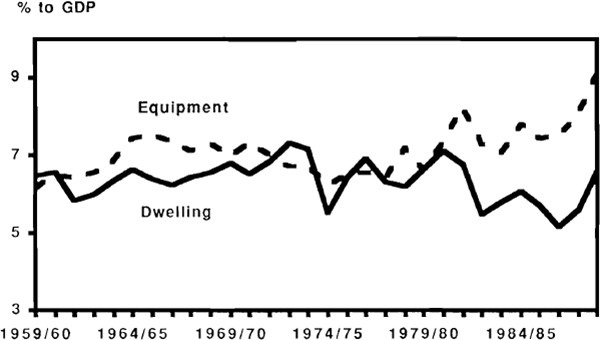
Private investment is usually disaggregated into three categories according to asset type: namely, dwellings, non-dwelling construction and equipment (Figure 11). The dwellings component has been relatively stable at around 5 per cent of GDP throughout the period, although a cyclical behaviour is clearly evident especially in the late 1970s and in the 1980s. The 1970s were characterised by generally low levels of business investment (that is, excluding the dwellings component), and since the gradual recovery from the mid 1970s trough there can be said to have been two investment boom periods. The first, around 1980/81, was associated with the mineral resources boom, but the strong investment growth of this period was not confined to the mining industries; to a lesser extent the manufacturing and other sectors also showed expanded levels of investment. The boom was short-lived however, and was followed by a sharp contraction in investment levels. This followed a similar contraction in company profits which, as will be discussed in Section 4, appears to be an important explanatory variable for investment behaviour in Australia.

The second period of strong investment growth occurred in the latter part of the 1980s, mainly between 1986 and 1988. The strongest growth rates were in non-dwelling construction activity, which in the three years to 1987/88 grew by over 50 per cent in real terms. On an industry basis, much of this is recorded as belonging to the finance sector, and represents growth in office developments; investment in offices was both the largest and the fastest growing component of construction activity during this period. Plant and equipment investment was much more stable than construction spending, at least when viewed in value terms (as in Figure 11). This however masks a very strong growth at constant prices, especially in 1988 (see Figure 12); plant and equipment expenditure has a high import cost component and the prices of imported capital goods were falling significantly at that time.[5] In constant price terms, plant and equipment investment grew by over 25 per cent in the two years to 1988/89. Whether it is appropriate to look at constant or current price data of course depends largely upon the uses to which the information is being put. Constant price investment data is probably the most relevant in assessing additions to productive capacity; however in comparing saving and investment ratios and assessing the adequacy of saving to finance investment expenditures, it is the nominal values that are important.
2.3 The Allocation of Private Savings
Financial flow data show that the allocation of private saving between asset components has changed markedly in the second half of the 1980s. Estimates of the main components are shown in tables 1 and 2.
| Gross Saving | Dwellings |
Other Capital | Bank Deposits | Govt. Securities | Life & Super | Minus Advances | Other |
|
|---|---|---|---|---|---|---|---|---|
| 1979/80 | 11.2 | 5.3 | 4.5 | 3.2 | 0.9 | 2.3 | (5.3) | 0.3 |
| 1980/81 | 11.4 | 5.9 | 4.7 | 3.9 | 1.1 | 2.3 | (6.1) | −0.4 |
| 1981/82 | 11.2 | 5.7 | 4.5 | 2.9 | 1.1 | 2.4 | (6.3) | 0.8 |
| 1982/83 | 10.4 | 4.5 | 3.1 | 3.8 | 1.9 | 2.4 | (5.0) | −0.2 |
| 1983/84 | 11.1 | 4.5 | 4.2 | 3.6 | 2.4 | 2.8 | (6.0) | −0.4 |
| 1984/85 | 10.6 | 4.9 | 4.2 | 4.3 | 0.0 | 3.0 | (6.1) | 0.4 |
| 1985/86 | 10.1 | 4.8 | 4.0 | 3.0 | 0.8 | 3.7 | (5.6) | −0.7 |
| 1986/87 | 9.8 | 4.2 | 3.9 | 3.9 | 0.7 | 5.2 | (5.0) | −3.0 |
| 1987/88 | 9.7 | 4.4 | 4.6 | 2.8 | −1.4 | 6.5 | (6.2) | −0.8 |
| 1988/89 | 9.3 | 5.6 | 5.3 | |||||
|
Notes: . “Other” includes unidentified flows. Source: Reserve Bank of Australia, Financial Flow Estimates, November 1989. |
||||||||
| Gross Saving | Corporate Investment | Deposits |
Assets Abroad | Minus Bank Advances | Minus Other Net Borrowing | Unidentified |
|
|---|---|---|---|---|---|---|---|
| 1979/80 | 5.5 | 6.7 | 0.7 | 0.5 | (0.6) | (2.8) | 1.1 |
| 1980/81 | 4.8 | 7.7 | 0.4 | 0.2 | (0.3) | (4.9) | 1.7 |
| 1981/82 | 3.8 | 8.6 | 0.4 | 0.4 | (0.6) | (5.2) | 0.1 |
| 1982/83 | 3.5 | 6.3 | 0.4 | 0.6 | (0.1) | (3.7) | −0.1 |
| 1983/84 | 5.5 | 6.2 | 0.2 | 0.6 | (0.2) | (1.9) | 0.7 |
| 1984/85 | 6.6 | 7.0 | 1.7 | 1.2 | (1.8) | (3.0) | 1.5 |
| 1985/86 | 6.4 | 8.4 | 1.2 | 1.0 | (1.6) | (5.6) | 3.0 |
| 1986/87 | 6.3 | 7.7 | 0.6 | 1.8 | (1.8) | (5.9) | 4.0 |
| 1987/88 | 6.4 | 8.5 | 0.6 | 2.2 | (1.7) | (6.3) | 3.0 |
| 1988/89 | 6.7 | 9.2 | |||||
Note: Columns 2 to 7 add to Column 1. Source: As above. |
|||||||
In the household sector (which includes unincorporated enterprises), aggregate saving has traditionally been allocated mainly to physical capital formation, in the form of the housing stock and investment by unincorporated enterprises. Other financial flows within the household sector have tended in a rough sense to offset one another[6], the gross flows being much larger than the household sector's net borrowing or lending position; both the incurrence of liabilities (mainly to financial institutions) and the acquisition of financial assets have grown more or less in line with the household sector's physical capital formation. The importance of house purchases in the household sector's aggregate saving is confirmed by estimates of the household sector's stock of wealth; Piggott (1986) calculated that in 1985 the value of houses accounted for about 55 per cent of the household sector's aggregate wealth.
In the period since about 1984/85, there have been two major changes in the financial flow behaviour of households. First, the household sector has gradually moved from a net lending to a net borrowing position, becoming a net borrower for the first time in 1988/89. This was mainly associated with a gradual reduction in the household sector's contribution to private saving, although 1988/89 was also a year of unusually strong household capital formation. The second major change in behaviour in the household sector has been the massive growth in saving through superannuation funds in recent years. By 1987/88 (the latest year for which figures are available) the household sector's saving through superannuation funds had risen to over 6 per cent of GDP, compared with a level of around 2 per cent which was typical at the beginning of the decade. The 1987/88 figure actually represented more than 100 per cent of net household saving in that year. The growth in this component of household assets reflects two major influences: the favourable tax treatment given to superannuation relative to other forms of financial assets, and the move to award based superannuation schemes which after 1986 greatly expanded the number of people covered. Section 3 will discuss these issues in more detail and consider the impact of various tax incentives on saving in aggregate, but for the present it is useful to point out that the recent superannuation growth has not coincided with any major shift in the aggregate level of households' gross saving. Offsetting changes have occurred in the rate of acquisition of other financial assets including bank deposits, government securities, and shares. A substantial increase in the household sector's net unidentified flows (possibly representing other unidentified reductions in asset holdings) has also contributed to this.
The corporate sector in Australia is typically a net borrower in flow terms, its gross capital formation each year exceeding gross retained earnings. The financing requirement of the corporate sector, defined as the difference between gross saving and gross investment, has varied between zero and 5 per cent of GDP in the 1980s, and has thus been much more volatile than that of the household sector. In the early 1980s the typical pattern was for the corporate sector to meet its financing requirement by incurring liabilities while doing very little on the financial asset side. From 1984/85 onward however, the gross flows on both sides of the aggregate balance sheet began to increase at a much faster rate, coinciding with removal of exchange controls and other deregulatory initiatives in the financial sector. The financial flow estimates show the corporate sector borrowing substantially more than its financing requirements during this period, with at least part of the proceeds being used to finance the accumulation of assets abroad.[7] Also significant is the increased use of “other financial instruments”, including securitised borrowings by companies, as a means of raising funds in addition to conventional loans.
2.4 Public Sector Saving and Investment
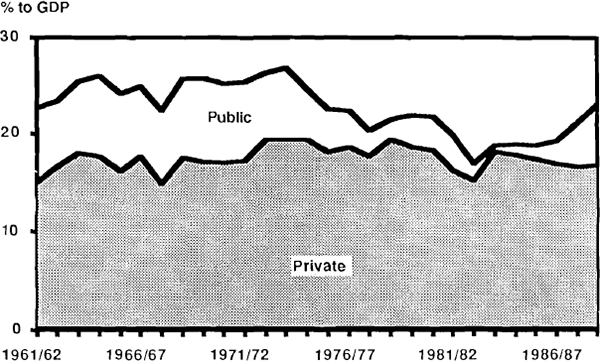
While private saving rates have arguably been very stable during the past three decades, public sector saving fell considerably after the mid 1970s. Although this trend was reversed in the second half of the decade, rates of public saving remain substantially lower than the levels which were typical in the 1960s and early 1970s (Figure 13). As a result, the rate of gross national saving (the sum of private and public saving) was about 5 percentage points lower in the 1980s than the average for the 1960s, the difference being almost entirely accounted for by the public sector. This has coincided with a decline (though to a lesser extent) in public sector capital formation.
Public sector saving and investment are linked by the following identity:
Public borrowing = Public investment – Public saving
Public sector gross saving is thus equal to capital formation by the public sector minus that part which is financed by net public borrowing. The relationship is illustrated in Figure 14.[8]
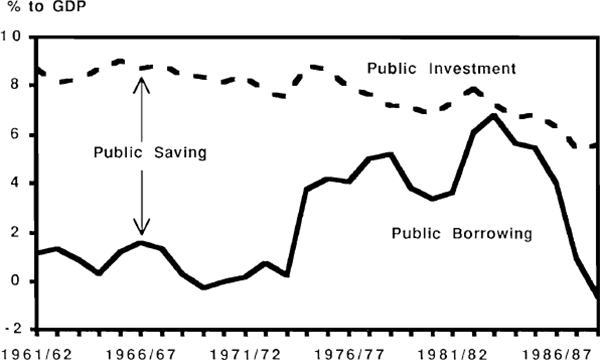
In the 1960s public sector saving was fairly stable at around 8 per cent of GDP which, with investment at around 10 per cent, left a small borrowing requirement of 1 to 2 per cent of GDP. The first major shift in this behaviour occurred in the mid 1970s when public saving contracted markedly, primarily due to a jump in consumption expenditure which was not matched by higher revenues; between 1973/74 and 1975/76, public sector consumption jumped by about 3 per cent of GDP, and there was a similar increase in the PSBR. The PSBR jumped again in the 1982/83 recession period, reaching a peak ratio to GDP of 7 per cent. The increase in this case was mainly associated with revenue shortfalls and increased transfer payments. Nevile (1989) argues that most of this was cyclical in nature, and presents estimates showing that the cyclically adjusted fiscal position was largely unchanged during this period.
However the subsequent period, from 1983/84 to the present, represents a distinctive phase of fiscal policy in which reduced public sector deficits became an important objective. Between 1983/84 and 1988/89, the estimated public sector position was moved in the direction of surplus by about 8½ per cent of GDP. On Nevile's estimates, only about 2 percentage points of this could be attributed to the economic cycle. In an accounting sense, the 8½ per cent change can be split between expenditure reductions (5½ percentage points) and revenue increases (3 percentage points).
On the expenditure side, two further points are worth noting. First, when disaggregated by level of government the largest reductions in expenditure on goods and services were made at State and Local level. Measured on a national accounts basis, State and Local government expenditure on goods and services fell by 3 per cent of GDP between 1983/84 and 1988/89. By contrast, Commonwealth spending reductions were concentrated largely in transfer payments to individuals and to the States. The second point to note is the relative decline in public sector investment expenditure, which has born the brunt of expenditure restraint at an aggregate level. This has not yet become a major issue in economic debate, but the reduction is substantial, and presumably if sustained will have a cumulatively negative effect on the public sector capital stock. Recent empirical work by Aschauer (1989a, 1989b) and Barro (1989) has suggested that levels of public sector investment may have an important effect on medium to long term productivity growth through the provision of infrastructure which cannot be privately provided.
2.5 Saving, Investment and the Current Account
Saving and investment are linked together by the well known identity which states that the current account deficit is equal to the excess of gross national investment over national saving. It will be useful at this point to tie together information on the component parts of this identity.
To begin, Figure 15 shows Australia's gross investment levels during the past three decades, divided into public and private components for comparison with Figure 13 on saving. On the saving side, the relatively stable behaviour of the private sector component has already been noted. Total saving levels have however fallen quite substantially in the second half of the period shown, due to a virtual collapse in the public sector contribution. From a level around 25 per cent of GDP prior to the mid 1970s, national saving levels have fallen to an average of less than 20 per cent, although a partial recovery is evident in the most recent years. National investment (Figure 15) has been more stable than saving. Most of the cyclical variation in investment is driven by the private sector component, but perhaps more significant has been the longer-term trend for public sector investment to fall relative to GDP, while private investment was rising. The two trends have roughly offset one another, with only a slight fall in aggregate investment evident over the period as a whole. Almost without exception in the three decades, gross investment levels have been higher than saving, implying that the current account was in deficit (Figure 16).
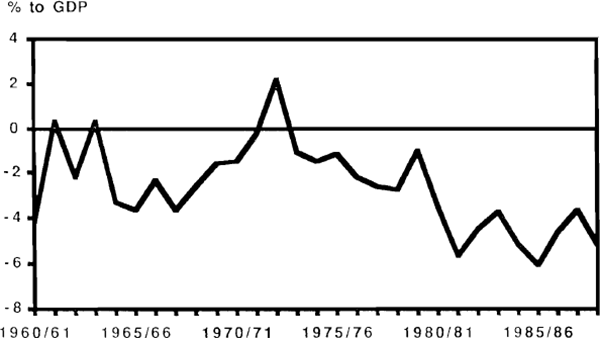
From year to year the current account deficits and saving-investment imbalances do not exactly line up, due to fluctuations in the statistical discrepancy (the significance of which will be discussed in Section 2.7). Over time however the broad trends are fairly clear. Abstracting from cyclical movements, total investment has been more or less steady as a ratio to GDP, while saving levels fell away in the late 1970s and stayed low for most of the subsequent decade. The fall-off in saving, by around 4 or 5 per cent of GDP, roughly matches the increase in current account deficits in the 1980s, although in the most recent years the deficit has risen relative to the identified saving-investment imbalance, representing a trend increase in the statistical discrepancy.
Further details on the sectoral balances are provided in Table 3, expressed on a 5-year average basis to emphasise the broad trends. On this basis it is clear that the discrepancy has not been a factor in the longer-term widening of the current account deficit; the trend contribution of changes in the discrepancy was actually negative. The current account deterioration between the 1970–74 and the 1985–89 periods can be attributed in an accounting sense mainly to the deterioration in the public sector's net financing requirement. When viewed on an annual basis, however (Table 4), this picture breaks down somewhat in recent years. Between 1984/85 and 1988/89 the current account was almost unchanged as a ratio to GDP, while the public sector's financing requirement fell by about 6 per cent of GDP. This reduction was absorbed partly by the discrepancy (1½ per cent) but mainly by an increase in the private sector's financing requirement (mainly through higher investment).
| 1965–69 | 1970–74 | 1975–79 | 1980–84 | 1985–89 | |
|---|---|---|---|---|---|
| PUBLIC | |||||
| Public saving (unadjusted) | 7.79 | 7.84 | 3.60 | 2.56 | 3.10 |
| Inflation Gain | 1.83 | 3.42 | 3.88 | 3.27 | 2.65 |
| Public saving (inflation adjusted) | 9.61 | 11.26 | 7.48 | 5.82 | 5.75 |
| Public investment | (8.45) | (7.64) | (7.74) | (7.18) | (6.65) |
| Public financing requirement (inflation adjusted) | −1.16 | −3.62 | 0.26 | 1.36 | 0.90 |
| PRIVATE | |||||
| Private saving (unadjusted) | 16.84 | 18.07 | 18.68 | 17.35 | 17.15 |
| Inflation Loss | (1.83) | (3.42) | (3.88) | (3.27) | (2.65) |
| Private saving (inflation adjusted) | 15.02 | 14.65 | 14.80 | 14.06 | 14.50 |
| Private investment | (19.39) | (18.45) | (16.91) | (17.56) | (18.32) |
| Private financing requirement (inflation adjusted) | 4.37 | 3.80 | 2.11 | 3.50 | 3.82 |
| Statistical discrepancy | −0.12 | 0.26 | −0.35 | −1.20 | 0.20 |
| Current Account Deficit | 3.09 | 0.44 | 2.02 | 3.65 | 4.92 |
| 1983–84 | 1984–85 | 1985–86 | 1986–87 | 1987–88 | 1988–89 | |
|---|---|---|---|---|---|---|
| PUBLIC | ||||||
| Public saving (unadjusted) | 0.53 | 1.05 | 1.38 | 2.36 | 4.52 | 6.21 |
| Inflation Gain | 2.41 | 2.73 | 2.97 | 2.93 | 2.44 | 2.15 |
| Public saving (inflation adjusted) | 2.94 | 3.78 | 4.36 | 5.29 | 6.96 | 8.36 |
| Public investment | (7.37) | (7.05) | (7.50) | (7.26) | (5.91) | (5.53) |
| Public financing requirement (inflation adjusted) | 4.43 | 3.27 | 3.14 | 1.97 | −1.05 | −2.83 |
| PRIVATE | ||||||
| Private saving (unadjusted) | 18.22 | 17.87 | 17.46 | 16.98 | 16.69 | 16.76 |
| Inflation Loss | (2.41) | (2.73) | (2.97) | (2.93) | (2.44) | (2.15) |
| Private saving (inflation adjusted) | 15.81 | 15.14 | 14.48 | 14.05 | 14.26 | 14.61 |
| Private investment | 16.39 | 17.27 | 17.92 | 16.63 | 18.37 | 21.43 |
| Private financing requirement (inflation adjusted) | 0.58 | 2.13 | 3.44 | 2.58 | 4.11 | 6.82 |
| Statistical discrepancy | −1.31 | −0.26 | −0.54 | 0.07 | 0.57 | 1.16 |
| Current Account Deficit | 3.70 | 5.15 | 6.04 | 4.62 | 3.63 | 5.14 |
One of the lessons of this kind of exercise is that a study of the broad saving and investment aggregates alone is unlikely to yield a satisfactory explanation for short-term movements in the current account. Measurement errors, in the form of the statistical discrepancy, may be relatively small when compared with aggregate saving or investment, but they are large when compared with the saving-investment gap. This would make it difficult to sustain strong conclusions about the behaviour of the current account when they are based on study of the saving and investment aggregates alone.
2.6 International Comparisons
International comparisons are often used as a benchmark in examining the adequacy of national saving and investment levels. These comparisons are best made on a gross basis because, as Hayashi (1986) has argued, methods of calculating depreciation can vary markedly across countries and can result in misleading inferences. The main points to emerge from the comparative data (Tables 5 and 6) are that Australia's saving rates have generally been close to the OECD average, while investment levels have tended to be higher. Japan is a consistent outlier in these comparisons, showing much higher rates of both saving and investment than the OECD averages.
| 1960s | 1970s | 1980s | ||||
|---|---|---|---|---|---|---|
| Private | Total | Private | Total | Private | Total | |
| United States | 17.7 | 19.6 | 19.2 | 19.5 | 18.7 | 16.3 |
| Japan | 28.7 | 35.0 | 29.9 | 34.4 | 26.8 | 31.1 |
| Germany | 21.1 | 27.3 | 20.2 | 23.7 | 20.0 | 21.8 |
| France | n.a. | 26.3 | 22.0 | 25.4 | 18.8 | 19.6 |
| United Kingdom | 13.2 | 18.7 | 16.7 | 18.1 | 18.4 | 17.5 |
| Italy | 19.7 | 21.0 | 22.9 | 19.2 | 21.7 | 15.6 |
| Canada | 18.1 | 21.8 | 20.7 | 23.1 | 22.5 | 20.3 |
| Australia | 16.8 | 24.8 | 21.3 | 23.7 | 17.4 | 19.9 |
| 1960s | 1970s | 1980s | ||||
|---|---|---|---|---|---|---|
| Private | Total | Private | Total | Private | Total | |
| United States | 16.1 | 18.8 | 17.9 | 19.3 | 16.5 | 18.1 |
| Japan | 30.7 | 35.1 | 28.2 | 33.8 | 23.7 | 29.0 |
| Germany | 22.7 | 26.6 | 19.5 | 23.0 | 17.6 | 20.0 |
| France | n.a. | 25.4 | 21.8 | 25.2 | 17.0 | 20.1 |
| United Kingdom | 14.7 | 19.0 | 15.7 | 19.6 | 14.5 | 16.6 |
| Italy | 16.8 | 19.5 | 16.6 | 19.4 | 13.2 | 16.7 |
| Canada | 19.9 | 24.0 | 21.3 | 24.7 | 18.9 | 21.6 |
| Australia | 17.4 | 27.2 | 21.4 | 25.1 | 22.0 | 24.7 |
Source: Dean et al. (1989). Figures for 1980s are averages to 1987. |
||||||
Excluding Japan, the private saving ratios of the countries shown have been distributed in a fairly narrow band around 18–20 per cent of GDP in each of the three decades for which averages are given. The situation in the 1980s was much the same as in the previous decade, although Australia's private saving rate did show a small deterioration relative to the OECD average (ignoring adjustment for inflation).[9]
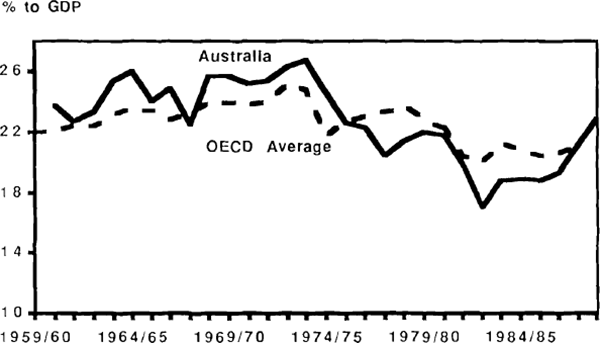
When public sector saving is taken into account, some decline in OECD saving rates becomes apparent through the period. Average national saving rates fell from 23.5 per cent in the 1970s to an estimated 20.2 per cent in the 1980s, with a similar fall occurring in Australia. Figure 17 provides further details and indicates the close correlation between Australian and OECD national saving rates over the 30 year period.
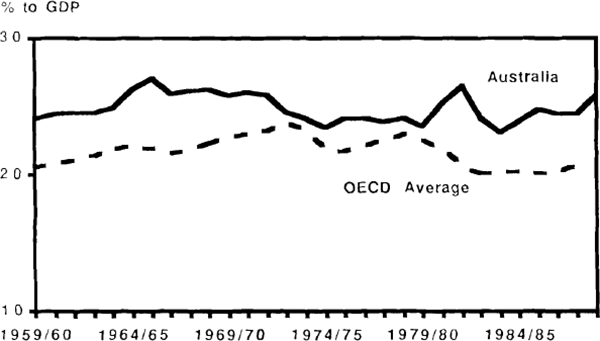
Australia's gross investment ratio has been consistently higher than the OECD average, typically by 2 to 3 percentage points of GDP (Figure 18). In the 1970s, investment ratios fell, in both Australia and for the OECD average, Australia's reduction of about 3 percentage points being slightly the larger. Subsequently however Australia's investment rates have recovered, widening the gap between Australian and overseas rates to something like the margin typical in the 1960s. The comparative data show that Australia's experience of a declining public sector contribution to aggregate investment has not been an isolated case. This seems rather to be a fairly typical response of governments under pressure for fiscal restraint, such as the United States and the U.K. Like Australia, these countries have also exhibited some tendency for private investment to expand, at least partially compensating for the reduced public sector contribution. These observations would seem to support the point made by McKibbin and Morling (1989), that the composition of the public sector balance can have an important influence on private sector behaviour.
2.7 Data Revisions and the Statistical Discrepancy
A regrettable feature of any study that relies on national accounts data is the degree of inherent unreliability of that data. To the extent that this problem can be quantified, it has two aspects: the existence of a large statistical discrepancy between the income and expenditure based estimates, and the potentially large revisions that can be made to published figures. It is important to be aware of both problems because on occasion they can influence the results of empirical work in identifiable ways (an example is described by Hawkins, 1979), or can influence the perceived background for policymaking (Hogan, 1979).
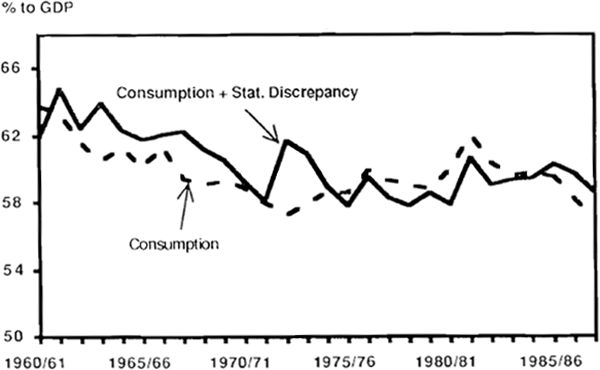
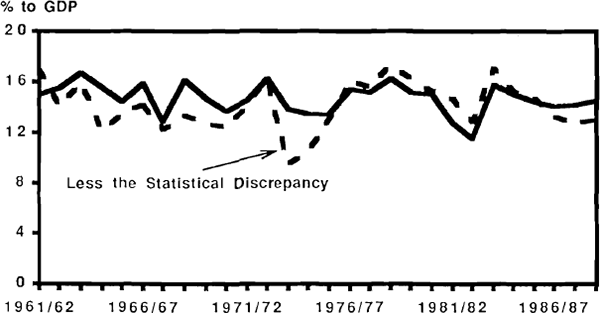
In a detailed statistical study of the discrepancy, McDonald and Monk (1975) reported that it was not uncommon for changes in the discrepancy to be larger than changes in GDP, this occurring in almost a third of the observations in their sample. Recent papers by Gregory (1989) and McKibbin and Morling (1989) on Australia's macroeconomic performance have noted that the interpretation of the discrepancy can have an important bearing on conclusions; this is especially so in the past four or five years, when the net movement in the discrepancy was more than 3 per cent of GDP. McKibbin and Morling argued for treating the discrepancy as unrecorded consumption, on the ground that the discrepancy and consumption were negatively correlated. Gregory was less specific but suggested the most plausible allocation would be somewhere within the private sector's net saving-investment imbalance, mainly because the public and external sector flows were likely to be more accurately measured. The importance of the discrepancy for the interpretation of consumption and saving data can be gauged from Figures 19 and 20. This paper takes the view that there is insufficient evidence as yet to justify any particular allocation of the discrepancy, but even on the extreme assumption that the discrepancy is entirely unrecorded consumption, the stability in broad terms of consumption and saving ratios does not seem to be overturned. It is important to keep in mind however that the smaller the aggregate being studied, the larger is the potential relative importance of the discrepancy for its interpretation.
On the subject of data revisions, some commentators have focused on implications for the reported levels of GDP, F. Gruen (1979) for example noting that initial estimates tend to have a downward bias. For present purposes the main issue is whether or not revisions have a systematic effect on relativities between major variables, particularly consumption, income and investment. Some evidence on this is provided by Rossiter and Brown (1989), who confirm a positive correlation between revisions to consumption and income, thus implying that consumption and saving ratios would be less influenced by data revisions than their component parts. To gain an idea of the vulnerability to revision of the variables focussed on in this paper, we conducted two simple exercises. The first was to take basic data on saving and investment ratios as available to researchers ten years ago, and compare them with the most recently revised estimates for that period. Results are shown in Figures 21 and 22. Secondly, we compared “first published” with “latest published” data for the same ratios over our full sample period (Figures 23 and 24).
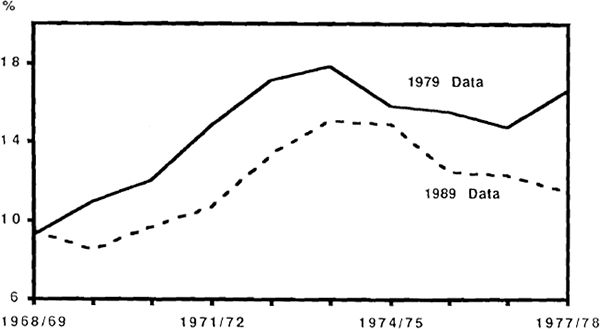
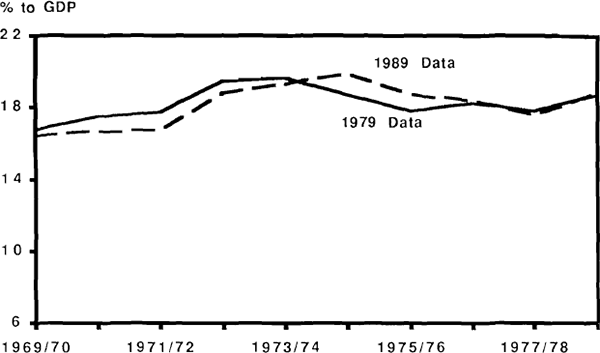
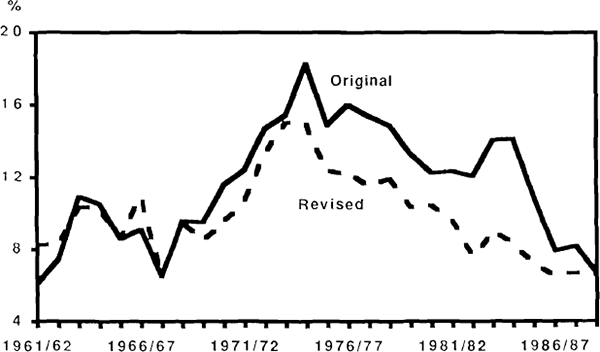
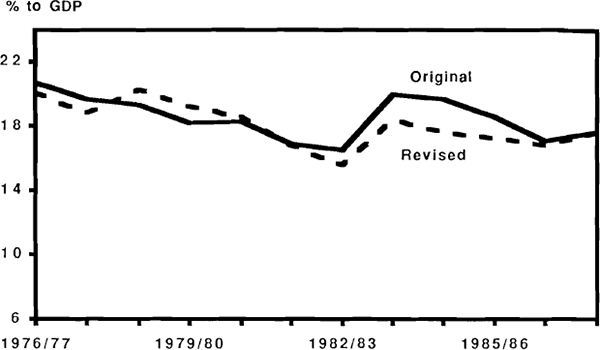
The results of the first exercise show that the gross saving ratios held up reasonably well, the ultimate revisions being quite small and not substantially altering the general picture. However the household saving ratio was subject to a quite major downward revision which removed roughly half of the rise originally reported in the early 1970s. The revision was due to a change in the method of estimating depreciation implemented in 1986, which had a substantial impact on all “net of depreciation” figures, of which the household saving ratio is one example. While this revision could obviously not have been predicted, it illustrates the point that depreciation figures can be somewhat arbitrary, and that published aggregates containing a depreciation component should not be accepted uncritically. Results for the second exercise are fairly encouraging; leaving aside the depreciation problem affecting net household saving, the comparisons indicate that revisions have had almost no impact on the basic trends in gross saving, and have had only small effects on the timing of movements in this ratio.
2.8 Summary
The main points raised in this essentially descriptive section were as follows:
- The widely quoted household saving ratio has declined steadily from its peak in the mid 1970s, and now stands at a level somewhat below its historical average. There are grounds however for thinking this statistic misleading and a broader measure, gross private saving, has been much more stable. Inflation adjustment increases the apparent stability. The largest deviation from average in this measure of saving occurred in 1982/83.
- Private investment has shown evidence of a slight upward trend over the period studied. This has compensated for a trend decline in investment by the public sector which appears to have become more pronounced in the most recent years.
- National saving (the sum of saving by the private and public sectors) fell substantially in the 1970s and remained low in the 1980s, due to a major fall in the public sector component. There has been some recovery in this component in the past two or three years.
- In broad terms, this decline in saving relative to investment has corresponded to a rise in the current account deficit. This correspondence is less clear in individual years however because movements in the statistical discrepancy can be quite large relative to the current account (as for example has been the case in the most recent 5 year period).
- Australia's gross saving rates have been close to the OECD average over a long period, and declines in national saving over the past decade and a half have paralleled those in other OECD countries. At the same time, Australia's gross investment rates have generally exceeded the OECD average, and on the most recent observations the gap has been widening.
Footnotes
Data sources for the paper are described in the data appendix. [1]
Some weak evidence to the contrary is provided by Poterba (1989) [2]
In principle, private sector debts to the foreign sector should also be inflation adjusted, but here the issues are more complex because the size of the adjustment depends on the mix of currencies in which those debts are denominated. Estimates presented in the appendix suggest that adjustments affecting the external sector are relatively small because the denomination of debts is heavily weighted toward low inflation currencies. However, omission of the external sector adjustment means that private savings are conservatively estimated when foreign debt is high. Nevile (1989) has recently calculated public sector inflation adjustments which are similar to those presented here. [3]
Hayashi (1989) has recently estimated a depreciation rate of 9.8 per cent in Japan. [4]
Imported computer prices have been falling steadily throughout the 1980s. Excluding computers, prices of imported capital goods fell by 10 per cent in the year to March 1989. [5]
This assumes unidentified flows are included in the net figure. [6]
The exact application of such funds is unclear because of the presence of large unidentified flows, which may represent further unidentified external asset acquisition. [7]
Public sector figures used in this paper are on a national accounts basis, and may therefore differ slightly front those given in Commonwealth Budget papers. [8]
We have not attempted to calculate inflation adjusted figures for these comparisons, but any adjustment would tend to lower private saving rates and correspondingly raise the savings of the public sector. For most countries the adjustment would be largest in the 1970s when OECD inflation rates were highest. [9]