RDP 9009: An Empirical Model of Australian Interest Rates, Exchange Rates and Monetary Policy Appendix: Confidence Intervals
November 1990
- Download the Paper 730KB
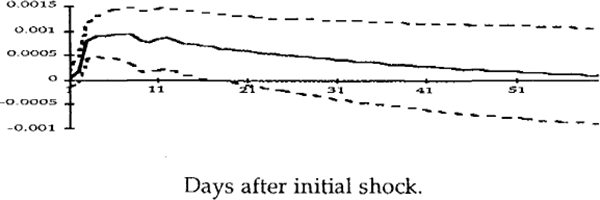
The following confidence intervals show 95 per cent confidence intervals for the difference between the period 1 (2/1/85 – 20/10/87) and period 2 (21/10/87 – 30/1/90) responses for each of the fifteen shocks reported in the paper. The solid line is the difference, while the distance between the dashed lines is the confidence interval, at each point in time.
95% Confidence Intervals For the Difference Between the Cash Rate Responses
Figure A.1: Federal funds rate shock

Figure A.2: U.S. bond rate shock.

Figure A.3: Exchange rate shock.

Figure A.4: Cash rate shock.

Figure A.5: Australian bond rate shock.

95% Confidence Intervals For the Difference Between the Exchange Rate Responses
Figure A.6: Federal funds rate shock.

Figure A.7: U.S. bond rate shock.

Figure A.8: Exchange rate shock.

Figure A.9: Cash rate shock.

Figure A.10: Australian bond rate shock.

95% Confidence Intervals For the Difference Between the Australian Bond Rate Responses
Figure A.11: Federal funds rate shock.

Figure A.12: U.S. bond rate shock.

Figure A.13: Exchange rate shock.

Figure A.14: Cash rate shock.

Figure A.15: Australian bond rate shock.
