RDP 9201: The Impact of Real and Nominal Shocks on Australian Real Exchange Rates 2. Real Exchange Rates and Productivity Growth
January 1992
- Download the Paper 635KB
This section examines changes in the AUD/USD and AUD/YEN real exchange rates over the previous two decades. It begins with an examination of the changes. Discussion of a simple model of real exchange rates follows. The model is then used to interpret the observed changes.
The real exchange rate (R) is defined by:
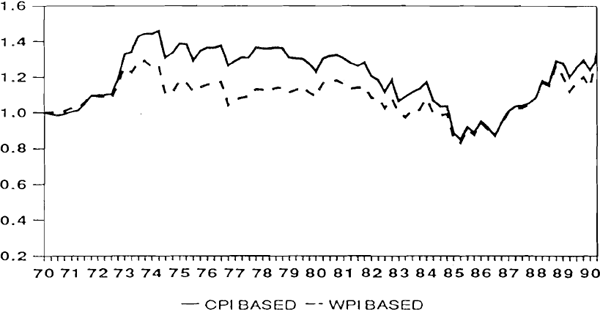
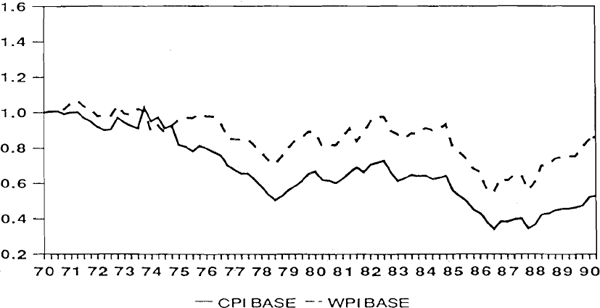
where P (P*) is the domestic (foreign) price level and E is the spot exchange rate, defined as the foreign currency cost of one unit of domestic currency. An increase in R represents a real appreciation. To construct an empirical measure of R a price index must be chosen. Three indices have commonly been used: the Consumer Price Index (CPI), the Wholesale Price Index (WPI) and the GDP deflator. Given that these three price indices are based on different baskets of goods, they should only yield the same results if there are no sector specific price shocks. McKenzie's (1986) study of Australia's effective real exchange rate found little difference in the CPI and WPI based measures. Here, bilateral real exchange rates are calculated using both the CPI and WPI.[2] The results are shown in Graphs 2 and 3. In the case of the AUD/YEN rate the two measures lead to quite different results.


Graph 2 presents the AUD/USD real exchange rate for the period from 1970 to 1990. It shows that while the net change in the real exchange rate over the period in not greatly influenced by the choice of price index there was a long period in the 1970s and the early 1980s when the CPI based measure showed considerably greater appreciation of the AUD than did the WPI based measure. Using either measure suggests that there has been some real appreciation against the USD since 1970. However, if 1973 had been chosen as the initial date the two measures would yield conflicting results; the CPI suggesting some real depreciation, the WPI some real appreciation.
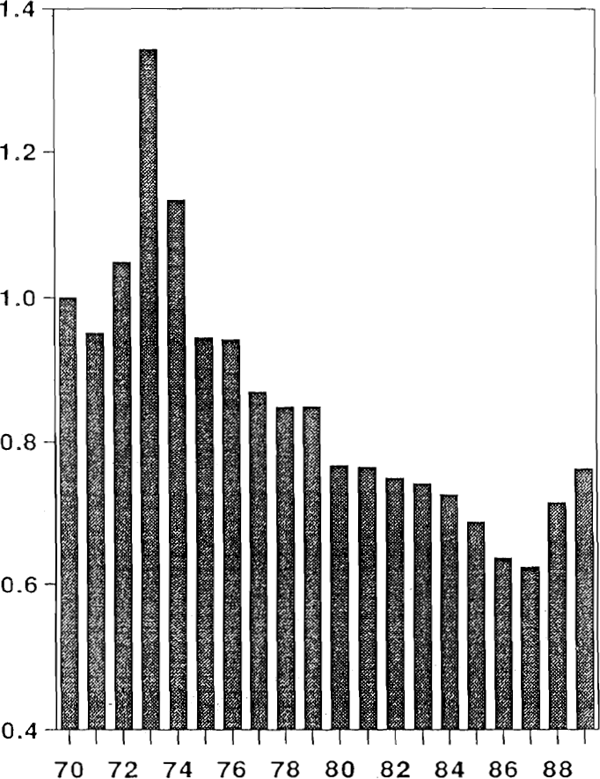
Graph 4 shows Australia's terms of trade over the last 20 years. As McKenzie notes, major changes in Australia's real exchange rate have often been associated with terms of trade changes. Three phases can be clearly distinguished from the graph: the rapid terms of trade improvement in 1973, the period of secular deterioration of the terms of trade between 1974 and 1987 and the period since 1987 which has been characterised by an improvement in the terms of trade. Each of these three periods are associated with changes in the AUD/USD exchange rate in the direction expected.

Graph 3 shows the AUD/YEN real exchange rate. It is clear from this graph that there has been secular real depreciation of the Australian dollar against the yen. The extent of this depreciation is, however, quite sensitive to the choice of price index. The CPI based measure shows a real depreciation of almost 45 per cent while the WPI based measure shows a depreciation of less than 15 per cent. The evidence presented below attributes this large disparity to differences in the rate of change in relative prices within Australia and Japan. The CPI has a much larger weight on non-tradeables than does the WPI. With Japanese non-tradeables prices increasing much faster than the prices of tradeables, the Japanese CPI has increased much faster than the WPI. This has resulted in a more significant real appreciation of the Japanese yen using the CPI based measure. The impact of changes in the terms of trade can also be seen in the AUD/YEN real exchange rate. Their effect is, however, much less pronounced than for the AUD/USD rate.
The principal models of real exchange rate determination generally yield one of two interpretations of the real exchange rate. In one class of models the real exchange rate is given by the terms of trade while in the other it is given by the price of non-tradeables relative to tradeables. These measures of the real exchange rate are equivalent to the above empirically used measure only under a number of relatively strict assumptions.
The real exchange rate is identified with the terms of trade if all goods are assumed tradeable and there are no impediments to trade. This definition of R falls out of standard two commodity, two country models of international trade. In the Ricardian model of trade, in which there is a continuum of goods, the equivalent definition of the real exchange rate is given by relative wages in the two countries (see Dornbusch, Fischer and Samuelson (1977)).
In the second set of models non-traded goods are introduced while the terms of trade are assumed exogenous and fixed. Given the fixed terms of trade, the prices of importables and exportables can be aggregated into a single price index, known as the prices of tradeables. The domestic and foreign prices indices are thus given by:
where PT is the price of tradeables and PN is the price of non-tradeables. Starred (*) variables refer to the foreign country. Substituting (2) into (1) the real exchange rate can be expressed as:
If the Law of One Price holds then  . The real exchange rate is thus
the relative price of non-traded goods at home divided by the relative price of non-tradeables
abroad. An increase in the home price of non-traded goods represents a real appreciation of the
domestic currency.
A critical aspect of this interpretation of the real exchange rate is the assumption that the terms of trade are exogenous. At a first approximation it is a reasonable assumption for Australia. Australia's share of world trade is small and her trading structure is highly specialised. In 1987 Australia accounted for 1.12 per cent of world trade. Its specialised trade structure is evidenced in its low level of intra-industry trade. In 1987 such trade accounted for just 12 per cent of trade. This compares with an average of 37 per cent for the entire OECD.[3] Developments in trade theory over recent years suggest that the low level of intra-industry trade reflects little trade in differentiated products where market power is strongest. While Australia may enjoy some market power in some of its primary commodity export markets, the exogenous terms of trade remains a reasonable assumption.
The above model is a not a complete model of exchange rates as the factors determining prices have not been specified. To tie down the relative prices the dependent economy model developed by Salter (1959) and Swan (1960,1963) is used.[4] The set-up is standard. There are two sectors: traded and non-traded. Goods in each sector are produced using labour and capital with constant returns to scale. Labour is mobile across sectors but capital is sector specific. Diminishing returns to labour are assumed. Factor returns and the price of non-tradeables are flexible ensuring a continuous full employment equilibrium. Equilibrium is defined by simultaneous domestic and external balance.
Within the context of this structure consider the effect of a productivity improvement in the home country's traded goods sector. At initial prices, the productivity shock increases demand for labour in the traded goods sector. This forces up the wage in terms of non-traded goods prices and causes output and employment to fall in the non-traded goods sector. Labour thus moves from the non-traded to the traded goods sector. At constant prices this results in excess demand for non-traded goods. To re-establish equilibrium the price of non-traded goods must increase relative to that of traded goods. That is, the real exchange rate must appreciate. Assuming no productivity growth in either country's non-traded goods sector, changes in the real exchange rate reflect differences in relative productivity growth in the two countries' traded goods sectors.
So far the terms of trade have been assumed exogenous and held constant. Suppose now that there is an exogenous increase in the demand for the home country's exports which increases their price. On the demand side this has both an income and substitution effect on the market for non-traded goods. Higher export income increases the demand for non-tradeables (assuming a positive income elasticity) while the higher prices of exportables leads to some substitution in consumption toward non-traded goods. On the supply side there is substitution away from non-traded goods. These developments result in an excess demand for non-traded goods. To re-establish equilibrium the relative price of non-traded goods must increase; the real exchange rate must appreciate.
Bringing the data to this simple model of real exchange rate determination is not a straightforward task. Debate exists over what constitutes tradeable and non-tradeable goods and how to measure the appropriate price indices.[5] Data limitations invariably constrain the choices made. In this paper the OECD Intersectoral Database is used. This database reports output and employment data for 10 different sectors for 14 OECD countries[6] over the period 1960 to 1985. Unfortunately, complete data exist for all countries only for the years 1970 through 1985.
Output of the agricultural, mining and manufacturing sectors is classified as output of the tradeable goods sector while the output of the remaining seven sectors[7] is classified as non-tradeable. To construct a measure of labour productivity, output in constant 1980 prices is divided by total employment.[8]
Price indices for the non-traded and traded goods sectors are constructed by dividing the current value of output by the value of output in 1980 prices. Price indices and labour productivity indices have also been calculated for the manufacturing sector. In most countries these closely mirror those of the tradeable goods sector. In countries such as Australia, where manufacturing output makes up a smaller than average share of the output of the tradeables sector, potentially large differences can exist in productivity growth in the manufacturing sector and the traded goods sector more generally.
Table 1 presents changes in relative prices and the growth of labour productivity between 1970 and 1985 for the different sectors. Data are reported for Australia, the USA and Japan. For purposes of comparison, data for the average of the other eleven countries are also reported. Before the results for Australia are examined two general points can be made. First, productivity growth has been considerably faster in the traded goods sector than in the non-traded goods sector. For the 14 countries the average increase in productivity in the traded goods sector over the 15 years has been 85 per cent. This compares with a figure of 21 per cent for the non-traded goods sector. The second point is that there has been a general increase in the relative price of non-tradeables. In light of the productivity numbers this is hardly surprising. As expected the changes in relative prices are highly correlated with changes in relative productivities. For the fourteen countries the correlation coefficient between productivity growth in manufacturing relative to non-traded goods and the relative price of manufactured goods in terms of non-traded goods is −0.83. For the entire traded goods sector the correlation is −0.30.
| AUSTRALIA | USA | JAPAN | OTHER | |
|---|---|---|---|---|
| RELATIVE PRICES (% Δ) |
||||
| PN/PT | +15 | +20 | +74 | +19 |
| PN/PM | +20 | +37 | +85 | +29 |
| PRODUCTIVITY GROWTH (%) |
||||
| Traded Goods (GT) | 60 | 44 | 158 | 84 |
| Manufactures (GM) | 48 | 56 | 147 | 65 |
| Non-Traded Goods (GN) | 16 | 4 | 42 | 21 |
 |
0.99 | 0.76 | 0.93 | |
 |
0.85 | 0.74 | 0.96 | |
|
NOTES 1. N subscripts refer to non-traded goods, T subscripts to traded goods and
M subscripts to the manufacturing sector. |
||||
Australian productivity performance in the non-traded goods sector has been broadly in line with the experience of most other OECD nations. It is less obvious that this has been the case in the manufacturing sector and the traded goods sector more generally. Productivity growth in the Australian manufacturing sector has been amongst the slowest of the 14 countries. Over the 15 years productivity in the Australian manufacturing sector increased 48 per cent. This compares with an average for the other 13 countries of 71 per cent. While faster productivity growth in the mining and agricultural sectors helped improve the performance of the entire traded goods sector, productivity growth in that sector has also been slower than average.
The simple real exchange rate model discussed above suggested that productivity growth in the traded goods sector relative to that in the non-traded goods sector was an important determinant of real exchange rate changes. The last block of Table 1 shows productivity growth in Australia's traded goods sector relative to that in the non-traded goods sector compared to that of the foreign country. A number less than one indicates that Australia's productivity growth in the traded goods sector relative to the non-traded goods sector has been slower than that of the foreign country. The comparison with the USA shows relative productivity growth in the traded goods sector to have been the same in Australia as in the USA. Relative productivity growth in manufacturing has, however, been faster in the USA. The results also suggest that productivity growth in the traded goods sector relative to that in the non-traded goods sector has been slower in Australia than the average for other OECD countries. Australia's performance has been particularly poor compared to that of Japan's. This is true both for the manufacturing sector and the entire traded goods sector.
While relative productivity performance has limited power in explaining short run exchange rate movements such changes are likely to help explain longer term changes. Unfortunately, insufficient data exists to test this proposition formally. Nevertheless, differences in the performance of the Australian dollar against the US dollar on the one hand and the yen on the other appear to be attributable to differences in relative productivity growth in the traded goods sector. If Australian productivity growth remains inferior to that of much of the OECD, then, in the absence of some sustained terms of trade improvement, the Australian dollar real exchange rates should be expected to depreciate in the medium and long term. This is especially the case for measures of the real exchange rate which are based on price indices which give a relatively high weight to non-traded goods.
Footnotes
The exchange rate, price indices, and the terms of trade data used in this section are from the IMF's International Financial Statistics. [2]
The intra-industry trade shares are calculated using SITC 3 digit bilateral trade data. See Lowe (1991) for additional details. [3]
Dornbusch (1980) provides a clear description of this model. [4]
See Goldstein and Officer (1979) for a discussion of these issues. [5]
The countries are USA, Japan, Canada, Germany, France, United Kingdom, Italy, Australia, Netherlands, Belgium, Denmark, Norway, Sweden and Finland. [6]
These sectors are (i) Electricity, gas and water, (ii) Construction, (iii) Wholesale, retail trade, restaurants and hotels, (iv) Transportation, storage and communication, (v) Finance, insurance and real estate, (vi) Community, social and personal services and (vii) Producers of government services. Data do not exist for the mining sectors of Belgium, France, Italy and the United Kingdom and for the finance, insurance and real estate sectors for Italy and the Netherlands. [7]
This measure of sectoral productivity has a number of problems. The classification system is far from perfect. Even if it were possible to distinguish between tradable and non-tradeable goods at a high level of disaggregation, international comparable data exist only at the one digit level of classification. This inevitably leads to some misclassification, For example, some financial services have increasingly become tradeable “goods” in recent years, yet are classified as non-tradeable. Such problems suggest that the results should not be taken as exact measurement of productivity performance in the different sectors but rather should be interpreted as showing broad trends. A second problem is that total employment is used in the denominator. When the number of hours worked, or the extent of labour hoarding differs across either time or industry, total employment does not provide an accurate measure of labour input. However, given that our interest is in long term trends, these issues are likely to be unimportant. [8]


