RDP 9211: Dividends and Taxation: A Preliminary Investigation 4. Trends in the Dividend Payout Ratio
October 1992
- Download the Paper 402KB
In this section we present three different sources of information on the dividend-payout ratio. These are from the annual national accounts, from a sample of companies quoted on the Australian Stock Exchange, and from earnings and dividend yield data from the Stock Exchange. The payout ratios from the two sets of stock exchange data are significantly higher than that calculated from the national accounts data. This is partly due to the different denominators used to calculate the ratio; gross cash flow is used for the national accounts measure while net profit after tax is used for the stock exchange measures. A further reason is that the national accounts measure includes smaller companies that are more likely to have a lower payout ratio. For small firms internal funding may be much cheaper than other forms of finance as these firms are likely to face higher costs of raising debt and equity in the market.
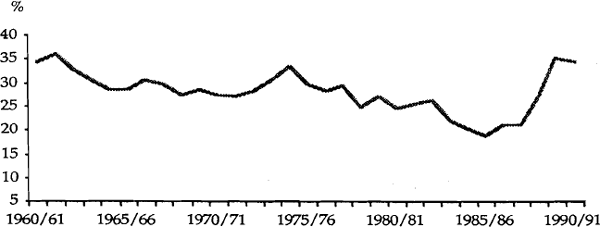
Long-run data are available from the National Accounts. Graph 3 plots the dividend payout ratio from 1960/61. It suggests that the data can be split into four periods:

- the 1960s where the payout ratio followed a gentle downward trend.
- the mid 1970s when the payout ratio rose quite sharply.
- the mid-1970s to 1986 when the payout ratio declined sharply reaching a trough of 18 per cent in 1985/86.
- 1986/87 to the present when the payout ratio rose quite sharply.
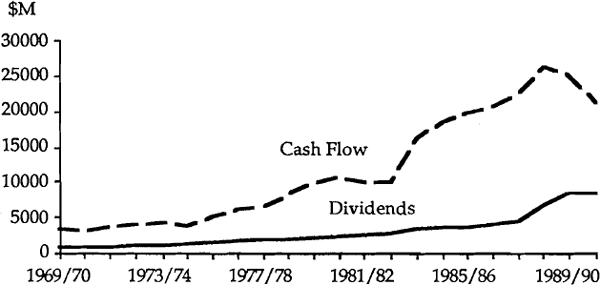
Graph 4 shows the components of the payout ratio separately. Cash flow is used to approximate the amount of funds that a company has available either to distribute to shareholders in the form of dividends, or to retain to invest in the company. Dividends exhibited only slow growth until 1987. Indeed, in real terms they remained virtually unchanged. Changes in the payout ratio over this period simply reflected movements in cash flow which grew strongly between 1974 and 1980 and then again between 1983 and 1989. Since 1987, dividends (in real and nominal terms) have risen, driving the payout ratio upwards, although the fall in cash flow has alsocontributed to the rise in the ratio.

A likely explanation of the change in dividend behaviour is that prior to the tax changes outlined earlier, companies retained at least part of any rise in cash flow because there was a significant bias in favour ofretentions. More recently, changes in cash flow have been more fully reflected in changes in dividends because of the tax advantages to shareholders of receiving dividends over capital gains. Another explanation is that companies found it hard to obtain external financing during the 1970s because of credit controls and periodic weaknesses in the equity market and so chose to retain a large proportion of their earnings.
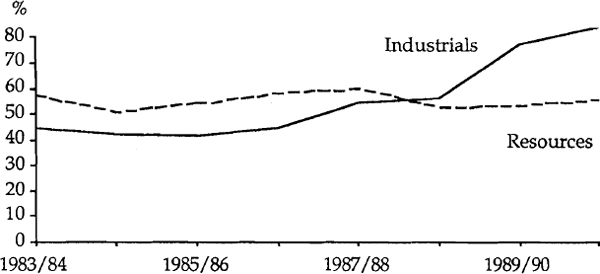
The dividend payout ratio calculated from the earnings and dividend yield data is shown in Graph 5 for companies in the industrials and resources indices. The industrial companies' payout ratio jumps sharply in 1988/89. The behaviour of the resource companies is somewhat different. The introduction of imputation appears to have had no impact on these companies and the payout ratio has remained around the 50 per cent level formuch of the 1980s. Nicol (1991) suggests that mining companies pay less income tax relative to income earned than their industrial counterparts, and are less likely to be able to fully frank their dividends. Thus tax changes have a limited impact on these companies.

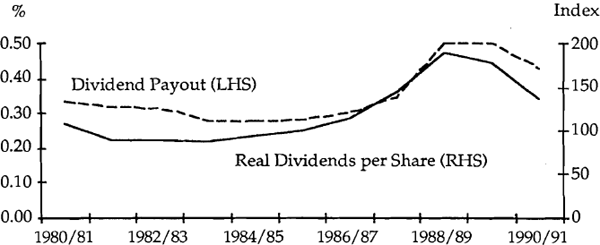
Graph 6 plots two dividend payout measures for a sample of 55 non-financial companies quoted on the Australian Stock Exchange. The first measure is the average payout ratio and the second measure is an index of average real dividends per share. Both measures show a flat profile until 1987/88, a sharp rise and thena fall reflecting the depressed economic conditions in the early 1990s. The latter measure is used in the empirical work reported below.

The above discussion shows that tax changes have occurred which, in theory, should have led to an increasein the proportion of firms' earnings paid out as dividends. At the same time there has been an increase in the various dividend payout ratio measures. However, other factors also affect dividend payout ratios. In the final section we use an econometric model to apportion the changes in dividends to the various effects. Weuse a sample of 55 non-financial companies quoted on the Australian Stock Exchange. Data are available from1980/81 to 1990/91.