RDP 9304: Exchange Rate Pass-Through: The Different Responses of Importers and Exporters Appendix 3: Testing for Cointegration
May 1993
- Download the Paper 115KB
In this paper, two different procedures are used to test for a cointegrating relationship. First, the residuals from the P-H estimation are tested for stationarity. Second, the statistical significance of the error-correcting term in the dynamic equation is examined.
(a) Tests of Residuals
The residuals from the P-H estimation were tested for stationarity using the Augmented Dickey Fuller Test (ADF) and the Phillips Perron Zt Test (Zt). The results are presented in Table A3.1.
| ADF | Zt | |
|---|---|---|
| Imports | −3.82 | −3.82 |
| Exports | −2.61 | −2.79 |
The critical values for the null hypothesis of non-cointegration are −3.77 at the 5 per cent level, and −3.45 at the 10 per cent level (Phillips and Ouliaris 1990). Lagrange multiplier tests were conducted to remove unnecessary lags from the ADF test equation. The number of covariance lags included in the Zt test was 5. The outcome of the test did not change when the number of covariances was varied.
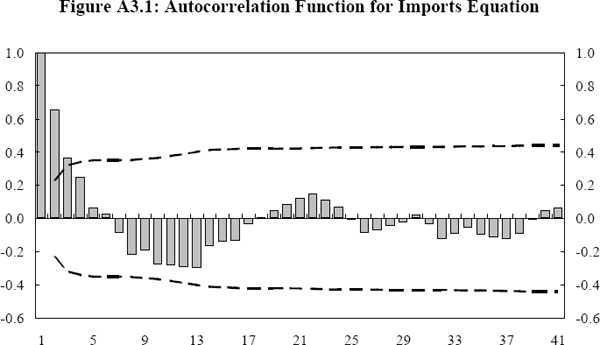
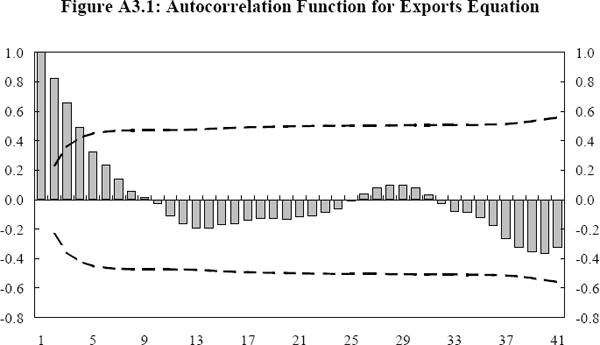
For imports, non-cointegration can be rejected at the 5 per cent level using both the ADF and the Zt tests. However, non-cointegration cannot be rejected for exports. An inspection of the autocorrelation function (ACF) for both series of residuals places some doubt on the finding of non-cointegration for export prices. If the sample autocorrelations die away rapidly as the lag length increases, the series is likely to be stationary.
The broken lines represent the approximate 95 per cent confidence bound for the sample autocorrelation function.[40] The sample autocorrelations from the imports equation become insignificant after one lag, strongly suggesting stationarity. For exports, the sample autocorrelations take only three to four quarters to die down, which is possible evidence of stationarity. The sample autocorrelation at lag 1 for the export equation is 0.82, and given the low power of the ADF and Zt tests, may explain the conflicting results between these tests and the ACF.


(b) Significance of the Error-Correcting Term
Given the rejection of cointegration for exports from tests on the residuals, the significance of the error-correcting terms in the P-H ECM were tested. Kremers, Ericsson and Dolado (1992) demonstrate that this test for cointegration is, in fact, more powerful than the tests based on the residuals from the cointegrating relationship.[41] The coefficient estimates and t-statistics for the P-H ECM are shown in Table A3.2, with t-statistics in parentheses.
| P-H ECM | |
|---|---|
| Imports | −0.16 (−2.3) |
| Exports | −0.10 (−3.0) |
For both export prices and import prices the null hypothesis of non-cointegration is clearly rejected.
In summary, there is unambiguous evidence of a cointegrating relationship for the import price equation. The null hypothesis of non-cointegration cannot be rejected for the export price equation using the Zt and ADF tests. However, a plot of the autocorrelation function suggests that the finding of non-cointegration may be due to the low power of these tests. Further, tests based on the significance of the error-correcting term in the ECM indicate that non-cointegration can be rejected for the export price equation. Given the relative power of these tests, combined with the theoretical basis for the existence of a cointegrating relationship, it appears safe to reject non-cointegration for the export price equation.
Footnotes
Bowerman and O'Connell (1979, p.343) provide a description of the estimated standard error of the sample autocorrelation function. [40]
The loss of power arises because the residual based tests assume that the dynamics are error dynamics, rather than structural dynamics, causing them to ignore potentially relevant information. The power of a test is the probability of not committing a type II error – that is, it is the probability of not accepting the null hypothesis when it ought to be accepted. [41]