RDP 9704: Financial Aggregates as Conditioning Information for Australian Output and Inflation 3. The In-sample Prediction Exercise
July 1997
- Download the Paper 139KB
Five different financial aggregates are used in this investigation: currency (CURR), M1, M3, broad money (BM) and credit of all financial intermediaries (CRED). Real GDP(A) is the output measure, and the underlying CPI is the measure of the price level. The financial aggregates are examined in four-variable VARs which contain inflation, real output growth, the differenced interest rate (90-day bank bill rate) and the growth rate of the relevant financial aggregate. The sample period begins in the fourth quarter of 1977 and ends in the second quarter of 1996. We follow Tallman and Chandra (1996) by using growth rates of the variables in the investigation. Further description of the above data series appears in Appendix A.
Our first empirical method employs a vector autoregressive model that includes four lags each of four variables. The technique involves performing a series of hypothetical in-sample prediction exercises that compare unconditional forecasts with conditional forecasts of real output growth and inflation. In this case, the conditional forecasts assume perfect knowledge of the next eight quarters of a given financial aggregate.
The models are specified in first difference form due to test statistics that suggest non-stationarity of the data in log-level form. We note, however, that the tests have low power, and as a result, we also estimate systems in log-levels (except for the interest rate) and find no substantial differences in the inferences.[3] The model outlined below provides a transparent representation of the VAR that is estimated for the exercise,
| where: | π is the inflation rate; |
| y is the output growth rate; | |
| i is the differenced interest rate; and | |
| m is the growth rate of the financial aggregate. |
The VAR model is estimated over the full sample, thus producing one set of coefficient estimates for the entire forecasting procedure. Using the estimates, we produce conditional and unconditional forecasts of real output growth and inflation over an eight-period forecast horizon. All forecasts are dynamic system forecasts, and in this setting they are in-sample. The unconditional forecasts are unconditional in the sense that when forecasting from date t for periods t+1, t+2, t+3, etc., no additional information on any of the variables is available beyond period t. In contrast, the conditional forecasts of real output and inflation use actual values (instead of forecasted values) of the financial aggregates. For example, at period t when forecasting real output growth for period t+5, the unconditional forecasts use internal model forecasts of all the right-hand side variables in the VAR, including the financial aggregate, for periods t+1 to t+4. The conditional forecast of real output growth in period t+5 made at period t uses actual values for the financial aggregate combined with forecasted values of inflation, real output growth and the interest rate for observations dated periods t+1 to t+4. Thus, these forecasts are conditional on knowledge of the financial aggregate.
The forecast errors for the right-hand side variables in the equation for either real output growth or inflation contribute to the measured unconditional forecast error for the policy variable. Knowledge of the future values of one of the right-hand side variables reduces the average forecast error of either real output growth or inflation over the forecast horizon by eliminating one source of the forecast error. Suppose that for the next eight quarters the values of the financial aggregate are known with certainty. Then, the forecast that employs this information is conditional – there is perfect information on one of the variables. As a result, that variable (in our case the financial aggregate) will not contribute forecast errors to the forecasts of either real output growth or inflation because that component is known. What remains is to determine the extent to which this information improves the forecast accuracy for real output growth and inflation by comparing the forecast accuracy of the unconditional versus the conditional forecast. To do this we calculate the measured improvement in the conditional from the unconditional forecast (see Appendix B for details). The ‘improvement’ statistics that we present represent the approximate average reduction, in per cent, of the standard deviations of the one- through eight-step-ahead forecast of the indicated variable that would result from knowledge of the next eight quarters of the given aggregate. This procedure leaves us without a way to judge whether this difference is statistically significant; to overcome this issue, we generate 1,000 draws of a Monte Carlo simulation exercise to produce estimates of the standard deviations of the percentage improvements.
In contrast to out-of-sample evidence, this prediction exercise provides a clearer basis of evaluation for two reasons. First, because Monte Carlo simulation of the forecasts allows calculation of the standard deviation of improvement in forecasting accuracy, we can make statistical inferences about the significance of forecast improvements. Second, the system employs all of the data for the entire sample period to estimate the parameters of the model, so the statistical fit of the model in the forecasting exercises remains the same over the chosen sample. While the prediction exercise is clearly less realistic than out-of-sample forecast evaluations, the results are easier to make inferences from. The information value of each of the aggregates is examined using estimates from both the full sample and a sample that ends in the fourth quarter of 1989. We examine this shortened period to gauge whether inclusion of data from the 1990s has a substantial impact on the results.
The columns in Tables 1 and 2 entitled ‘improvement’ present the percentage reduction in the forecast error measure for either real output growth or inflation given perfect knowledge of the financial aggregates. The numbers in the ‘improvement’ column may be viewed as gauging the level of information content in the financial aggregates for the policy measures.[4]
| Variable forecasted | Aggregate used in forecast | Sample | Improvement(a) |
|---|---|---|---|
| Real GDP growth | M3 |
1977:Q4 – 1989:Q4 |
8.71 % (2.98) |
| Real GDP growth | M3 |
1977:Q4 – 1996:Q2 |
8.95 % (3.44) |
| Inflation | M3 |
1977:Q4 – 1989:Q4 |
9.39 % (2.76) |
| Inflation | M3 |
1977:Q4 – 1996:Q2 |
5.69 % (1.61) |
| Real GDP growth | M1 |
1977:Q4 – 1989:Q4 |
17.22 % (2.77) |
| Real GDP growth | M1 |
1977:Q4 – 1996:Q2 |
10.88 % (1.51) |
| Inflation | M1 |
1977:Q4 – 1989:Q4 |
6.77 % (3.38) |
| Inflation | M1 |
1977:Q4 – 1996:Q2 |
5.96 % (1.73) |
| Real GDP growth | Broad money |
1977:Q4 – 1989:Q4 |
7.44 % (3.20) |
| Real GDP growth | Broad money |
1977:Q4 – 1996:Q2 |
10.79 % (3.99) |
| Inflation | Broad money |
1977:Q4 – 1989:Q4 |
11.19 % (4.51) |
| Inflation | Broad money |
1977:Q4 – 1996:Q2 |
9.34 % (3.04) |
| Note: (a) ‘Improvement’ denotes approximate average reduction in the standard deviations of the one-through eight-quarter-ahead forecasts. The value of the improvement is the mean value from one thousand Monte Carlo replications. Standard deviations are in parentheses. | |||
| Variable forecasted | Aggregate used in forecast | Sample | Improvement(a) |
|---|---|---|---|
| Real GDP growth | Credit |
1977:Q4 – 1989:Q4 |
17.19 % (3.31) |
| Real GDP growth | Credit |
1977:Q4 – 1996:Q2 |
16.91 %*(b) (2.74) |
| Inflation | Credit |
1977:Q4 – 1989:Q4 |
3.62 % (1.81) |
| Inflation | Credit |
1977:Q4 – 1996:Q2 |
5.43 % (1.26) |
| Real GDP growth | Currency |
1977:Q4 – 1989:Q4 |
9.59 % (3.78) |
| Real GDP growth | Currency |
1977:Q4 – 1996:Q2 |
4.20 % (1.79) |
| Inflation | Currency |
1977:Q4 – 1989:Q4 |
5.63 % (2.53) |
| Inflation | Currency |
1977:Q4 – 1996:Q2 |
10.93 % (1.83) |
| Notes: (a) ‘Improvement’ denotes approximate average reduction
in the standard deviations of the one- through eight-quarter-ahead forecasts.
The value of the improvement is the mean value from one thousand Monte
Carlo replications. Standard deviations are in parentheses. (b) We regard a useful information variable as one where the level of improvement is bounded above 10 per cent in each of the subsamples. * denotes that the aggregate used in the forecast is a useful information variable for the variable forecasted. |
|||
It is useful to examine how the empirical technique generates the empirical findings. This conditional forecasting exercise hinges on two aspects of financial aggregates in the statistical model:
- the importance of financial aggregates in the equations for real output growth and inflation; and
- the statistical fit for the financial aggregate equation itself.
It is possible that a poor fit in the financial-aggregate equation would imply that perfect information on the financial aggregate would lead to a very large improvement in the forecast accuracy of real output growth. The intuition here is that large errors in the unconditional forecast resulting from a poor fitting financial-aggregate equation are removed when perfect information on the financial aggregate is added. Still, any positive findings would imply that the financial aggregates have a significant correlation with real output growth or inflation.
We note that the only circumstance in which the conditional forecast cannot improve upon the unconditional forecast is when the forecast errors of the financial variable and those of real output growth and inflation are independent.[5] The empirical question then is not whether there is an improvement in the forecast accuracy measure moving from the unconditional to the conditional forecast error covariance matrix, but the degree of (in our case percentage) improvement in the measure.
We consider improvements to be significant if the lower bound of the improvement is above 10 per cent, using a one standard deviation (from the Monte Carlo simulations) criterion to determine the range of likely outcomes. Under this criterion, there is no aggregate that shows a significant improvement in the conditional relative to unconditional forecasts of inflation across both samples. The implication is that knowledge of future values of the aggregates would yield relatively little information about future price changes.[6] Similar results also hold for real output growth, with only perfect knowledge of growth in the credit aggregate leading to sizeable improvements in the forecast accuracy of output growth in both samples.[7]
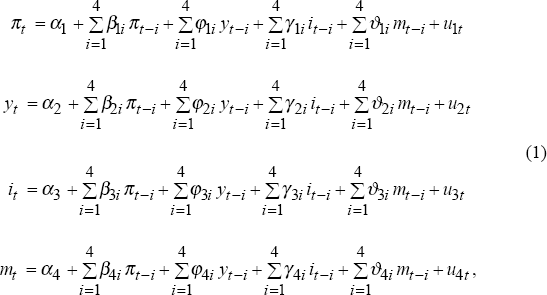
Figure 1 shows the errors for the unconditional and conditional forecasts of real output growth. Most of the time, information on future credit growth would have led to only a minor improvement in forecast accuracy. The one important exception is the 1990–91 recession (see shaded area). If one had known the extent of the decline in credit growth, one would have produced much better forecasts of output than those produced by the unconditional VAR.
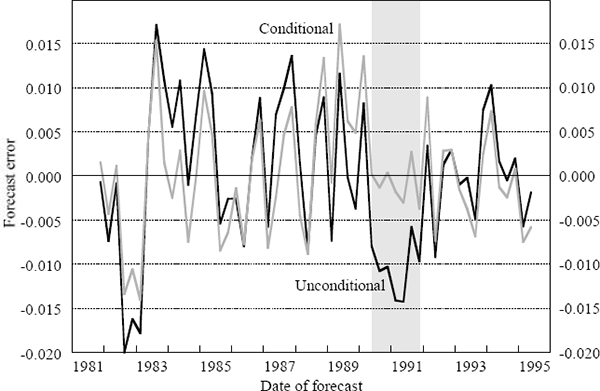
Figure 2, which displays four-quarter-ended growth in real output and credit, helps explain this result. The shading in the figure begins in the June quarter of 1989 because it is the date when forecasts are made for June quarter 1990, the time when the forecasts improve. The important point to note is that the behaviour of credit growth relative to real output growth during the period appears to have been different from other parts of the sample.
The usefulness of actual information on credit over this period reflects two factors. The first is that there was a change in relationship between credit growth and lagged values of credit and output growth; during the early 1990s the forecast errors for credit growth in the VAR were larger than average. Second, the interactions between actual credit growth and output seems to have strengthened in the late 1980s – early 1990s. Not surprisingly, with a stronger link between changes in output and credit, using actual information on credit (as opposed to rather poor forecasts) generates a substantial improvement in the forecasts for output.
Previous research has tended to find that credit is endogenous to output.[8] If this is the case the usefulness of future values of credit growth in predicting output may simply reflect that idea that increases in real output lead to credit growth in the future. If this is the case, then credit is of little use, for if we knew future values of credit we would know future values of output. For credit to be useful it must have some predictive power, independent of the feedback effect from output.
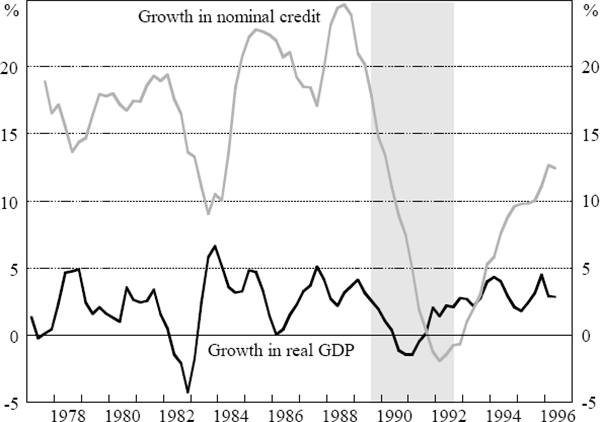
To examine this issue we calculate two forecasts of output growth four periods ahead. Each forecast assumes perfect knowledge of real output growth for the first three forecast periods, but the conditional forecast includes perfect information on the growth rate in the credit aggregate, whereas the unconditional forecast does not. Thus, the conditional forecasts now include actual data on both output and credit, while the unconditional forecast uses actual data on output but model-generated forecasts of credit. If the usefulness of credit reflects the fact that it is endogenous then there should be little difference between these new conditional and unconditional forecasts.
The results are reported in Figure 3. While the differences between these new conditional and unconditional forecasts are smaller than previously, there remains a substantial difference. We note that the improvement in forecast errors for the conditional forecast during the 1990–92 recession period holds up in this experiment. Thus, we can infer that future information on credit growth is not just reflecting information contained in past real output growth. Further, the results suggest that credit growth was particularly important for explaining the behaviour of real output growth during that episode.
This implies that while credit is partly endogenous to output, changes in credit did have some independent information regarding future developments in output. Again, this conclusion appears to be specific to the late 1980s – early 1990s when major financial restructuring of corporate balance sheets was taking place.
These empirical results point out a feature of the Australian economy in the late 1980s that was a focus of monetary policy discussions. Following the 1987 stock market crash and throughout most of 1988, there was a notable increase in the growth of nominal credit that was associated with rapid appreciation of asset prices, specifically commercial real estate prices. The rapid credit growth meant that Australian firms were more highly geared than in previous business cycles; the higher gearing made them more sensitive to changes in interest rates and downturns in the business cycle. When the downturn came, considerable balance sheet restructuring was required and this played a role in the protracted nature of the recession (Figure 2). The steep decline in the growth rate of credit from late 1988 to 1992 provided an important indicator of the depth of the contraction in real economic activity.
The conditional forecasting exercise highlights the instrumental role that perfect knowledge of credit would have played in explaining this episode; if one had known the actual path of credit, better forecasts of real output growth could have been made. However, there is little evidence that information on credit is important in other periods where the dynamics of the business cycle are less influenced by financial and balance sheet factors. Aside from that period of financial restructuring, credit appears to be endogenous with little independent information about the future course of real output.
We weigh the preponderance of evidence that refutes the predictive power of the credit aggregate for the real output against the positive suggestions of our prediction exercise. The likely endogeneity of credit to real output in most periods suggests that monitoring credit aggregates is useful for confirming past behaviour of real output growth; however, there appear situations in which the credit aggregate is informative for predicting output, particularly in times of financial distress.[9] Thus, the credit aggregate may be especially useful for predicting real output growth during specific episodes. The challenge is to judge beforehand those episodes in which information on the credit aggregate is likely to be of unusually high importance.
The validity of the prediction exercises, as all the statistical evidence in Tallman and Chandra (1996), is dependent on the adequacy of the four-variable VAR framework to capture the dynamics of inflation and real output growth in Australia. This is not an entirely satisfactory setting given that Australia is a small, open-economy and is heavily influenced by developments in the world economy.[10] In the next section, we extend our analysis by examining the explanatory power of financial aggregates in reduced-form equations of real output growth and inflation.
Footnotes
Results are available on request from the authors. We also performed a VAR estimation in which only the interest rate was in levels and the remaining variables were in growth rates. The results from that specification were similar to those presented in the paper. [3]
In contrast to the variance decomposition results generated by Tallman and Chandra (1996), this in-sample prediction exercise is not dependent on the structural ordering of the variables in the system. For variance decomposition analysis, researchers investigate the source of the forecast errors and hence the structural ordering used is crucial. [4]
This is a stronger restriction than Granger non-causality (Roberds and Whiteman 1992). [5]
These prediction tests provide a ‘low hurdle’ for monetary aggregates as measures informative for real output growth and inflation due to the unrealistic assumption that we have perfect knowledge of future values of the financial aggregate. Evidence that future financial aggregate information is not helpful for predicting real output growth and inflation is particularly negative considering the strong assumption in the experiment that the future data is known with certainty. [6]
We investigated whether the degree of improvement varied significantly on the basis of forecast horizon. The results are essentially unchanged if the forecast horizon is extended from 8 to 16 periods. However, there is notably less improvement when the forecast horizon is limited to only 4 periods. Because there are fewer periods in which certain information on the credit aggregate can affect the forecasts of the target variables, knowledge of the financial aggregate has diminished influence on the forecasts over the 4-period horizon. [7]
For example, Stevens and Thorp (1989) who find that output generally leads credit. [8]
We examined whether sub-components of the credit aggregate (business credit, housing credit, and personal credit) as conditioning information improve notably the forecast accuracy for the target variables. Here, we found that business credit appeared the key component, although the results were not notably different from the credit aggregate results. [9]
See Gruen and Shuetrim (1994) for an investigation of the dependence of Australian output on foreign output growth. [10]