RDP 2006-01: Modelling Manufactured Exports: Evidence from Australian States 3. The Characteristics of State Exports and their Determinants
April 2006
- Download the Paper 484KB
3.1 Manufactured Exports
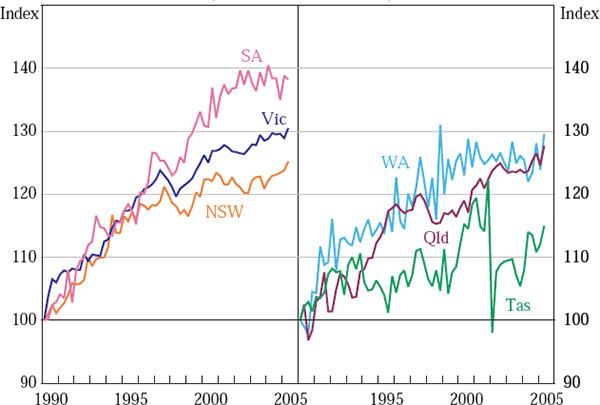
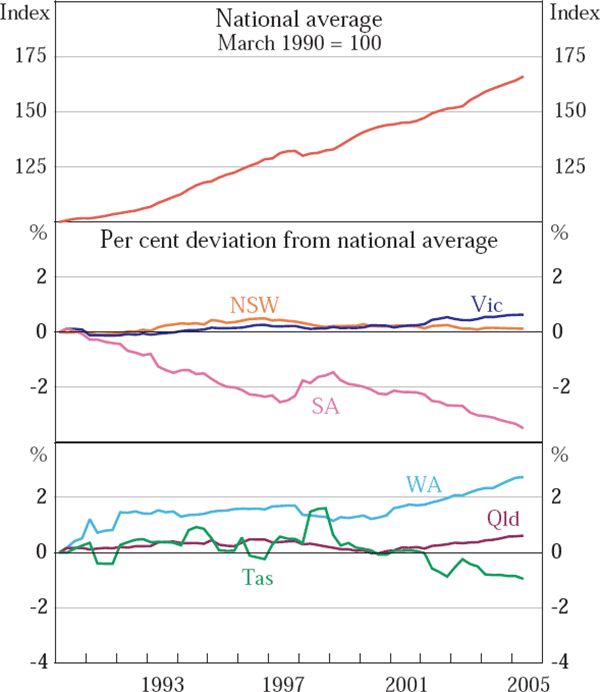
Quarterly data on manufactured export volumes are not published, but it is possible to construct such series by deflating the value of each state's manufactured exports at a disaggregated level by the corresponding deflator at a national level.[1] This is done for the period from the March quarter 1990 to the June quarter 2005. Figure 1 shows the resulting series, and highlights the variation in the profile of each state's exports.[2] In particular, since the early 1990s South Australian export growth has outpaced that of other states, while growth in NSW has been slower than all states other than Tasmania. Table 1 provides some detail on the growth rate of each state's manufactured exports. All states (except Tasmania) recorded rapid and relatively similar growth during the 1990s, but there has been more marked divergence in growth rates since 2000, with exports from NSW and Western Australia slowing quite markedly.
Sources: ABS; author's calculations
| Vic | NSW | SA | WA | Q1d | Tas | |
|---|---|---|---|---|---|---|
| Trend growth (per cent per annum) | ||||||
| 1990–2004 | 8.5 | 7.0 | 13.3 | 7.6 | 8.2 | 2.6 |
| 1990s | 10.7 | 10.1 | 14.9 | 10.6 | 10.2 | 2.0 |
| 2000–2004 | 3.4 | 0.3 | 5.5 | −1.0 | 6.6 | −6.5 |
| As a share of: | ||||||
| National manufactured exports | 36.5 | 28.2 | 16.1 | 9.6 | 8.9 | 0.7 |
| State exports | 27.2 | 15.6 | 38.9 | 5.9 | 7.0 | 5.9 |
|
Notes: Trend growth is calculated using a logarithmic regression of exports on a time trend, and is expressed in volume terms. All shares are calculated using the value of total exports, both service and merchandise. |
||||||
The bottom half of Table 1 also presents some information about the importance of manufactured exports for each state. Victoria is the largest manufacturing state, measured by the absolute size of manufacturing exports, accounting for over one-third of national manufactured exports. Combined with NSW and South Australia, the second and third largest manufacturing states, the three largest manufacturing states comprise over 80 per cent of national manufactured exports. Despite Victoria's large absolute size, the relative importance of manufacturing exports is greatest in South Australia, with manufacturing exports comprising 39 per cent of total exports in that state, followed by Victoria (27 per cent). In contrast, manufactured goods comprise a very small portion of total exports from Queensland, Western Australia and Tasmania.
There is also considerable diversity in the mix of manufactured goods exported by each state, which is highlighted in Table 2. The importance of transport equipment in Victoria, South Australia and Tasmania is immediately evident, reflecting the location of much of the automotive industry in these first two states and boat building in Tasmania. The share of beverages in South Australia is also substantially larger than in other states, underpinned by the wine industry. In contrast, Western Australia is heavily reliant on chemicals and metal & minerals manufacturing, consistent with the location of much of the mining industry in this state. Manufacturing in NSW is more evenly spread across sub-industries, compared with other states.
| Vic | NSW | SA | WA | Q1d | Tas | |
|---|---|---|---|---|---|---|
| Transport equipment | 27.2 | 5.9 | 37.2 | 11.8 | 14.2 | 44.2 |
| Machinery | 30.5 | 32.4 | 12.1 | 22.3 | 40.5 | 13.0 |
| Metals & minerals | 3.5 | 6.8 | 3.1 | 12.7 | 8.5 | 1.0 |
| Chemicals | 16.3 | 26.1 | 3.8 | 45.4 | 20.4 | 20.8 |
| Beverages | 4.1 | 8.5 | 38.3 | 1.9 | 0.9 | 0.9 |
| Other | 18.4 | 20.3 | 5.4 | 6.0 | 15.6 | 20.1 |
| Note: Shares calculated as the average shares of quarterly data from 2000 to 2004. | ||||||
These differences in the composition of manufactured goods are also likely to induce variation in the importance of each country as an export destination. However, data on the destination of exports by state are only available for total merchandise trade, which may be unduly influenced by the destination shares of resource and rural exports, given their importance in Australia's overall export basket. Hence, manufacturing-specific export destination shares by state are constructed by assuming that the export destinations of any given (2-digit SITC) manufactured product are invariant across states; automotive producers are assumed to export to the same set of countries, regardless of the state in which they are located. Consequently, the share of manufactured good i exported to country j is uniform across states and is derived from national data on the destination of manufactured goods. These shares can then be used to calculate the importance of that country for the state's manufactured exports according to the shares of the various manufactured goods in that state's exports, as follows:
where:  is the share of manufactured exports from state s
to country j; xi,s is exports of manufactured product i
from state s; xs is total manufactured exports for that state;
is the share of manufactured exports from state s
to country j; xi,s is exports of manufactured product i
from state s; xs is total manufactured exports for that state;  is
national exports of manufactured product i to country j; and xi
,Aus is total national exports of manufactured good i.[3]
is
national exports of manufactured product i to country j; and xi
,Aus is total national exports of manufactured good i.[3]
Table 3 shows the share of each state's manufactured exports to various destinations resulting from this calculation. The most obvious variation across states is in the share of manufactured exports going to other east Asia – around 25 per cent for NSW and Victoria, but 35 per cent for Western Australia and only 14 per cent for South Australia. Among the larger manufacturing states, the share of Victorian and South Australian exports to ‘Other countries’ is noticeably larger than in NSW, reflecting the importance of Saudi Arabia as a customer for the automotive industry. South Australia is also considerably more reliant on the UK as a destination, given that country's importance as a wine importer.
| Vic | NSW | SA | WA | Q1d | Tas | |
|---|---|---|---|---|---|---|
| NZ | 19.5 | 20.6 | 14.2 | 15.0 | 20.2 | 15.7 |
| Japan | 4.1 | 4.5 | 3.5 | 7.3 | 4.9 | 2.8 |
| Other east Asia | 25.6 | 26.3 | 14.1 | 34.5 | 28.2 | 22.3 |
| US | 20.3 | 20.3 | 24.6 | 17.8 | 19.0 | 25.0 |
| UK | 5.4 | 8.4 | 15.6 | 4.9 | 5.1 | 7.5 |
| Euro area | 8.1 | 10.9 | 6.3 | 11.7 | 10.3 | 18.1 |
| Other countries | 17.0 | 9.1 | 21.8 | 8.9 | 12.3 | 8.6 |
|
Note: Shares calculated as the average share of monthly data from 2000 to 2003. |
||||||
3.2 Competitiveness
These differences in trading partner composition produce varying trends in the competitiveness of the manufacturing industry in each state as measured by effective exchange rates. This is particularly relevant when there are sizeable movements in bilateral exchange rates between Australia's trading partners, as has occurred over the past decade; the US dollar is around 25 per cent above its 1990s average against the yen and a basket of Asian currencies (in real terms), but remains around its 1990s average against the euro. It is likely that these divergences will have caused states that trade most heavily with Asian nations – Western Australia, NSW and Victoria – to have appreciated by more than states that trade mostly with Anglo and European nations – such as South Australia – against whom the Australian dollar has been relatively steady.
These differences in trading partner composition can be combined into a single effective exchange rate using the methodology recommended by Ellis (2001).[4] Of course, competitiveness of firms in one economy relative to those in other is not only affected by the nominal exchange rate between their currencies, but also by differences in the prices charged for their products. Real effective exchange rates for each state are therefore calculated to measure competitiveness using the following formula:
where:  represents the share of manufactured exports from state s
to country j at time t; ERj is the number of Australian
dollars per unit of country j's currency; and P and Pj
are the domestic and foreign price levels, respectively.
represents the share of manufactured exports from state s
to country j at time t; ERj is the number of Australian
dollars per unit of country j's currency; and P and Pj
are the domestic and foreign price levels, respectively.
The choice of which price series to use in the real exchange rate calculations is not straightforward. Ideally, the price series will be specific to the manufacturing industry in each state, and will closely match actual export prices. Most recent studies (including Caporale and Chui 1999, Senhadji and Montenegro 1999 and Dvornak et al 2005) have used export unit values for this purpose. This ensures that they closely measure export prices, but, as noted by Kemp (1962), the use of export unit values as a deflator can bias the estimated price elasticities towards 1 if these same prices are also used to deflate the nominal value of exports.[5] Relative consumer price indices or unit labour costs are other commonly used price series, but these indices are more closely related to input costs than actual export prices (Chinn 2005 refers to such indices as measures of cost competitiveness). For these reasons, this paper uses aggregate manufacturing producer prices. These series are likely to be fairly close measures of actual export prices and are manufacturing-specific. However, they are not separately available for each Australian state, and it is necessary to assume that trends in producer prices are uniform across states.[6]
3.3 Trading Partner GDP
Differences in the composition of trading partners across states may also produce variation in the strength of foreign demand if growth of foreign income diverges across countries. Indeed, states which trade heavily with east Asian countries are likely to have seen more rapid growth in the GDP of their trading partners, which might provide some offset to their greater loss of competitiveness.
The index of foreign GDP for state s, YFs(t), is calculated by taking a weighted average of each trading partner's GDP, using the weights constructed in Section 3.1, and chain-weighting the resultant series:
where:  is the share of manufactured exports to country j
at time t; Yj(t) is GDP of country j at time t;
and B is the number of quarters elapsed since the March quarter of the previous year
(the base period). The constructed series are presented in Figure 2. As expected, Western
Australia has seen the fastest growth in its trading partners' income, reflecting its large
export share with east Asian nations, particularly China. In contrast, the growth of South
Australia's trading partners has been considerably less, reflecting its greater exposure to
more moderate growth countries such as the US and UK.
is the share of manufactured exports to country j
at time t; Yj(t) is GDP of country j at time t;
and B is the number of quarters elapsed since the March quarter of the previous year
(the base period). The constructed series are presented in Figure 2. As expected, Western
Australia has seen the fastest growth in its trading partners' income, reflecting its large
export share with east Asian nations, particularly China. In contrast, the growth of South
Australia's trading partners has been considerably less, reflecting its greater exposure to
more moderate growth countries such as the US and UK.
Footnotes
This deflation is done using 2-digit SITC data, to allow for variations in price movements for different manufactured goods. Further details of these calculations are given in Appendix A. [1]
The sources for all data used in the paper are given in Appendix A. [2]
An alternative to constructing these manufacturing-specific weights is to use published data on the destination of merchandise exports by state. The method described by Equation (1) is preferred to this alternative for two reasons; merchandise export weights are heavily influenced by the destination of resource exports and differences in the resource-intensity of states, which could unduly alter the results; and merchandise weights limits the sample of destination countries to only 10 (compared with 23 used in this paper). Nonetheless, the results in the remainder of this paper are qualitatively robust to the use of export destination shares based on total merchandise exports. [3]
These indices use the same 23 countries as are included in the trade-weighted index (TWI) published by the Reserve Bank of Australia, with the exception of Taiwan and Vietnam, for which there are data limitations. As with the TWI, the index is re-weighted annually, using prior-year data. [4]
This depends on the method of calculating real series. Dvornak et al use directly calculated volume estimates, and their results are therefore unlikely to be affected by such bias. However, the volume estimates used in this paper are calculated by deflating nominal values by price deflators, and using unit values would therefore induce some bias. [5]
Trends in wage prices across states provide some evidence in favour of this assumption – the range in trend annual growth in the wage price index is only 0.2 of a percentage point. [6]