RDP 2014-08: The Effect of the Mining Boom on the Australian Economy Appendix C: Modifications to the Model
August 2014 – ISSN 1320-7229 (Print), ISSN 1448-5109 (Online)
- Download the Paper 2.02MB
Although AUS-M is designed to be able to simulate a wide range of scenarios, the mining shock we consider pushes the model into unfamiliar territory. Some simplifications that ordinarily work well are less obviously applicable in the construction of our counterfactual. Accordingly, there are some places where we have brought extra judgement to bear. Were these changes to be a routine feature of AUS-M simulations, we would modify the model so that these responses were automatic. But for this one-off exercise, that complication is not worthwhile. Instead, we make some ad hoc adjustments. This appendix describes the more important of these.
C.1 The Decline in Mining Capital Productivity
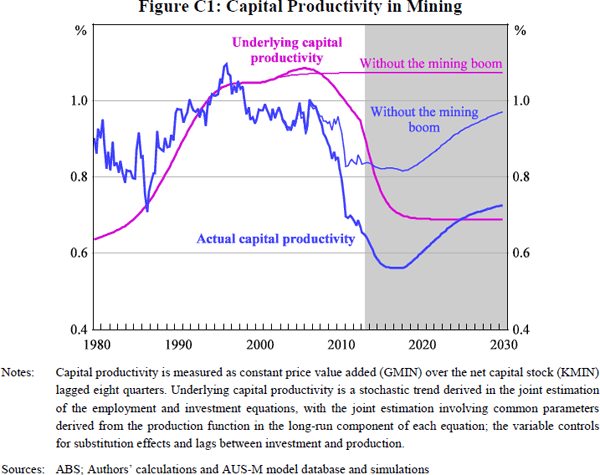
One large adjustment, which we also apply to the MMRF simulations discussed in Appendix B, is to underlying capital productivity in the mining sector. Whereas this is usually modelled as an exogenous stochastic trend, we assume that its recent decline is attributable to the mining boom. Accordingly, we remove this decline from the counterfactual.
Capital productivity in the mining sector is measured as chain linked value added divided by the net capital stock at replacement cost. This has two important components, shown in Figure C1. First, longer-term changes in technology are modelled by a stochastic trend and shown as the pink lines. In the projections the trend declines, so as to reconcile the model's mining output and export forecasts with those from the Bureau of Resources and Energy Economics. Actual capital productivity, shown by the blue lines, fluctuates around this trend reflecting endogenous substitution effects and lags between investment and production.
For this particular shock, modelling underlying capital productivity as a stochastic trend seems to be an over-simplification. The decline is arguably not random, but reflects essential features of the mining boom. In particular, the average quality of resources being exploited has declined as prices rise; and the sector has become more capital intensive due to compositional changes, specifically the rise of LNG and iron ore production. Arguably, this should be a permanent feature of the model. Pending such a re-specification, we assume underlying capital productivity in the counterfactual remains flat, as the surge in iron ore and LNG investment does not occur. Measured capital productivity still declines because of endogenous responses to relative prices and activity.

C.2 Adjustment to Capital Goods Imports
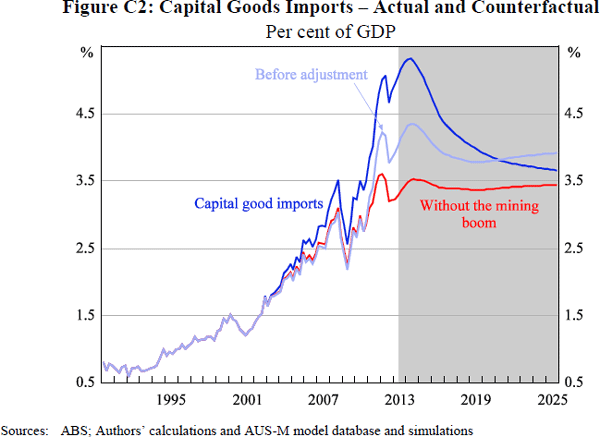
The mining boom has led to a surge in imports of equipment. However, the model's equation for equipment imports only explains part of this surge, with large positive residuals. A large part of this unusual increase seems attributable to compositional and technological changes. In particular, company-level information examined by Connolly and Orsmond (2011, p 40) indicates that an unusually high proportion of the construction investment in mining is imported, including floating platforms and LNG modules, and materials used in construction. Sheehan and Gregory (2012) similarly estimate that the import content of mining investment will rise to around 45 per cent by 2014/15 and thereafter decline.
On the assumption that the unexplained strength of capital goods imports is attributable to the mining boom, we remove the positive residuals from this equation in the counterfactual. The impact of this is shown in Figure C2. For consistency, we make a partly offsetting adjustment to construction output, which is jointly estimated. That is, with less demand for construction equipment being sourced overseas, more is sourced domestically. These adjustments subtract around ¾ of a per cent of GDP from capital goods imports by 2014/15, and add about ½ a per cent to domestically supplied construction.

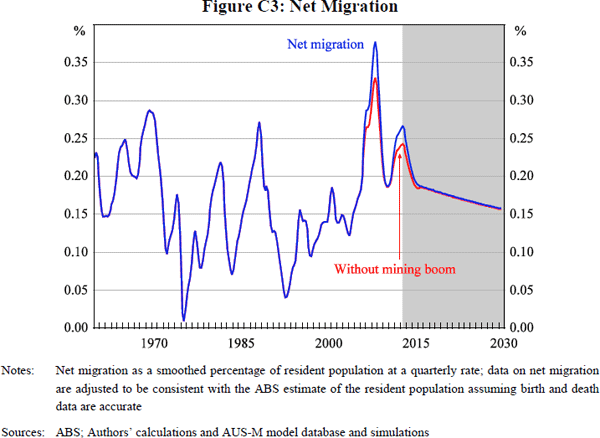
C.3 Net Migration
Our adjustment for net migration follows the same logic as the previous adjustments. The net migration data have been surprisingly strong and this is plausibly attributable to the mining boom. The mining industry directly increases immigration through demand for skilled workers and hence for 457 visa holders. Probably more important are the indirect effects via a high exchange rate and lower unemployment, which makes Australia a more attractive place to work relative to overseas. (In addition the official migration program has been procyclical in the past, and probably would have been more restrictive in a less buoyant environment.) So we reduce net migration in the counterfactual (Figure C3), which then feeds through to other demographic variables.
