RDP 2021-10: The Rise in Household Liquidity Appendix B: Cross-country Evidence on Liquidity Buffers
November 2021
- Download the Paper 1.71MB
To explore the cross-country determinants of household liquidity buffers we estimate a simple reduced-form regression model. The model is based on an unbalanced panel with 37 OECD countries and a sample covering the period from 1995 to 2019 (with more than 25 observations in each year):
where the dependent variable is the annual change in the ratio of household liquid assets to disposable income and the explanatory variables include the change in real interest rates, the change in the housing price-to-income ratio, the change in the mortgage debt-to-income ratio, population growth and consumer price inflation. The model is specified in changes to ensure stationarity (given a relatively long time series) and to remove any country fixed effects (that capture country-specific factors such as cultural and institutional differences that might explain the level of liquidity buffer). Liquid assets include currency and deposits, securities, shares and other equity. Long-term interest rates are based on government bonds maturing in ten years.
The regression estimates indicate that changes in liquidity buffers are correlated with both changes in housing prices and mortgage debt (relative to income)(Table B1). These results also suggest that countries with ageing populations are more likely to have higher buffers, which is consistent with older households holding more wealth in liquid assets). We also find that lower interest rates are associated with higher liquidity buffers, though the effect is economically small.
| Control for: | ||
|---|---|---|
| housing prices | mortgage debt | |
| Change in housing price-to-income ratio | 0.48*** (0.14) |
|
| Change in debt-to-income ratio | 0.46*** (0.12) |
|
| Change in inflation rate | −0.00 (0.00) |
−0.00 (0.00) |
| Change in real long-term interest rate | −0.00 (0.00) |
−0.00*** (0.00) |
| Population growth rate | 0.02 (0.62) |
0.07 (0.43) |
| Change in employment rate | −0.17** (0.06) |
−0.13* (0.07) |
| Change in share of population aged 65 and over | 0.61* (0.32) |
0.63** (0.27) |
| Constant | −0.01 (0.01) |
−0.00 (0.01) |
| R squared | 0.23 | 0.08 |
| Observations | 188 | 322 |
|
Notes: *, ** and *** denote statistical significance at the 10, 5 and 1 per cent levels, respectively; t-statistics in parentheses Sources: Authors' calculations; Jordà, Schularick and Taylor (2017); OECD |
||
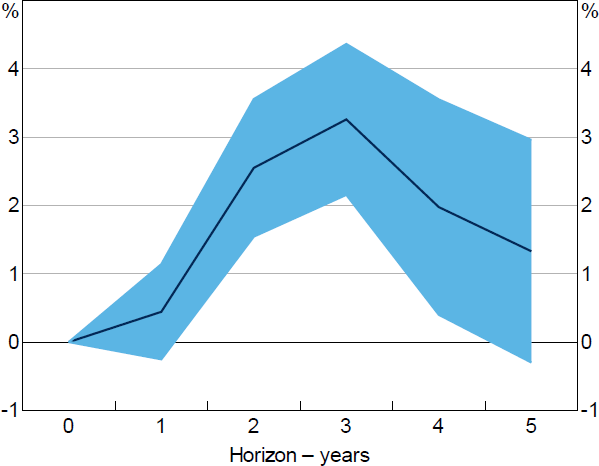
To more clearly explore the effect of changes in interest rates on buffers, we estimate IRFs using the LP method of (Jordà 2005):
Specifically, for each forecast horizon, h, we run a regression of the household liquidity buffer on the long-term interest rate, as well as controls for the lagged value of the buffer, the change in the housing price-to-income ratio, the share of population aged 65 and above, GDP growth and consumer price inflation.
The results suggest that a decrease in the long-term interest rate of 1 percentage point is associated with a 3 per cent increase in the household liquidity buffer over a two to four year horizon (Figure B1). This is slightly larger than the estimated effect of interest rates on buffers for Australia.

Note: Shaded area represents confidence interval based +/– 2 standard errors
Sources: Authors' calculations; Jordà, Schularick and Taylor (2017); OECD