Statement on Monetary Policy – May 2020 3. Domestic Economic Conditions
The outbreak of COVID-19 infections and the measures implemented to contain the spread of the virus have significantly affected the Australian economy. The economy will record a severe contraction in the June quarter, but is expected to start recovering as containment measures are progressively lifted (see discussion in the ‘Economic Outlook’ chapter).
Containment measures introduced by the Australian and state governments have limited the spread of the virus. But these measures, including travel restrictions and social distancing rules, coupled with individuals and businesses taking their own precautionary actions, have significantly reduced domestic activity since mid March. Relatedly, there has been a marked increase in economic uncertainty and a sharp decline in household and business confidence about the near-term prospects for the Australian economy. Notwithstanding this, the low levels of COVID-19 cases in recent weeks and the increase in the capacity of the Australian health system to respond to outbreaks should provide confidence that containment measures can be eased progressively over coming months.
Substantial support from fiscal and monetary policy is helping to offset declines in household and business incomes and maintain employment through the contraction period, which should in turn aid the recovery. Both Australian and state governments have introduced sizeable fiscal packages, which are now being implemented and will operate alongside other measures that are assisting households and businesses manage their debt and rent obligations. The Reserve Bank has eased monetary policy by lowering the cash rate and introducing a target for the 3-year Australian Government bond yield, which has lowered borrowing costs in the economy. The Bank has also introduced the Term Funding Facility (TFF), which provides an incentive to banks to lend to small- and medium-sized firms.
The domestic economy entered the outbreak period with growth improving gradually
Before the widespread outbreak of the coronavirus, the Australian economy had grown by 0.5 per cent in the December quarter and by 2.2 per cent over 2019 (Graph 3.1). The bushfires had only a limited impact on nationwide economic activity in the December quarter and, at the end of 2019, year-ended growth was ½ percentage point above its mid-2019 trough. Public consumption and exports had been the main sources of expenditure growth over 2019, while private demand had been weak.

| December quarter 2019 | September quarter 2019 | Year to December quarter 2019 | Share of GDP | |
|---|---|---|---|---|
| GDP | 0.5 | 0.6 | 2.2 | 100 |
| Domestic Final Demand | 0.1 | 0.4 | 1.3 | 97 |
| – Consumption | 0.4 | 0.1 | 1.2 | 55 |
| – Dwelling investment | −3.4 | −1.2 | −9.7 | 5 |
| – Mining investment | 5.0 | −4.8 | 3.2 | 3 |
| – Non-mining investment | −2.4 | −0.0 | −2.4 | 9 |
| – Public consumption | 0.7 | 1.1 | 5.3 | 19 |
| – Public investment | −1.3 | 4.4 | 2.5 | 5 |
| Change in inventories(a) | 0.2 | 0.2 | −0.1 | n/a |
| Exports | 0.0 | 0.5 | 3.4 | 25 |
| Imports | −0.5 | 0.3 | −1.5 | 21 |
| Mining activity(b) | 1.2 | 0.5 | 5.7 | 15 |
| Non-mining activity(b) | 0.4 | 0.6 | 1.7 | 85 |
| Farm GDP | 0.4 | −3.3 | −2.2 | 2 |
| Non-farm GDP | 0.5 | 0.6 | 2.3 | 98 |
| Nominal GDP | −0.3 | 1.2 | 4.1 | n/a |
| Terms of trade | −5.3 | 0.2 | −0.6 | n/a |
|
(a) Contribution to GDP growth
Sources: ABS; RBA |
||||
Most of the regular economic data for Australia pre-date the implementation of stricter containment measures. Higher-frequency products released by the ABS, along with additional information from other agencies, market sources and the Bank's liaison program have enabled more timely assessments of current economic conditions and have helped inform our view about the outlook for the Australian economy.
The earliest economic effects of the outbreak were from travel restrictions reducing travel and education exports
Restrictions on travel to contain the spread of the virus have been in place since February and have been progressively tightened. International border restrictions were introduced on 1 February for arrivals from China and, in early March, were broadened to cover arrivals from Iran, South Korea and Italy. On 20 March, Australia's borders were closed to all non-residents. These measures had the largest impact on the tourism and education sectors, leading to significantly lower service exports; service imports also declined as Australian residents deferred or cancelled travel overseas.
Travel restrictions resulted in a sharp reduction in visitors arriving in Australia to study, which was already evident by February (Graph 3.2). Consequently, there will be a large decline in education exports over the first half of the year. A significant share of Chinese students who had intended to study in Australia remained outside the country, and some students from other countries have withdrawn from their studies voluntarily or had their exchange programs suspended or cancelled. Domestic containment measures are also expected to decrease spending by international students remaining in Australia.

Domestic activity declined over recent months as containment measures were introduced …
As the number of cases of the virus in Australia increased in March, Australian and state governments imposed social distancing and other containment measures (Graph 3.3). People were encouraged to stay at home as much as possible, limit contact with people outside of their own household, and only venture out if they needed to. The restrictions included: limitations on movement across most state and territory borders; closure of a large number of businesses (such as indoor sporting facilities, entertainment activities, pubs, clubs and dining facilities); public social gatherings being restricted to two persons; and households being instructed to limit visitors. There was a shift to remote schooling across the country and a significant increase in working from home. At the time of publication, there had been a modest easing in some restrictions but most of these restrictions remain in place.

The containment measures substantially reduced the movement of people and vehicles and, in doing so, have been effective in slowing the spread of the virus. Foot traffic at public transport stops and stations across Australia fell by around 60 per cent over March, although movement around grocery stores and pharmacies did not decline as much (Graph 3.4). Foot traffic remained subdued through April. It appears that individuals and businesses voluntarily adjusted their behaviours to some extent ahead of more formal government restrictions. Similarly, high-frequency data for restaurants suggest that the number of seated diners also declined significantly in the week preceding the formal closure of in-house dining at cafes and restaurants on 23 March, while some parts of the retail sector saw a strong boost in sales in March as households prepared for containment (see below).

… leading to a large decline in employment
A range of sources confirm that the containment measures introduced from mid March led to an immediate and large rise in job losses and a significant reduction in the hours worked by many who retained their jobs. Weekly ABS payroll data showed that the number of paid employee jobs fell by 7½ per cent between 14 March and 18 April, though the pace of decline in jobs has eased since the JobKeeper Payment was announced (Graph 3.5).[1] The rate of job loss was largest for younger people and in industries most affected by government restrictions, such as accommodation & food services and arts & recreation. These payroll data, which are now published by the ABS with support from the Australian Taxation Office, complement the Labour Force Survey and greatly improve our ability to monitor the labour market.

Alongside the decline in employment, businesses have also made other changes to their workforce in response to the new restrictions and weaker demand. According to an ABS survey of around 1,200 businesses, around one-quarter of businesses that were still operating had reduced the hours of their staff in the final two weeks of March, while a smaller share of businesses had increased work hours over that period.
Household surveys tell a similar story of a deterioration in labour market conditions from late March. The Roy Morgan survey measures of unemployment and underemployment have risen sharply. Of the respondents in the Westpac–Melbourne Institute survey, 7 per cent had lost their jobs and 14 per cent had been stood down without pay over the month leading up to the 6–11 April survey period. Workers in hospitality, recreation and other household services were most adversely affected. A recent ABS survey of households showed that, of those who remained in a paid job, the share who had worked zero hours (an indicator of being stood down by their employer) rose from 3 per cent to 13 per cent over late March/early April, while others remained at work but had their hours reduced. The same households were re-interviewed a fortnight later, and stand-downs and reductions to working hours for these households had generally continued into the first half of April.
The Australian Government has introduced the JobKeeper Payment of $1,500 per fortnight, which was passed into legislation in early April. This wage subsidy will encourage firms to retain workers and provide a wage floor for eligible employees; it will increase wages in the near term for lower-paid workers and limit income declines for those who have had their hours reduced or been stood down. Around one-quarter of employees could receive a temporary increase to their earnings if they are covered by the program. The legislation also includes temporary changes to the Fair Work Act 2009 to give employers more flexibility to vary employees' working arrangements. As of 6 May, more than 760,000 businesses had enrolled in the program, estimated to cover around 5 million workers. In the most recent ABS survey of businesses, around 45 per cent of firms reported that the announcement of the JobKeeper Payment had influenced their decision to continue to employ staff, and 60 per cent of surveyed firms had registered for the scheme or were intending to do so.
The March labour force data did not show a discernible impact of the containment measures on the labour market because the survey of households references the period 1–14 March. The April Labour Force Survey, which references the period 29 March and 11 April, will provide a comprehensive assessment of labour market conditions after social distancing and other containment measures were introduced.
Forward-looking indicators of labour demand confirm that labour market conditions will remain very weak for the next few months (Graph 3.6). Job advertisements have fallen very sharply, while information from the liaison program and surveys show business hiring intentions over the period ahead are very weak.

Containment measures are affecting industries differently
While all industries are being affected by the containment measures, the extent varies widely. The household services sector, which has contributed the most to employment growth over recent years and has the largest share of casual workers, has been the most affected (Graph 3.7). Under the ban on public gatherings, activity in some parts of the arts & recreation industry has effectively stopped. Activity in the accommodation & food services industry has also been significantly curtailed because of the ban on international and (in some states) domestic travel, and the bans on public gatherings; an increase in takeaway and online ordering and delivery options has not been sufficient to offset this. The ABS payroll data suggest that around 1 in 3 jobs in accommodation & food services and more than 1 in 4 jobs in the arts & recreation industry have been lost (or stood down without pay) since mid March (Graph 3.8). In combination, these industries account for around one-fifth of casual workers. Around one quarter of employees in these industries are casuals and have been in their jobs for less than 12 months and therefore would not be eligible to receive the JobKeeper Payment.


In contrast, there has been much less of a decline in employment in the health care & social assistance industry (which accounts for around 14 per cent of workers). Employment in the industry has been supported by increased anticipated demand for hospital care and the increase in government spending on health services; this increase in demand for health care workers is likely to persist for some time. Employment in child care will be supported by the government's decision to make child care services free until 28 June 2020. However, there has been a slowing in activity in some other parts of the healthcare industry as a result of a decline in household demand and the various containment measures, which included a temporary halt to elective treatments and restrictions on services provided by dentists and allied health professionals. The partial lifting of restrictions for some of these services from 25 April will enable some activity to pick up again, as will the increased prevalence of telehealth as a way of delivering some of these services.
Higher education providers expect large falls in revenue in 2020 because of lower international student enrolments. Information from liaison suggests that this has negatively affected planned capital spending and hiring intentions. The Higher Education Relief Package announced on 12 April guarantees $18 billion in funding in 2020 for all higher education providers currently allocated Commonwealth-supported places, regardless of actual enrolments, and also provides regulatory relief and subsidies for some short courses. Elsewhere in the education industry, many primary and secondary education employees have been able to work and teach remotely; some schools are already in the process of returning to on-campus learning, or will do so in coming weeks. To date, there has been little decline in overall employment in the education industry.
Employment in the manufacturing and construction industries appears to have been less directly affected by containment measures because most businesses in these industries have not been required to close. However, the economic slowdown has still had large indirect effects on many employers in these industries. Recent survey measures of conditions in these industries have declined very sharply, and firms have reported large declines in demand. While the existing pipeline of construction projects has supported construction employment to date, this pipeline is expected to decrease as some future projects are delayed. On the other hand, some parts of the manufacturing sector have experienced significant increases in demand, such as producers of food & beverages, pharmaceuticals, essential household goods (such as personal health and hygiene products) and personal protective equipment. Employment in the mining sector has been less affected by containment measures than some other industries, and has been supported by the relative resilience of resource exports.
The payroll data suggest that the number of paid jobs in retail has been less adversely affected than jobs in some other industries. Although there have been widespread reports of retailers that have stood down or made employees redundant, other retailers have increased their hiring substantially. The increase in demand for some retailers and retailers increasing the range of products available for online purchasing is likely to have supported employment in retail, as well as employment in the wholesale and transport sectors.
Although employees in the business services sector have more capacity to work from home, payroll data suggest that there has been a 5½ per cent reduction in paid jobs in the professional, scientific & technical industry, reflecting some decline in demand. Liaison suggests that demand for labour hire and recruitment services has declined significantly as firms put recruitment on hold and reduce their use of casual workers, while engineering and architecture firms have reported growing concerns around the future pipeline of work as projects are being deferred. Productivity is also likely to be lower as business service firms and their employees adapt to new working arrangements.
The pattern of retail spending has shifted markedly since February
Retail sales volumes grew by 0.7 per cent in the March quarter and by 1.1 per cent over the year. Following relatively weak growth in January and February, retail sales values increased by 8½ per cent in March, the largest increase in the history of the series and similar in size to the increase recorded just prior to the introduction of the goods and services tax. The increase in retail sales values in March was driven by widespread precautionary and preparatory purchases at supermarkets & other grocery stores, liquor retailers and pharmacies (Graph 3.9). Purchases of home entertainment and other recreational items, and items related to setting up home offices were also strong in the month. By contrast, sales at cafes & restaurants and sales of clothing and footwear fell, consistent with the introduction of social distancing restrictions in mid March. Liaison with retailers suggests that there were further declines in April. Motor vehicle sales fell sharply in April, to be close to their lowest level in 20 years (Graph 3.10).


In April, measures of consumer sentiment fell to their lowest levels since the 1990s recession (Graph 3.11). Sentiment about economic conditions and personal finances fell significantly, consistent with reported job losses and increased uncertainty about the outlook. Weekly measures of sentiment reversed some of their declines following the announcements of the fiscal and monetary measures to support activity. An alternative measure of sentiment based on text analysis of newspaper articles also fell to a record low in March, then improved a little in April (Graph 3.12). As with other sentiment indicators, news sentiment is a timely indicator and is correlated with other key economic variables, such as GDP growth and the unemployment rate.


Government policies are supporting household incomes
Government policies will help to offset the effect of the COVID-19 outbreak on household income, for example, through the JobKeeper Payment and the Coronavirus Supplement that is available to most recipients of income support payments, including JobSeeker. Information from the recent household survey conducted by the ABS indicates that around half of households who had received the Economic Support Payment of $750 had saved most of the payment, while some others had used the payment to pay household bills. Other measures will also provide relief to households by easing pressures around rent and debt obligations and by allowing early access to superannuation. The temporary deferral of mortgage repayments by some households and the decline in interest rates are also expected to provide a small boost to household cash flow. Household income is still expected to decline in the March and June quarters mainly because of expected falls in labour and in unincorporated business income.
Established housing market conditions have softened since mid March …
Housing price growth moderated further in April in Sydney and Brisbane and prices were flat in Melbourne and Perth (Table 3.2). Survey information suggests expectations for housing price growth over the next year have fallen sharply, with over half of respondents now expecting prices to decline, compared with around 10 per cent over the first three months of the year (Graph 3.13).
| April | March | February | January | Year-ended | Past five years | |
|---|---|---|---|---|---|---|
| Sydney | 0.6 | 1.0 | 1.7 | 1.4 | 14.3 | 22 |
| Melbourne | 0.0 | 0.3 | 1.3 | 1.4 | 12.4 | 29 |
| Brisbane | 0.4 | 0.6 | 0.6 | 0.5 | 3.8 | 10 |
| Adelaide | 0.3 | 0.4 | 0.2 | 0.3 | 1.5 | 11 |
| Perth | 0.0 | 0.2 | 0.3 | 0.2 | −2.5 | −18 |
| Darwin | 1.3 | 1.4 | −1.0 | 0.1 | −2.7 | −28 |
| Canberra | −0.2 | 0.7 | 0.6 | 0.5 | 4.3 | 22 |
| Hobart | −0.1 | −0.5 | 0.7 | 0.7 | 5.0 | 44 |
| Capital cities | 0.2 | 0.5 | 1.1 | 1.1 | 9.7 | 17 |
| Regions | 0.5 | 0.5 | 0.5 | 0.5 | 3.2 | 13 |
| Australia | 0.3 | 0.5 | 1.0 | 1.0 | 8.3 | 16 |
|
(a) Seasonally adjusted by the RBA Sources: CoreLogic; RBA |
||||||

Following the ban on public (in-person) auctions and open houses in late March, timely indicators such as new listings and auction volumes declined sharply in April (Graph 3.14). Auction clearance rates in Sydney and Melbourne declined alongside a sharp increase in auction withdrawal rates (Graph 3.15). Constraints around open houses are expected to be partially unwound in the near term and this should provide some support to activity in housing markets; however, the economic downturn, uncertainty and social distancing are expected to continue to weigh on transaction volumes in coming months.


Information from liaison suggests that rental market conditions have deteriorated markedly since mid March. Rental listings have increased, partly because properties previously offered on the short-term accommodation market are now being offered on the longer-term rental market.
A number of state and territory governments have announced tax relief for landlords and rental support in cases where tenants are facing financial stress. These are in addition to the previously announced six-month moratorium on evictions for both residential and commercial tenants. These policy measures should help reduce the number of tenancy agreements that are terminated over coming months. Liaison suggests that the number of existing residential leases that have been subject to rent discounts or deferrals increased in April; to date the declines in rents are relatively modest, but are expected to have a sizeable impact on overall rents if they continue. Increased supply alongside weaker demand, partly because of fewer foreign students and long-staying foreign visitors, are also likely to have put upward pressure on the vacancy rate in April, putting further downward pressure on rents.
… which is likely to prolong the downturn in dwelling investment
Residential building approvals decreased in March. Information from liaison about the earlier stages in the development process suggests demand for new dwellings has deteriorated significantly (Graph 3.16). Residential construction firms in the AIG Performance of Construction Index indicated that new business had declined sharply over recent months. Greenfield lot sales declined a little in Sydney in the March quarter and remained flat in Melbourne; cancellation rates had also edged up in these cities. Nationally, lot sales increased a little in the March quarter, but remained relatively low and are expected to decline over the year ahead. These indicators suggest continued weakness in dwelling investment in the near term. Liaison contacts have also cited concerns about increased settlement failures. There is also the risk that COVID-19 cases could occur at construction sites and lead to temporary site closures.

Business sentiment has sharply deteriorated, as has the outlook for non-mining business investment
Survey measures of business conditions have fallen sharply since mid March as a result of the COVID-19 outbreak (Graph 3.17). The fall in reported conditions has been broad based across most states and industries. According to recent ABS surveys of businesses, the most commonly cited expected impacts of the virus were reduced cash flow and reduced local demand (Graph 3.18).


Surveyed business confidence is at its lowest level since the series began in the late 1980s; historically, periods of low business confidence and profit growth have coincided with weak non-mining investment (Graph 3.19). Information from the Bank's liaison program also indicates that many firms are deferring or cancelling non-essential planned capital expenditure in response to the deterioration in the Australian economic environment. In February and early March, delays were reported for some building materials and machinery & equipment being imported from China, following the restrictions put in place there in response to the initial outbreak of COVID-19. More recent indications from liaison suggest the earlier concerns about supply disruptions to imported goods are receding, both because Chinese economic activity has picked up and domestic demand has weakened.

The near-term investment outlook for non-mining firms is particularly weak for machinery & equipment expenditure, which is relatively more sensitive to near-term economic conditions. An indication of this is the sharp drop in car sales to businesses in April. In contrast, construction activity on existing infrastructure and non-residential building projects appears to have been relatively unaffected to date, although increased uncertainty regarding the economic outlook is likely to slow the planning for, and commencement of, future private projects.
Mining activity has been fairly resilient
The outbreak of COVID-19 has had a relatively limited impact on mining activity to date. Liaison information, company announcements and partial trade data suggest that resource export volumes have been largely unaffected. As well, iron ore exports look to have recovered from earlier cyclone-related disruptions. Chinese demand for imported bulk commodities has mostly remained strong despite the outbreak of COVID-19, in part because of disruptions to Chinese domestic mining production. Reports also indicate that Chinese buyers have sought to rebuild their inventories of bulk commodities in anticipation of further stimulus measures from the Chinese Government, which could support steel-intensive construction activity. In Australia, work on major iron ore and coal investment projects is expected to continue, given most of these projects are required to sustain current production levels.
Although low oil prices will reduce the revenues of liquefied natural gas (LNG) producers, LNG export volumes are unlikely to decline materially; over 80 per cent of Australian LNG exports are produced under long-term supply contracts, and there are also significant costs to producers of stopping and restarting production. However, the outlook for LNG investment has deteriorated, and final investment decisions have been delayed on some large LNG projects that had been expected to commence construction during 2020.
Interstate travel restrictions could in principle limit the availability of specialised labour and disrupt mining activity in the near term. To date, however, liaison information and company announcements suggest that these restrictions have not significantly affected the availability of specialised labour, and some producers have adjusted accommodation and transport arrangements, including by relocating workers, to reduce the risk of disruption.
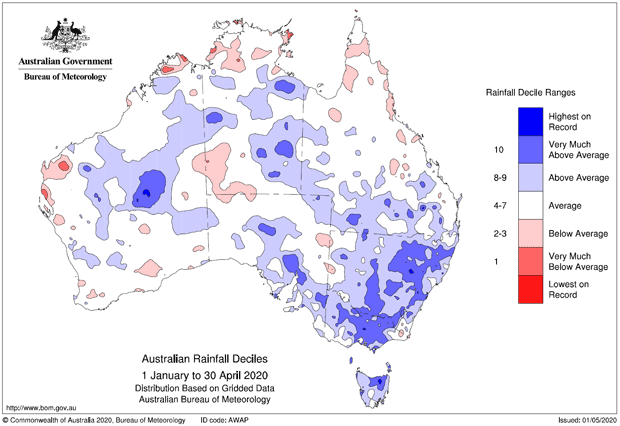
Drought conditions have been easing
Since the start of the year, rainfall was average or above-average across most of Australia, including in important agricultural regions such as the Murray–Darling Basin (Figure 3.1). This has improved soil moisture and provided a favourable start to the winter cropping season. The Bureau of Meteorology indicates that wetter-than-average conditions are likely to continue until at least August. Consistent with this improvement in conditions, the Australian Bureau of Agricultural and Resource Economics and Sciences forecasts that farm production will increase by around 4 per cent in 2020/21; an increase in crop production is expected to offset a decline in livestock-related production as farmers rebuild their herds and flocks. This more favourable outlook is reflected in a sharp increase in the share of farmers who expect better conditions over the next year (Graph 3.20).
Note: This figure is licenced under the Creative Commons Attribution Australia Licence <https://creativecommons.org/licenses/by/3.0/au/legalcode>

Policy measures will support household and business incomes
Australian and state governments have announced a range of measures to support the economy. These policies should facilitate labour market adjustment, reduce the financial stress of households and businesses and provide a safety net for households, helping them maintain spending on essential items and meet other obligations. However, it is unlikely these policies will boost spending by much in the near term while restrictions on activity are in place to contain the spread of the virus. In addition, in March, the Reserve Bank implemented a comprehensive package of policy measures to support the Australian economy, which is discussed in the ‘Domestic Financial Markets’ chapter.
The Australian Government has announced three packages of policies focused on providing support to households and business. When announced, the cost to the budget of these packages was estimated to be $66 billion in 2019/20 (3.3 per cent of annual GDP) and $126 billion in 2020/21 (6.3 per cent of annual GDP) (Graph 3.21). The states and territories have also announced a number of spending packages, costed to be at least $19 billion, just under 1 per cent of annual GDP. These state measures have been predominantly targeted at small- and medium-sized businesses in the form of waivers on payroll tax and government fees and charges. Many states have also included measures to support households and specific industries.

For individuals, the Economic Support Payments and the Coronavirus Supplement will boost income in the near term and assist many households with smoothing their consumption. The expanded eligibility of existing programs should ensure that newly unemployed or unwell households are able to access these payments quickly. This will reduce the likelihood such households will default on mortgage payments or have to sell housing or financial assets under financial stress, possibly at a loss, which would have flow-on implications for asset markets. The JobKeeper Payment will also help offset losses to incomes and maintain attachment to workplaces, which should support the recovery in activity and incomes. Wage subsidies for apprentices and trainees are intended to have a similar effect. Agreements to defer rent and loan payments will also help lower the risk of financial stress for many households and, through this, support their other consumption; however, it could result in lower income for owners of rental properties and some of these owners could come under financial pressure.
For businesses, similar permitted delays in rent and loan payments, along with the JobKeeper Payment should help them to manage their fixed costs over coming months. Relief from many state taxes, fees and charges, combined with low-cost debt programs in a range of forms and financial assistance to specific industries, are expected to reduce the number of business failures. The three-year commitment to the Term Funding Facility (TFF) established by the RBA should support business credit.
Spending to support mental health and social support services is also providing essential assistance for households and businesses through this difficult time.
The amount of debt outstanding by federal and state governments will increase significantly because of increased spending related to the stimulus measures and health expenditure, increased unemployment benefits and lower revenues. That said, net government debt outstanding is low in Australia relative to other advanced economies. Federal government revenues will be lower because of lower taxes being paid by households and businesses, while state government revenues will be affected by lower stamp duty because of lower turnover in housing markets and the waiver of payroll and land taxes. Lower GST revenues will affect both federal and state governments.
Endnotes
In this release, a job is only classified as a ‘job’ if it is being paid; as such, the net job losses over the period include employees who had been stood down without pay, but would not include those stood down with pay. For example, those on JobKeeper or paid leave. [1]