RDP 2015-10: The Life of Australian Banknotes 6. Survival Modelling
August 2015 – ISSN 1448-5109 (Online)
- Download the Paper 1.22MB
In order to address some of the limitations of the steady-state and Feige methods, I estimate survival models for banknote life, which can be used to derive the survival, hazard and destruction functions. The models provide estimates of many features of banknote survival, including the rates at which banknotes are likely to become unfit and measures of central tendency for banknote life spans. Accessible introductions to survival analysis are available in Jenkins (2008) and Wooldridge (2010).
Since there are no data recording the dates of issuance and destruction for samples of Australian banknotes, I utilise the data on aggregate issuance and destructions to estimate survival models. Importantly, the models can include explanatory variables that control for events such as demand shocks and changes to a currency issuer's policies.
6.1 Model Specification
The survival function can be estimated by using the relationship between the actual and expected number of fit banknotes. It is important to note that fit banknotes include all banknotes on issue as well as surplus fit banknotes held by the currency issuer.[10] The actual number of fit banknotes is assumed to be equal to the total number of banknotes ever issued minus the total number of banknotes that have been destroyed up to that point in time.[11]
where Ft is the total number of fit banknotes at time t, It is the number of new banknotes issued at time t, and Dt is the number of destructions at time t.
The expected number of fit banknotes at a particular point in time is equal to the sum of each new issuance since banknote production began, multiplied by each issuance's survival function – that is the fraction of banknotes from each issuance date that are still likely to be fit for purpose at time t. The expected number of fit banknotes, based on the aggregate data, is given by:
where S( ) is the survival function, τt equals the amount of time since the first issuance of banknotes issued at t, and α equals a vector of parameters for survival function S.
Treating the difference between Ft and E(Ft) as a nonlinear regression residual, we can use nonlinear least squares to estimate the parameter vector α that governs the shape of the survival function, as shown in Equation (10). In other words, the actual number of fit banknotes from Equation (8) should be approximately equal to the expected number of banknotes from Equation (9). Differences between the two measures of fit banknotes may arise due to factors that cannot be included in the survival model, including changes in the public's treatment of banknotes, preferences for different payment instruments, or changes in the policies of the commercial cash sector.
where εt is an error term.
I investigated a range of different specifications for the survival function in Equation (10). I found that results based on Weibull survival distributions, which have two parameters that determine the scale (λ) and shape (k) of the distribution, were the most plausible. This distribution is commonly used in the survival analysis literature and is flexible in that the estimated hazard function can be monotonically increasing (when λ is greater than one), monotonically decreasing (when λ is less than one) or a constant (when λ equals one). Log-logistic specifications were also examined since they allow the hazard function to vary non-monotonically, but this property did not seem to be empirically important.
The specification in Equation (10) can also be extended in two ways. First, the discussion in Section 2.4 indicated that it may be important to take into account the potential for unobserved heterogeneity in the use of banknotes. Rather than assuming that all banknotes will eventually become unfit, we can split the population of banknotes into two groups: banknotes that become worn and are eventually returned for destruction; and banknotes that will not be returned within the life of the banknote series, which could include banknotes that are held for precautionary or numismatic purposes. The probability that a banknote returns for destruction (p) can be incorporated in the models as an extra parameter to be estimated.
Second, explanatory variables can be introduced to take into account factors that impact the issuance, durability and destruction of banknotes to help address some of the shortcomings of the two steady-state methods. These variables can be included such that they interact with the hazard function multiplicatively, in a similar way to the proportional hazards models that are common in the survival analysis literature. The specific variables included in the survival models vary across denominations (Table 7). Dummy variables are included to control for the RBA's quality programs which targeted the $5, $10 and $20 denominations. The change to the distribution arrangements in 2001, which involved the privatisation of some banknote holdings, are more relevant to the higher value $20 and $50 denominations, as are the shocks to demand.
| Variable | Description |
|---|---|
| NNS transition | A dummy variable is included for each denomination to recognise that the hazards faced by banknotes may be different soon after their first issuance. For example, it was more common for polymer banknotes to be returned for destruction with deliberate scratches or other damage when they were first released. For the $5, $20 and $50 denomination the dummy variable equals one for around the first 2 years of issuance. The dummy variable equals one for a longer period of 3.5 years for the $10, since some minor changes were made to the inks used over that time. |
| Recoloured $5 | The colours of the first $5 polymer banknotes released in 1992 were considered too pale and a brighter coloured version has been issued since 1995. Since destructions and issuances may have been affected by the new release, a dummy variable is included and equals one for the period May to December 1995. |
| Federation $5 | A commemorative $5 banknote celebrating the Centenary of Federation was issued in 2001 and withdrawn the next year. A dummy variable is included, which equals one from January 2001 to September 2002. |
| Y2K | A dummy variable that equals one for the period August 1999 to July 2000 to control for the possibility that the public increased their precautionary demand for $20 and $50 banknotes around the time of Y2K. |
| GFC | A dummy variable that controls for the potential increase in precautionary demand for $20 and $50 banknotes during the GFC and equals one between October 2008 and August 2009. |
| Distribution policy | The change to cash management practises in 2001 involved the transfer of precautionary holdings from the RBA to the commercial banks. Unlike banknotes on issue, the definition of fit banknotes would not be affected by this change; however, it is also likely that the commercial banks would have adjusted their practices and demand for banknotes in response to the policy change. A dummy variable that equals one from November 2001 to April 2002 captures the impact of the policy change. |
| Quality programs | Dummy variables are included to capture the targeted cleansing programs that were implemented for the $5 banknotes in 2011, $10 banknotes in 2005 and 2009 to 2010, and for the $20 denomination in 2006 and 2007. |
| GDP growth | Nominal GDP growth is calculated quarterly on a year-ended basis; year-ended GDP growth in each month of a quarter is assumed to be equal to that of the whole quarter. |
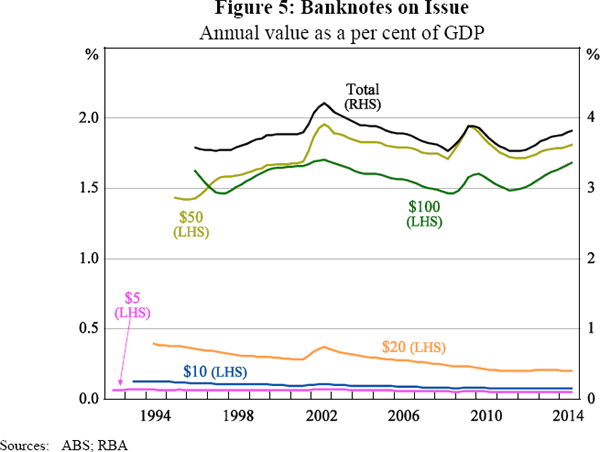
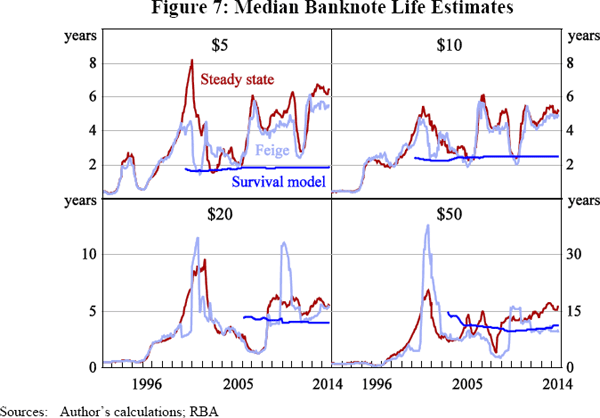
The usage of different denominations in automated teller machines (ATMs) over time could also be suggested as a sensible variable to include in the models, as it could capture shifts in the public's treatment of different denominations. The number or proportion of different denominations used in ATMs, however, is not known. Since changes to the denominations used in ATMs were not coordinated across institutions, it would also be difficult to construct accurate dummy variables. Observing the yearly issuance patterns after the distribution of polymer banknotes (from 1992 for the $5 to 1996 for the $100), it is reassuring to note that there does not appear to be any sudden structural shifts in the composition of banknotes on issue (Figure 5). It is evident that there are some gradual trends in the composition of banknotes on issue over time (such as an increasing prominence of $50 banknotes and a decline in the share of $20 banknotes). These trends would be important if they are associated with a shift in the public's treatment of banknotes; however, given the stability of the survival model's estimates over time this does not seem to be a concern (Figure 7).
Another factor that would be expected to impact the life span of banknotes is the velocity of money in the economy over time, or in other words, the number of times a banknote is used in transactions each month over its life. Since there are no direct measures of the velocity of banknotes, year-on-year growth in nominal GDP is included in the models as an unsophisticated proxy since it is possible that increases in velocity are associated with increases in economic activity. This variable, however, could also capture other factors such as changes in the price level or changes in the public's preferences for banknotes.
With these modifications, the final specification of the Weibull survival model is given by:
where p is the probability of a banknote being returned for destruction[12] and x'β equals a matrix of explanatory variables and their vector of coefficients.
Notice that in this specification, for any group of banknotes issued, there is a constant (1– p) mass of banknotes that in effect last for ever, and a constant mass, p, that are assumed to become unfit. Derivations of the associated hazard function, destruction function and measures of central tendency are found in Appendix B.
6.2 Survival Model Results
Estimates of the survival models are shown in Table 8. The value of p in the $50 model implies that at least 30 per cent of $50 banknotes will not become unfit. In comparison, the proportion of banknotes that will not become unfit is between 10 and 15 per cent for the lower-value denominations. The result that p is noticeably lower for the $5 compared to the $10 may not seem intuitive but there are a number of reasons that this may be the case. It is plausible that since the $5 is the lowest value denomination it is less likely to be looked after by the public and more likely to be lost or destroyed in circulation. It is also possible that more $5 banknotes are held for numismatic purposes since it was the first NNS denomination released, and since recoloured $5 and Federation $5 banknote designs were issued. To give a sense of scale – in the first year of the NNS series more than 80 million $5 banknotes were issued, around 35 million recoloured $5 were issued in their first year, and 70 million Federation $5 banknotes were issued over 2001 – only an extra 5 per cent of these $5 banknotes (or around 0.4 banknotes per capita) would have had to be held by the public to make up for the difference between the models' estimates of p for the $5 and $10.
| Variable | $5 | $10 | $20 | $50 |
|---|---|---|---|---|
| p | 0.83*** | 0.88*** | 0.84*** | 0.70*** |
| λ | 26.19*** | 37.09*** | 55.71*** | 108.99*** |
| k | 0.70†† | 0.93 | 0.71††† | 0.97 |
| NNS transition | −1.49*** | −0.30*** | −0.27*** | 0.22 |
| Recoloured $5 | 0.04 | |||
| Federation $5 | −0.34*** | |||
| Y2K | −0.02 | −0.05 | ||
| GFC | −0.05*** | 0.14*** | ||
| Distribution policy | −0.25*** | −0.24*** | ||
| Quality program | 0.01 | 0.15*** | 0.14*** | |
| Quality program 2 | 0.14*** | 1.52*** | ||
| GDP growth | 0.89*** | 0.86*** | 0.33 | 1.45*** |
| Adjusted R2 | 0.996 | 0.999 | 0.998 | 0.999 |
| Notes: ***, ** and * indicate significance from zero at the 10, 5 and 1 per cent level, respectively; †††, †† and † indicate significance from one at the 10, 5 and 1 per cent level, respectively; the model is estimated with Newy-West standard errors; at first glance the adjusted R2 seems remarkably high, however, it should be recalled that the left side of the equation is the number of fit banknotes, which should be very similar to the expected number of fit banknotes on the right-hand side | ||||
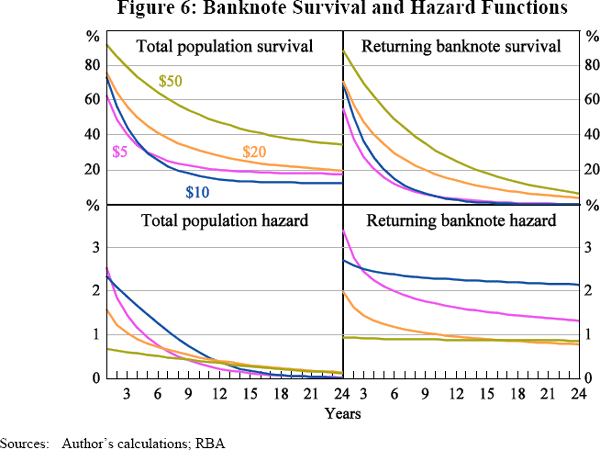
The aggregate hazard functions for all denominations are monotonically decreasing since the shape parameter, k, is less than one. k is not significantly different from one for the $10 and $50, which implies that returning banknotes of these denominations may experience a constant hazard. On the other hand, the hazard functions for the $5 and $20 denominations are monotonically decreasing suggesting that, particularly for these denominations, there may be further heterogeneity that remains unexplained or other factors not captured by the current model. Overall though, the split population does appear to be able to at least partly explain the decreasing hazard functions, since models estimated without a split population have hazard functions that slope downwards more strongly (i.e. have smaller estimated values of k).[13] The results also suggest that inkwear is not the dominant factor determining the shape of the observed hazard functions since they are not upward sloping.
Examining the coefficients of the explanatory variables, the reduction in survival during the GFC suggests that $50 banknotes were not only held in greater numbers but were also used and handled more frequently. The economic significance of the GFC variable is not particularly large – a $50 banknote first issued during the GFC would be 1.2 per cent less likely to survive its first year of circulation than if the GFC had not occurred. On the other hand, Y2K did not have a statistically significant impact on the life span of $20 or $50 banknotes. As expected, the quality programs (which are associated with elevated banknote destruction rates) reduce the survival of banknotes during the period and are statistically significant for the $10 and $20 denominations. The GDP growth parameter is positive and significant across all denominations except the $20 (for which it is not statistically different from zero), indicating the intensity of cash usage increases with economic activity. Despite its statistical significance, however, the economic implication of this variable is small – for example, a newly issued $50 banknote would be 0.1 per cent less likely survive its first year in circulation if year-ended GDP growth was 4 rather than 3 per cent.
The coefficients of the models can be used to construct the survival and hazard functions for both the population of banknotes and for the sub-population of banknotes that will be returned as unfit (Figure 6).[14] For both the population and the returning banknotes, the $50 banknotes have a higher survival rate compared to the other denominations and the $20 banknotes' survival rate exceeds that of the lowest two denominations in all time periods. Looking at the sub-population of returning banknotes, it appears that the $10 banknotes survive longer than the $5 banknotes; however, for the total populations, a higher proportion of $5 banknotes survive in the long run due to their lower propensity to be returned for destruction. The hazard functions for the total populations of each banknote denomination are downward sloping and, as previously discussed, the hazard functions for the returning sub-populations of banknotes are close to constant for the $10 and $50, but still somewhat downward sloping for the $5 and $20.
6.3 Banknote Life Estimates
The survival models estimate that the median life span of the population of banknotes ranges between around 2 years for the $5 and almost 11 years for the $50 (Table 9). The median life for returning banknotes predicted by the survival model is, as expected, lower than for the total population. The confidence intervals predicted by the survival model fall in a tight range around the point estimates.
| Denomination | Steady state | Feige | Survival models | |
|---|---|---|---|---|
| Population | Returning only | |||
| $5 | 3.5 | 3.0 | 1.9 ±0.3 | 1.2 ±0.3 |
| $10 | 3.5 | 3.2 | 2.5 ±0.2 | 2.0 ±0.2 |
| $20 | 4.1 | 3.9 | 4.0 ±0.3 | 2.7 ±0.3 |
| $50 | 10.0 | 8.9 | 10.7 ±0.3 | 5.9 ±0.9 |
|
Sources: Author's calculations; RBA |
||||
Looking more closely at the measures of central tendency across the different methodologies also provides some interesting insights (Table 9). The median banknote life estimates for all banknotes are most similar for the $50 denomination, whereas the estimates for the $5 are noticeably lower under the survival modelling framework. Across all of the models and measures, though, we observe the same pattern of longer life estimates as the denomination value increases. The differential between the useful life of the highest- and lowest-value denominations, however, is higher under the survival model's estimates compared to the two steady-state methods.
The survival models can also be estimated recursively to show how the estimated median life evolves over time, that is, by estimating the models with the same starting date but incrementally varying the end date of the samples (Figure 7). Comparing the recursive survival function estimates with the one-year-at-a-time steady-state estimates from Sections 3 and 4, we see that the survival models' median life estimates for the banknote population are far more stable than the results of the steady-state methods. This should make the survival model estimates more useful for long-term decision-making, where the currency issuer needs to abstract from the fluctuations in banknote life estimates caused by one-off events. Their disadvantage relative to the steady-state methods is that the survival models require a longer time series before estimates can be produced. Interestingly, in abstracting from economic growth, demand shocks and currency issuer policies, the survival models' estimates for the $20 and $50 cut through the life predicted by the two steady-state methods, whereas the survival model's estimates for the $5 and $10 are at the lower bound of the steady-state results. If the survival model results are closer to the ‘true’ life span of the banknotes, this would suggest that the steady-state formulas have been overestimating the longevity of the $5 and $10 banknotes but are not consistently biased for the $20 and $50 denominations.
Footnotes
Surplus fit banknotes are those that have previously circulated but are surplus to public demand. [10]
This assumption is reasonable if the majority of banknotes that become unfit are returned for destruction. Otherwise, if a large proportion of banknotes are lost or destroyed while in circulation the number of fit banknotes will be overstated. [11]
Technically, p is estimated using a logistic function so that its value is restricted to be between zero and one. [12]
See Appendix C for alternate specifications of the model without split populations. [13]
A policymaker may, in some cases, be more interested in only the survival characteristics of banknotes that will be returned for destruction for instance, when making decisions on the production volumes required for replacement. [14]