Productivity
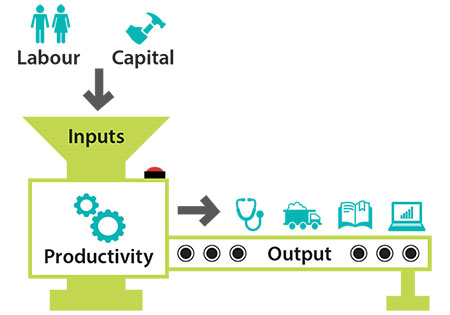
Download the complete Explainer 154KBIn economics, productivity refers to how much output can be produced with a given set of inputs. Productivity increases when more output is produced with the same amount of inputs or when the same amount of output is produced with less inputs.
There are two widely used productivity concepts.
- Labour productivity is defined as output per worker or per hour worked. Factors that can affect labour productivity include workers' skills, technological change, management practices and changes in other inputs (such as capital).
- Multifactor productivity (MFP) is defined as output per unit of combined inputs. Combined inputs typically include labour and capital, but can be expanded to include energy, materials and services. Changes in MFP reflect changes in output that cannot be explained by changes in inputs.
This Explainer outlines how productivity is measured, what drives productivity growth and how productivity growth contributes to the economic prosperity and welfare of all Australians.
How is productivity measured?
In Australia, the Australian Bureau of Statistics (ABS) produces measures of output and inputs for different industries, sectors and the economy as a whole. Productivity is not measured directly but is calculated by dividing a measure of output by a measure of inputs.
Output
Output refers to a quantity of goods and services produced in a given time period. Output for an industry or sector is usually measured by gross value added (GVA), which is the total value of goods and services produced less those goods and services used in the production process (known as intermediate consumption). Output for the whole economy can be calculated by summing GVA across industries. Alternatively, adding the value of taxes to GVA and subtracting the value of subsidies on products gives gross domestic product (GDP) (see Explainer: Economic Growth).
Inputs
Labour and capital are the two main types of inputs.
- Labour input can be measured as either the number of employed persons or the number of paid hours worked by employees. Hours worked measures are typically preferred because they capture changes in standard working hours, leave, overtime and flexible work arrangements. The ABS also reports hours worked that have been adjusted for ‘quality’, meaning that they take into account changes in the level of education and experience of the labour force.
Box: Calculating Labour Productivity – An Example
Labour productivity is defined as output produced per unit of labour input.
Suppose a person is employed for 40 hours a week in a toy factory. In a given week, the worker produces 120 dolls. The productivity of the worker in that week is 3 dolls per hour.
Suppose the factory produces a range of toys, including dolls, miniature cars, card games and board games. In a given week, the gross value added of these goods is $5 million, using 125,000 hours of labour. Labour productivity for the toy factory in that week is $40 per hour.
Box: Calculating Multifactor Productivity (MFP) – An Example
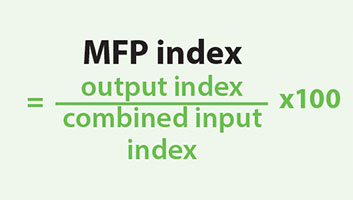
Most businesses produce output using a combination of labour and capital inputs. MFP is calculated as a measure of output divided by a measure of combined inputs. Both the denominator and numerator are usually represented by indexes, which is a useful way of comparing changes in economic time series relative to a base period. The value of the index in the base period is usually set to equal 100.
Because of the use of indexes, MFP is usually analysed in terms of growth rates rather than levels.
Suppose that a factory uses a combination of labour and capital to produce dolls, board games and other toys. Suppose that year 1 is the base year when an output index and a combined input index for the toy factory are both set equal to 100. In year 2, the output index increases to 107 while the combined input index increases to 105. The MFP index for the toy factory in year 1 is 100 and the MFP index in year 2 is 101.9.
 |
 |
 |
|
|---|---|---|---|
| Year 1 | 100 | 100 | 100 |
| Year 2 | 107 | 105 | 101.9 |
The growth in MFP between year 1 and year 2 is 1.9 per cent.
- Capital input is a measure of capital services (a flow). It describes the benefits obtained from the productive assets held by a business, an industry or an economy (a stock). These assets can include physical capital, like equipment, machines, structures and vehicles, as well as intangible capital such as intellectual property. The value of the stock of productive assets is adjusted to account for their declining usefulness over time.
MFP uses a measure of combined labour and capital inputs, where each input receives a weight reflecting its costs to Australian businesses.
Measurement difficulties
There are a number of challenges associated with measuring productivity. For example:
- Output in non-market industries is difficult to measure: The ABS only estimates MFP for 16 market industries in which prices reflect underlying demand for and supply of output. The ABS does not provide MFP estimates for non-market industries, namely public administration and safety, education and training, and health care and social assistance.
- Estimates vary with time periods: In the short run, it can be difficult for a business to change the amount of inputs it uses in response to changes in demand. This means that productivity tends to decline in a downturn because output declines by more than inputs, while productivity tends to increase in a boom because output increases by more than inputs. Due to the potential volatility of short-run estimates, economists often analyse productivity over long periods of time that include a number of economic cycles.
- Some inputs and outputs are not measured: For example, some natural resources and intangible capital inputs are particularly difficult to measure well and some may not be measured at all. Where actual inputs change but have not been measured, estimates of MFP will be distorted.
What drives productivity growth?
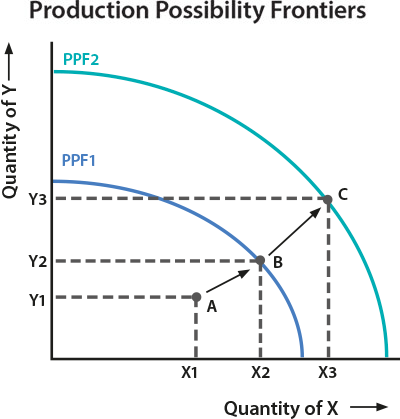
In economics, the production possibility frontier (PPF) is used to show all possible combinations of goods and services that can be produced with a given amount of inputs and technology, when all inputs are used to their full capacity. The PPF can apply to any number of goods and services produced in the economy. However, it is usually illustrated in two dimensions for two goods and services and is useful for showing two ways in which businesses can increase productivity – by operating more efficiently or by expanding productive capacity. Productivity improvements can also have spillover effects for other firms.
Efficiency improvements
A business is producing on its PPF if it is not possible to produce more of one good or service without producing less of another. Economists call this ‘technical efficiency’. If production is inside the PPF, moving closer to the PPF represents an increase in productivity, as more output can be produced with the same inputs.
Suppose a business produces two goods, X and Y. All possible combinations of X and Y that achieve technical efficiency for some amount of inputs and technology is given by PPF1 in the diagram below. If the business is initially producing at point A, which is inside PPF1, then it is not technically efficient. If production moves from point A to point B, which is on PPF1, the business can achieve technical efficiency and higher productivity, as more output can be produced with the same inputs.
One way to improve technical efficiency is through microeconomic reform. Australia's microeconomic policies – such as those related to competition, trade, tax and market regulation – have played an important role in supporting productivity growth over the past few decades by creating incentives for businesses to operate more efficiently.
Expanding productive capacity
A business can also improve its productivity by expanding its potential production, represented by an outward shift in the PPF. In the diagram above, an expansion in potential production would allow the business to move from point B on PPF1 to point C on PPF2 and produce more of both types of goods.
An expansion in potential production can occur as a result of innovation and advances in technology that allow a business to produce more output with the current level of inputs. Such technological progress is often embodied in capital inputs like faster computers or more powerful machines, but can also occur through improvements in knowledge that allow more output to be produced without investing in new capital.
Productivity spillovers
Spillover effects between businesses can further increase the overall level of productivity in the economy. For example, the sharing of knowledge between businesses can generate positive productivity spillovers. Knowledge sharing may occur through direct channels (such as industry innovation hubs) or indirect channels (such as workers changing jobs).
Benefits of productivity growth
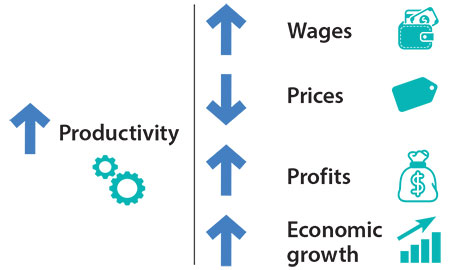
Productivity growth is important for maintaining the economic welfare and prosperity of all Australians. Productivity growth can contribute to one or a combination of the following:
- Higher wages: Productivity growth enables firms to increase wages for workers. Unit labour costs (ULCs), which measure the labour costs associated with producing one unit of output, decrease as labour productivity increases, meaning that firms can offset the effect of wage increases on profits with productivity improvements.
- Lower prices: Businesses can pass on productivity improvements to consumers through lower prices without reducing profits or wages. This also makes Australian businesses more competitive in global markets.
- Higher profits: In response to an improvement in productivity, businesses can increase their profits as it now costs less to produce a given level of output. These profits can be distributed to the business owners or shareholders, or reinvested into the firm.
- Stronger economic growth: Labour and capital inputs tend to be subject to diminishing marginal returns. In other words, holding other inputs constant, the addition of one more unit of labour or capital will lead to a smaller and smaller addition to output. This leaves productivity growth as the main driver of higher living standards in the long run.