Trends in Australia's Balance of Payments
Download the complete Explainer 1.1MBAustralia's trading patterns have evolved considerably over the past century. Structural changes in Australia's economy and those of our trading partners have resulted in significant changes in the pattern of exports, imports and flows of income. At the same time, developments in financial markets and the investment needs of different sectors of the Australian economy have driven changes in the flow of capital.
This Explainer summarises the longer-term trends within the two sides of Australia's balance of payments: the current account and the combined capital and financial account. (For a discussion about the economic concepts and framework of the balance of payments, see Explainer: The Balance of Payments.)
Trends in Australia's Current Account Balance
The current account balance reflects the difference between national savings and investment, and is measured as the sum of the ‘trade balance’, ‘primary income balance’ and ‘secondary income balance’. For simplicity, the primary income balance and secondary income balance are often combined and referred to as the ‘net income balance’. The current account balance can be in surplus (have a positive value), be equal to zero, or be in deficit (have a negative value).
Australia has generally had a current account deficit, reflecting attractive investment opportunities in the economy that exceed our capacity to fund via domestic saving. Changes in the size of the current account deficit have been largely driven by developments in the trade balance, which tends to be volatile from quarter to quarter, while the net income balance has been more stable over time.
In mid-2019, the current account went into surplus for the first time since 1975. This was mainly due to a very large trade surplus, meaning that the value of goods and services exported by Australia to the rest of the world exceeded the value of goods and services imported. This outcome was driven by high prices for resource commodities, especially iron ore, liquefied natural gas (LNG) and coal, as well as a large increase in the production of those commodities. The net income deficit – which captures Australian residents' income from overseas less any payments made by Australian residents to the rest of the world – has been volatile in recent years.

Trends in Australia's Trade Balance
Changes in Australia's trade balance have been influenced by the types of the goods and services Australia exports and imports, as well as the prices that are received or paid for these goods and services. Australia has a comparative advantage in the export of resource and agricultural commodities. Together these commodities account for a relatively large share of our exports and have more volatile prices than those of the goods and services Australia imports. As a result, the nation's trade balance tends to fluctuate alongside changes in these commodity prices. (For a discussion of commodity prices, see Explainer: Australia and the Global Economy – The Terms of Trade Boom.)

This section explores in more detail how changes in the structure of the Australian and global economies have influenced what Australia trades in and with which economies Australia trades.
Exports
An open economy like Australia can choose to export goods and services to the rest of the world for a range of reasons. One possibility is that domestic production is higher than domestic consumption, creating an excess of supply. Another is that an overseas buyer may be willing to pay a higher price for the goods or services than a domestic consumer; for instance, because the goods or services are not available in their home economy.
The composition of Australia's exports
Over the past century, Australia's exports to the rest of the world have been dominated by either agricultural or resource commodities, reflecting Australia's natural advantage in producing these goods. Up until the mid-1960s, wool was Australia's largest export, accounting for around 40 per cent of Australia's total export values. As the agricultural sector gradually became a smaller part of the Australian economy, its share of exports also declined, accounting for around 10 per cent of total export values in recent years. Meat and wheat exports are currently Australia's predominant agricultural exports, while wool accounts for a much smaller share than it has historically.
Australia has also had a long history of exporting many different natural resources to the rest of the world, consistent with Australia's large natural resource endowment and relatively low domestic usage of these goods. In the early 1900s, gold was Australia's top resource export, accounting for around 10 per cent of total export values. However, exports of iron ore, coal and LNG have become increasingly important, particularly after the mining investment boom in the 2000s, which substantially increased Australia's capacity to extract these resources. Together, iron ore, coal and LNG now account for around three-quarters of the value of Australia's resource exports. The COVID-19 recession and associated international border closures resulted in a sharp decline in education and tourism service exports, but exports of these services have grown strongly in recent years following the re-opening of the border.

Australia's major export trading partners
From the early 1900s through to the 1950s, Australia mainly exported agricultural products (wool, wheat and dairy) and gold to the United Kingdom and other European economies, reflecting Australia's close political ties with these economies. After the Second World War, exports of resources, manufactured goods and services started to grow in importance but the direction of Australia's trade started to change.
In the late 1960s, Australia's export trade became increasingly oriented towards those Asian economies experiencing rapid growth (including Japan, South Korea and later Mainland China).
The ongoing industrialisation and urbanisation of these economies increased their demand for Australia's natural resources, such as coal and iron ore, which are used in construction, manufacturing and power generation. During the 1980s, as average household incomes in neighbouring economies rose, demand for Australian services also started to rise in importance, particularly for education and travel services. In 2009, Mainland China overtook Japan to become Australia's largest trading partner, owing to its strong demand for natural resources. Resource exports currently account for more than half of Australia's total export values.
| UK | EURO AREA | JAPAN | MAINLAND CHINA | SOUTH KOREA | OTHER EAST ASIAN ECONOMIES1 | UNITED STATES | OTHER ECONOMIES | |
|---|---|---|---|---|---|---|---|---|
| 1900s | 48 | 19 | 1 | 1 | 0 | 2 | 5 | 23 |
| 1910s | 49 | 17 | 3 | 0 | 0 | 3 | 7 | 20 |
| 1920s | 41 | 23 | 7 | 0 | 0 | 4 | 7 | 16 |
| 1930s | 52 | 17 | 8 | 2 | 0 | 3 | 6 | 12 |
| 1940s | 34 | 8 | 1 | 1 | 0 | 4 | 19 | 34 |
| 1950s | 33 | 22 | 9 | 0 | 0 | 5 | 8 | 23 |
| 1960s | 18 | 15 | 18 | 4 | 0 | 7 | 11 | 26 |
| 1970s | 7 | 11 | 29 | 2 | 1 | 10 | 11 | 28 |
| 1980s | 6 | 10 | 24 | 3 | 4 | 15 | 12 | 28 |
| 1990s | 5 | 7 | 22 | 3 | 6 | 21 | 10 | 26 |
| 2000s | 6 | 6 | 17 | 9 | 7 | 18 | 9 | 28 |
| 2010s | 3 | 4 | 14 | 27 | 7 | 17 | 5 | 22 |
| 2020s | 4 | 4 | 12 | 35 | 6 | 16 | 6 | 18 |
|
Sources: ABS; DFAT; RBA |
||||||||
|
1. Other East Asia includes Taiwan, Singapore, Hong Kong, Indonesia, Thailand, Philippines, Malaysia and Vietnam |
||||||||
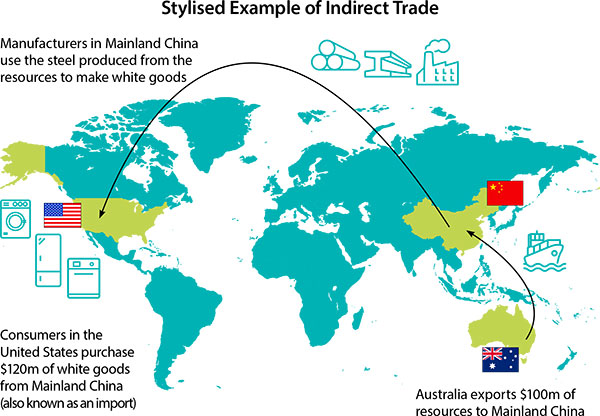
Although the relative importance of non-Asian economies as direct export trading partners has declined over time, they remain an important indirect source of demand for Australia's exports. This is because many of the goods that Australia directly exports to Asian economies are part of global supply chains, where products are assembled in Asia and the finished products are then sold to buyers, many of whom are in advanced economies.
For example, consider an Australian mining company that exports $100 million of iron ore to a steelmaker in Mainland China who produces steel for a range of manufactured products. A manufacturer in Mainland China uses this steel to produce ‘white goods’ like washing machines and refrigerators that are purchased by consumers in the United States for $120 million. Although Australia did not directly export these products to the United States, demand for Australia's resources was indirectly boosted by American consumers through their trading relationship with Mainland China.
Imports
Goods and services can be imported into an open economy like Australia because they are not available domestically (for example, a highly specialised piece of mining equipment or a family holiday to see the Eiffel tower in Paris), or because they are cheaper to purchase than equivalent domestic goods and services.
The composition of Australia's imports
Australia imports a wide variety of goods and services from the rest of the world. In contrast to the composition of Australia's exports, Australia's imports are not clearly dominated by one or two categories. In addition, the composition of imports has been more stable over time. Nevertheless, there have still been some changes in the composition of imports that have occurred alongside longer-run changes in the types of goods and services that are produced within the Australian economy.

For instance, the share of imports accounted for by industrial supplies – such as specialised parts for machinery & equipment, chemicals and plastics – has declined as manufacturing has become a smaller share of the Australian economy. The decline in Australian manufacturing has meant that fewer goods are assembled in Australia and, as a result, demand for inputs from overseas has declined. A related consequence has been that imports of fully assembled goods, which are ready to be used, have increased; these types of finished goods are commonly referred to as ‘final’ goods. These have included consumer goods – such as clothing and footwear, toys and household electrical items (like televisions and radios) – as well as capital goods. Capital goods are typically used for investment purposes and include items like specialised machinery, telecommunications equipment and computer hardware.
Services have consistently been one of the largest components of Australia's imports, accounting for around one-quarter of total import values, on average, over the past few decades. Service imports mostly reflect the expenditure of Australian residents while they are overseas for holiday, education and business-related reasons, as well as their transport costs (e.g. plane tickets). As with service exports, service imports also fell sharply during the pandemic due to restrictions on international travel, but have grown strongly in recent years following the re-opening of borders.
| UK | EURO AREA | JAPAN | MAINLAND CHINA | SOUTH KOREA | OTHER EAST ASIAN ECONOMIES1 | UNITED STATES | OTHER ECONOMIES | |
|---|---|---|---|---|---|---|---|---|
| 1900s | 60 | 10 | 1 | 0 | 0 | 3 | 13 | 14 |
| 1910s | 53 | 7 | 3 | 0 | 0 | 3 | 16 | 17 |
| 1920s | 45 | 6 | 3 | 1 | 0 | 5 | 23 | 17 |
| 1930s | 40 | 8 | 5 | 1 | 0 | 7 | 16 | 23 |
| 1940s | 37 | 2 | 1 | 0 | 0 | 4 | 27 | 29 |
| 1950s | 44 | 10 | 2 | 0 | 0 | 6 | 12 | 25 |
| 1960s | 27 | 13 | 8 | 1 | 0 | 5 | 22 | 23 |
| 1970s | 16 | 15 | 17 | 1 | 1 | 7 | 22 | 21 |
| 1980s | 10 | 13 | 18 | 2 | 2 | 13 | 21 | 21 |
| 1990s | 8 | 13 | 14 | 4 | 2 | 14 | 22 | 23 |
| 2000s | 6 | 13 | 10 | 10 | 3 | 20 | 16 | 23 |
| 2010s | 4 | 13 | 7 | 16 | 4 | 19 | 13 | 24 |
| 2020s | 4 | 13 | 6 | 21 | 3 | 17 | 13 | 23 |
|
Sources: ABS; DFAT; RBA |
||||||||
|
1. Other East Asia includes Taiwan, Singapore, Hong Kong, Indonesia, Thailand, Philippines, Malaysia and Vietnam |
||||||||
Australia's major import trading partners
In the early 1900s, Australia mostly imported goods from the United Kingdom and other European economies. However, the United States was also an important source of imports, especially around the time of the Second World War. Australian imports from the Asian region started to increase during the 1970s and the share from many advanced economies declined. Since the 1990s, at least half of Australia's imports have been sourced from economies in Asia.
Trends in Australia's Income Balance
Australia's combined primary and secondary income balance – or net income balance – has been in deficit for many decades, which means that Australian residents have paid more income to non-residents than they have received from non-residents.
The ‘financial investments' component of the primary income balance has historically driven the majority of the net income deficit. This has reflected Australia's net foreign liability position – which is where the stock of Australian liabilities held by foreign investors exceeds the stock of foreign assets held by Australian residents. As a result, Australians pay more interest to the rest of world on these liabilities than they receive on their assets from abroad. In recent years, Australia's mining sector has been a large component of Australia's net income outflows, as this sector has a high degree of foreign ownership. This results in part of the income earned by these companies in Australia being paid to foreign owners in the form of dividends.

Trends in Australia's Capital and Financial Account
The combined capital and financial account records the capital and financial transactions between Australia and the rest of the world. Historically, the Australian economy has generally been a net recipient of capital inflows from the rest of the world. In other words, the savings of the domestic economy have been supplemented with inflows of capital from abroad in order to fund the relatively high level of investment in the Australian economy. This has been reflected in a capital and financial account surplus – the counterpart to Australia's current account deficits.
In recent years, however, there has been a net outflow of capital from Australia – that is, Australians have invested more overseas than those abroad have invested in Australia's economy. This has been reflected in a capital and financial account deficit, and is consistent with the recent shift to a current account surplus.

Trends in Australia's Capital Flows
Prior to the 1980s, foreign investment in Australia generally took the form of foreign direct investment. In the early 1980s, Australia's financial sector underwent a period of deregulation, which included the removal of capital controls and the floating of the Australian dollar in 1983 (see Explainer: Exchange Rates and their Measurement). As a result of these reforms, Australian residents could use their savings to invest overseas more freely than before and overseas investors were able to invest in a broader range of Australian assets. Reflecting this, capital flows to and from Australia increased substantially and became more varied in their type. In particular, investment in portfolio assets (e.g. equities, bonds and cash) increased dramatically. During the 2010s, however, foreign direct investment again represented a large share of net capital inflows.
Since 2019, Australia has experienced a net outflow of capital. This reflects a reduction in inflows of foreign direct investment and an increase in portfolio outflows, such as purchases of foreign equities by Australian investment funds (e.g. superannuation funds).

Capital flows by sector
Prior to 2007, around two-thirds of foreign capital flows into Australia was directed to the financial sector. This was because Australian banks funded most of their lending by borrowing in overseas markets. During the 2010s, net capital flows to the Australian banking sector declined to around zero as banks funded more of their operations using domestic deposits. Meanwhile, there were large public sector capital inflows related to purchases of Australian government debt. Foreign investment also played an important role in expanding the capacity of Australia's resources sector in order to meet growing global demand for Australian commodities. These capital inflows to the private sector have been partially offset by outflows from Australian superannuation funds, which have accumulated a large stock of foreign assets, particularly foreign equities. In 2020, there was a net capital outflow from the financial sector, including banks. This was mainly because banks reduced their stock of overseas debt, partly reflecting access to low-cost domestic funding, including through the RBA's Term Funding Facility. Since then, capital outflows have been small and across all sectors.

Capital inflows by geography
Advanced economies such as the United States, the United Kingdom, Europe and Japan have accounted for the majority of foreign investment in Australia since 2000. The value of capital flows from Mainland China to Australia in the 2010s increased relative to these flows in previous decades, though the overall flows from Mainland China remain small.
Trends in Australia's External Position
As a result of net capital inflows from abroad, Australia has accumulated a net liability (borrowing) position with the rest of the world. However, the composition of these net foreign liabilities can shift over time. In recent years, net long-term debt liabilities have fallen as banks gained access to low-cost domestic funding, credit growth declined, and interest rates increased (which reduces the value of debt). Australia's net foreign equity liabilities have also declined markedly in recent years. Since 2013, Australia has had a net foreign equity asset position – Australian residents own more equity in foreign companies than non-residents own in Australian companies.
| UK | EURO AREA | JAPAN | MAINLAND CHINA | SOUTH KOREA | OTHER EAST ASIAN ECONOMIES1 | UNITED STATES | OTHER ECONOMIES | |
|---|---|---|---|---|---|---|---|---|
| 2000s | 24 | 7 | 4 | 0 | 0 | 6 | 26 | 32 |
| 2010s | 18 | 14 | 6 | 2 | 1 | 7 | 27 | 25 |
| 2020s | 18 | 18 | 6 | 2 | 1 | 7 | 24 | 23 |
|
Sources: ABS; DFAT; RBA |
||||||||
|
1. Other East Asia includes Taiwan, Singapore, Hong Kong, Indonesia, Thailand, Philippines, Malaysia and Vietnam |
||||||||

Foreign currency composition
Most of Australia's liabilities with the rest of the world are denominated in Australian dollars, rather than foreign currencies. This includes foreign investment in the equity of Australian companies and in Australian government debt. In addition, many Australian firms that borrow funds in international markets convert their foreign currency borrowings into Australian dollars using financial instruments known as derivatives. This practice is known as ‘hedging’ and ensures that a depreciation in the Australian dollar does not make it more expensive for firms to repay their foreign debts. In contrast, over half of Australia's foreign assets are denominated in foreign currencies.
This results in Australia having a net foreign currency asset position: Australian residents own more assets denominated in foreign currencies than we owe liabilities denominated in foreign currencies to non-residents. The currency composition of Australia's foreign assets and liabilities determines how the external position is affected by movements in the exchange rate. Because Australia has a net foreign currency asset position, when the Australian dollar depreciates, the value of foreign currency denominated assets increases in Australian dollar terms, and so our gross foreign assets increase relative to our gross foreign liabilities. In addition, the income received on our foreign assets increases relative to the income paid on our foreign liabilities. This means that, overall, a depreciation of the currency would tend to strengthen Australia's external position and result in a narrowing of the net income deficit. These features enable the exchange rate to be a more effective shock absorber for the Australian economy (see Explainer: Exchange Rates and the Australian Economy).
