Reserve Bank of Australia Annual Report – 1980 Economic Developments
1. Domestic Developments
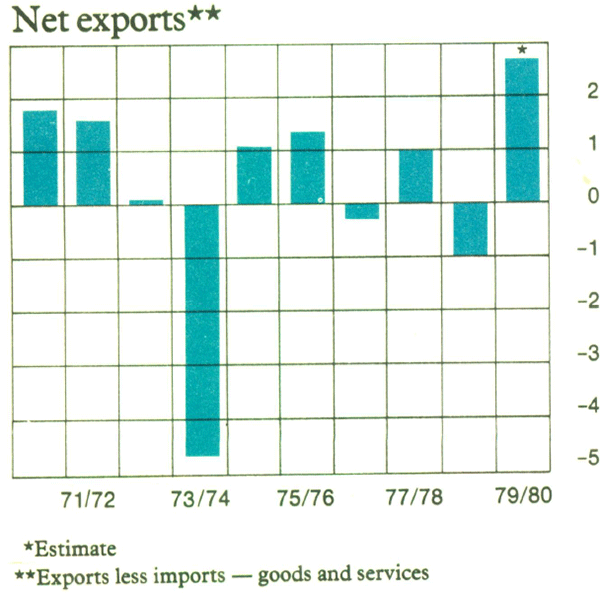
On some measures, the Australian economy did reasonably well in 1979/80. Production grew firmly in the non-farm sector and remained high in the farm sector. Employment recorded the largest increase for some years, and the current account of the balance of payments was strong.
There were problem aspects: inflation increased, and unemployment remained high, despite the increase in employment.
Production and Spending
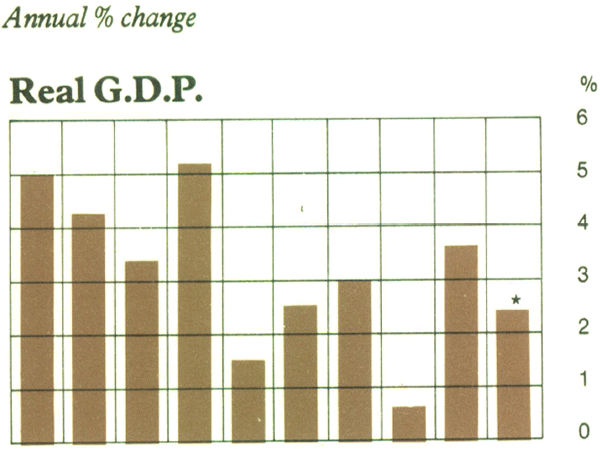
The increase in production in 1979/80 was concentrated in the non-farm sector, where output grew somewhat more quickly than in the previous year. Farm output fell from the very high level of the previous year, but remained well above average. Production of wheat was again high.
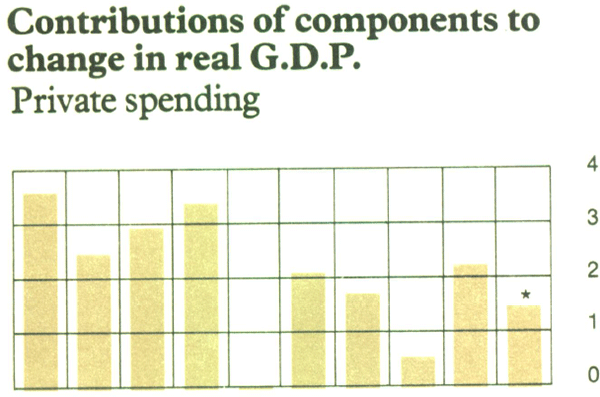
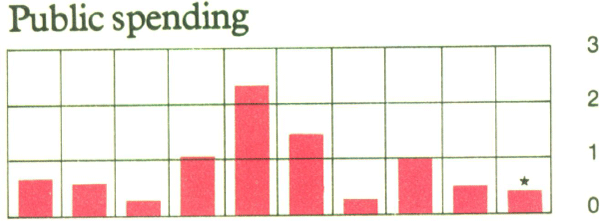
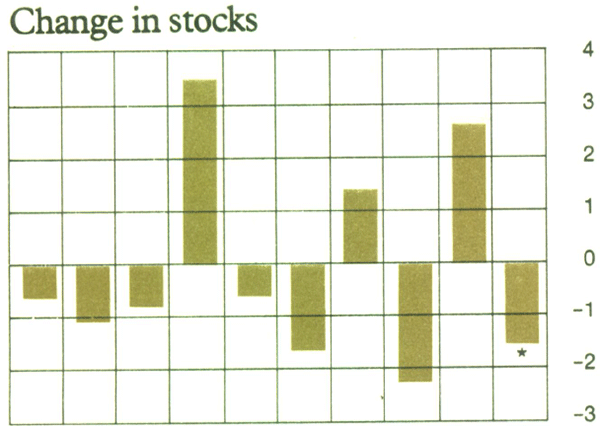
Output grew in both halves of the year. In the first half, the stimulus came from net exports; final domestic spending was flat at this stage and the rate of stock accumulation was steady. In the second half, the contribution to growth came largely from an increase in final domestic spending; net exports flattened out and stocks fell.
For the year as a whole, final domestic spending increased a little more slowly than in the previous year. This slowing was evident in both private and public spending. The slowing in private spending reflected a fall in business investment; for this component of spending there was some after-effect, early in the year, from the phasing down of the investment allowance in June 1979. In the second half of the year, investment picked up strongly. Private consumption grew at about the rate of other recent years. The growth of consumption was a little slower in the early months of the year, when the income tax surcharge applied, but picked up later in the year. Investment in dwellings was substantially higher than in the previous year. For public spending, the smaller increase was due partly to the timing of deliveries of defence equipment. Within the total, current spending grew more strongly than capital spending, and spending of State and local authorities continued to increase more quickly than that of the Commonwealth.
There was a sharp turn-around in farm stocks in 1979/80 as the very large wheat harvest of the previous year was shipped. Non-farm stocks rose moderately.
PRODUCTION AND SPENDING
Prices, Incomes and Costs
In 1979/80, prices rose more quickly than in the previous year. The consumer price index rose by 10.2 per cent year on year; this was about 2 percentage points more than in 1978/79. More comprehensive measures of inflation – e.g. the implied price deflator for non-farm gross domestic product – rose a little less rapidly than the consumer price index, but nevertheless more than in the previous year.
PRICES AND WAGES
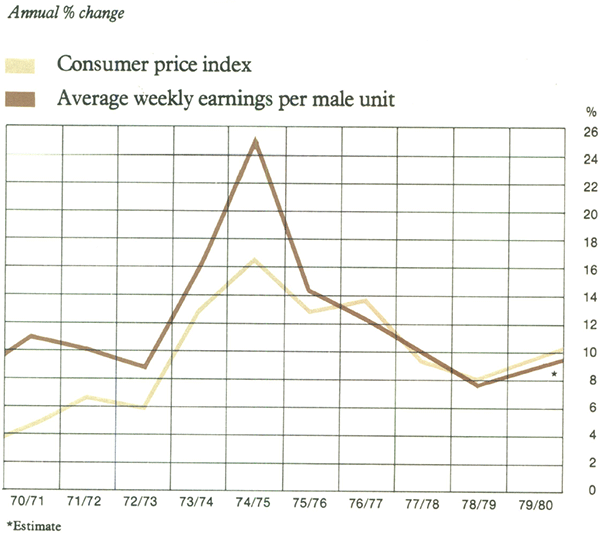
Food prices again rose strongly,with an increase of 14.0 per cent. Other factors pushing the consumer price index upwards were increases in oil prices and a change in arrangements for health insurance. Increases in the price of oil added directly some 1.5 percentage points to the year-on-year increase in the consumer price index; this was substantially more than in the previous year. The changes in health insurance added about 0.5 percentage points.
Wages also rose more quickly in 1979/80. Average weekly earnings for males increased by a little under 10 per cent compared with about 8 per cent in 1978/79. Although the Arbitration Commission continued to apply less than full indexation in granting national wage increases, a substantial proportion of the workforce also received wage increases for assessed increases in work value. As a result of the faster rate of increase in wages, labour costs per unit of output rose more than in the previous year.
The gross operating surplus of companies increased at a rate somewhat faster than in 1978/79 and, as a proportion of total income, rose a little.
The Labour Market
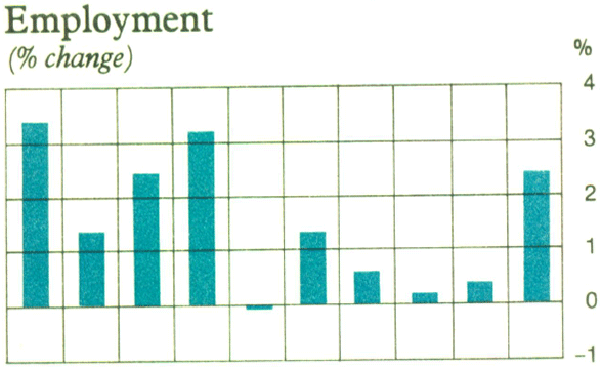
Employment strengthened in 1979/80. The increase for the year – about 2.5 per cent – was the strongest since 1973/74. In contrast with other recent years, much of the increase was in full-time employment, although part-time employment also rose. Employment of both males and females was higher than in the previous year.
LABOUR MARKET *
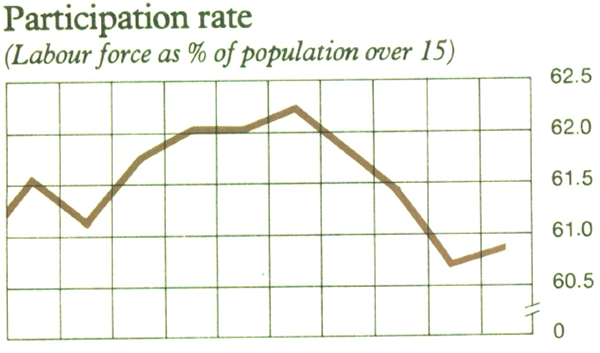
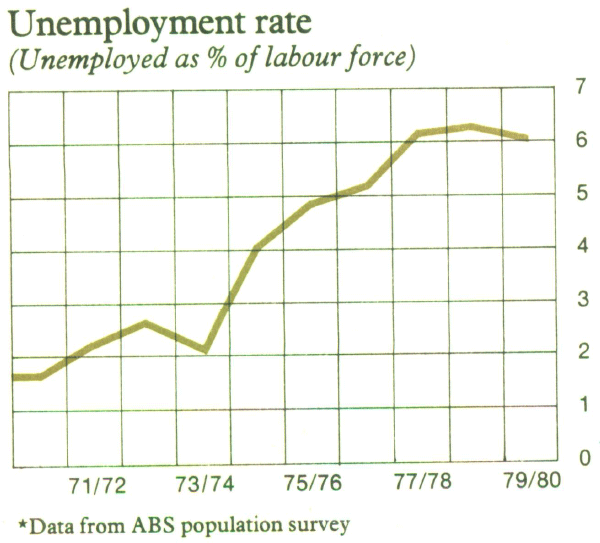
The labour force grew by 2.1 per cent in 1979/80, somewhat more than in the previous year. A factor in the faster growth was a turn-around in the participation rate; after falling over the previous three years, the ratio of the labour force to the working-age population rose over 1979/80, and averaged 61.0 per cent for the year.
In 1979/80, unemployment (on Australian Bureau of Statistics figures) averaged a little under 400,000 or 6.1 per cent of the labour force. During much of the year, unemployment was slightly lower than in the previous year but, late in the year,it moved above the previous year's levels, partly reflecting the increase in the rate of participation in the labour force.
The Balance of Payments
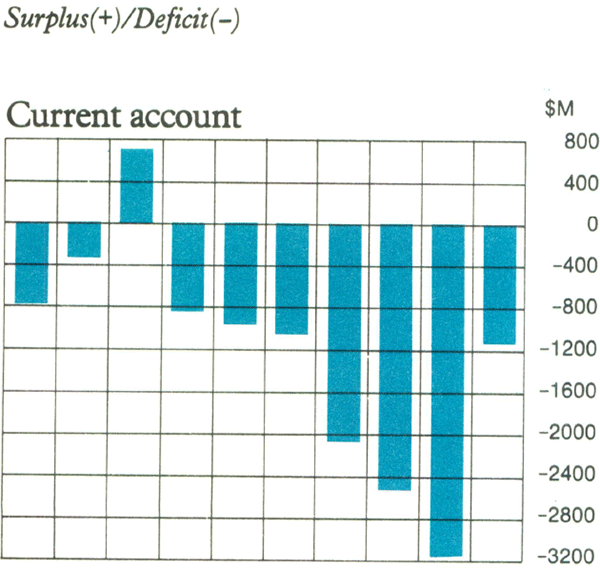
The main feature of the balance of payments in 1979/80 was the improvement in the current account. For the year,the current account deficit fell to $1,167 million, about a third that of the previous year. This improvement was due to the strength of exports; over the year they increased by 33 per cent, with solid increases in both prices and quantities. The increase was broadly based but the rises in exports of wheat, sugar, non-ferrous metals and manufactured goods stood out.
The value of imports rose by 17 per cent. The increase was all attributable to higher prices; this reflected the acceleration in world inflation and the jump in prices for oil. The volume of imports fell slightly; the fall was partly the result of the slow-down in business investment, but more generally reflected the improved competitiveness of Australian goods. The terms of trade moved slightly against Australia in 1979/80, notwithstanding the substantial increase in export prices.
The trade account recorded a surplus of $2,913 million in 1979/80, well up on the previous year's surplus of $599 million. Net payments for invisible items came to $4,080 million; this compared with a figure of $3,790 million in the previous year. Higher costs of transport were an important part of the increase for the year.
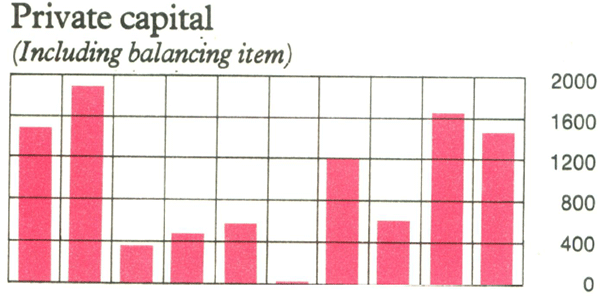
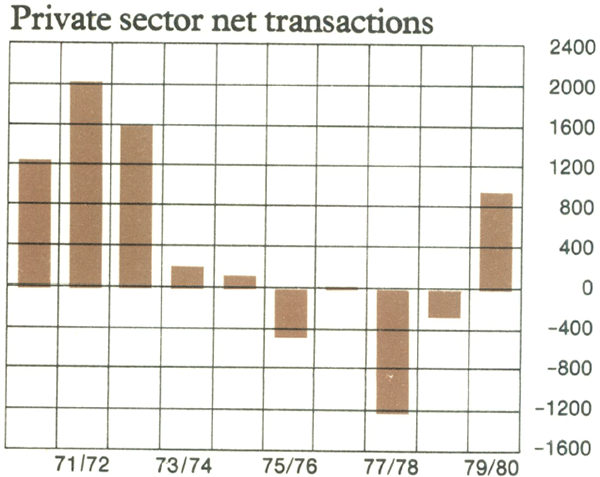
Net private capital inflow (excluding trade credit transactions of marketing authorities) came to $1,486 million in 1979/80, a little less than in the previous year. This figure included about $200 million on account of borrowing overseas by State authorities under the infrastructure financing programme. Trade credit transactions of marketing authorities resulted in a net outflow of capital amounting to about $550 million in 1979/80. The full-year figure for private capital inflow was more than accounted for by the inflow in the second half of the year; although there were inflows in some of the months earlier in the year, for the first half-year as a whole, a net outflow was recorded.
AUSTRALIA's BALANCE OF PAYMENTS
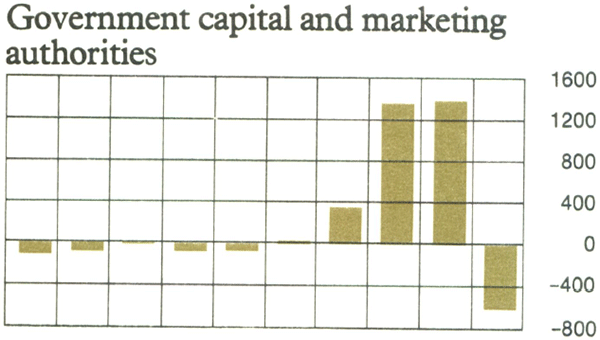
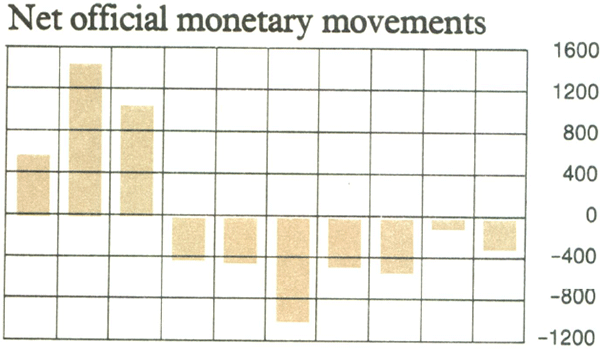
Borrowing overseas by the Commonwealth Government was much lower than in the previous year. There were four loan raisings during the year, totalling $471 million; in the previous year, raisings totalled $1,557 million. After allowing for repayments and other capital transactions, there was a net outflow of $76 million on account of the Commonwealth Government in 1979/80. This compared with a net inflow of $1,355 million in 1978/79.
Overall, the balance of payments recorded a deficit of $310 million in 1979/80. This was made up of a surplus of almost $1,000 million on private transactions and a deficit of about $1,300 million on Commonwealth Government transactions. The outcome for private transactions was a substantial turn-around from the previous year's deficit of $254 million.
Even though the balance of payments was in deficit, the value of official reserve assets rose by $1,796 million during the year to $5,681 million; the increase was more than accounted for by a rise of $2,177 million in the value of gold holdings.
2. Overseas Developments
Important developments in the world economy in 1979/80 were an acceleration in inflation; a further sharp increase in the price of oil; rapidly rising commodity prices until early in 1980; widespread tightening in policies resulting in high interest rates in many countries, particularly in the United States, for much of the year; continued volatility in exchange rates; and some slowing in economic activity, with the United States entering a period of recession.
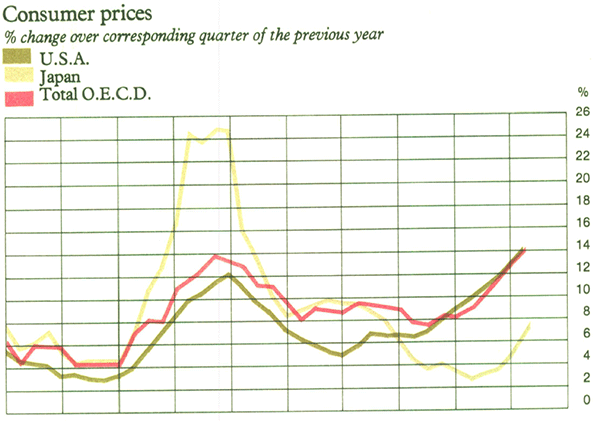
Consumer prices started to accelerate as early as 1978 in some major economies although, in the case of Japan, the strength of the yen dampened price pressures. Particularly in the United States, the acceleration in prices followed a period of strong demand and fairly rapid growth in the monetary aggregates. The subsequent increases in the price of oil and other primary commodities added further impetus to inflation. The consumer price index in the United States increased by 13 per cent in 1979, and in the first half of 1980 the annual rate of increase accelerated to about 16 per cent. Price deflators from the national accounts also accelerated over this period, although to an extent less than the consumer price index. For the OECD area, the increase in consumer prices averaged about 13 per cent in 1979 and reached an annual rate of about 15 per cent in the first half of 1980. All major countries experienced some worsening in inflation, but divergences between the experiences of the various countries remained large. Of the major countries, Germany remained at the bottom end of the range with an annual rate of increase in consumer prices in the first half of 1980 of about 7 per cent. Italy and the United Kingdom were at the top of the range with annual rates of increase of over 20 per cent.
OVERSEAS ECONOMIC INDICATORS
Oil prices increased sharply around mid-1979 and again in late 1979; some further increases occurred in the first half of 1980. As an indication of the extent of the increases, the price of Saudi Arabian light crude at mid-1980 was almost double the price around mid-1979. These increases took place against a background of uncertainty about future supplies of oil,strong inventory demand, and increased trade in the spot market.
There was a boom in gold and other commodity markets in late 1979 and early 1980. The price of gold rose from US$278 per fine ounce at end-June 1979 to a peak of US$850 per fine ounce in late January 1980. The price fell sharply over February and March, to less than US$500 per fine ounce. Later in the year it again started to rise and on 30 June 1980 was about US$650 per fine ounce. Around the middle of 1979/80, the markets for other metals also were subject to speculative pressures, with prices rising sharply. Subsequently, prices have fallen – in some cases substantially.
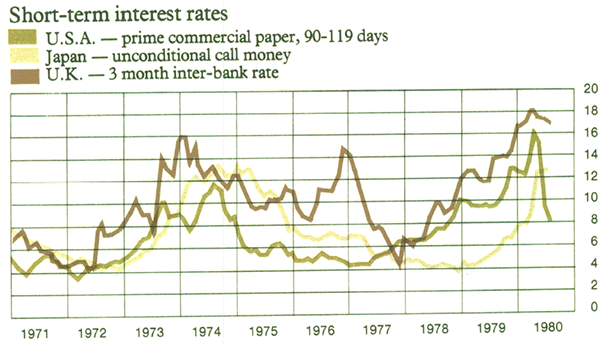
Many countries responded to accelerating prices by adopting firmer policies. In the United States, steps were taken to tighten monetary policy in October. Short-term interest rates, which had already risen substantially over the previous eighteen or so months, jumped further. In early 1980, there were signs that inflation was continuing to worsen and, over February and March, further measures were taken to restrain growth in money and credit, and a tightening in fiscal policy was foreshadowed. The new monetary measures were intended to reinforce those introduced in October, but they included broader measures of restraint through use – for the first time – of the Credit Control Act. From February, interest rates again rose sharply; the prime lending rate of commercial banks reached 20 per cent in April, and other rates also reached very high levels. Interest rates subsequently fell, in some cases sharply, before steadying in the final weeks of 1979/80. Following the drop in interest rates, the special measures of credit restraint taken in March were phased out, and the discount rate was lowered.
Many other countries also tightened policies over late 1979 and early 1980. In most instances, this was a reaction to concern about worsening inflation in their domestic economies but, in part, it also represented defensive action aimed at reducing the effects on their external positions of higher interest rates in the United States. While the emphasis in most countries was on monetary policies, some tightening of budgetary policies also took place.
Activity in the world economy slowed in the first half of 1980; the annual rate of increase in GNP in OECD countries appears to have been about half the rate in 1979. A large part of this slowing reflected the onset of recession in the United States economy, but growth in most major countries appeared to ease. With activity weakening, unemployment rates tended to rise.
OVERSEAS BALANCE OF PAYMENTS
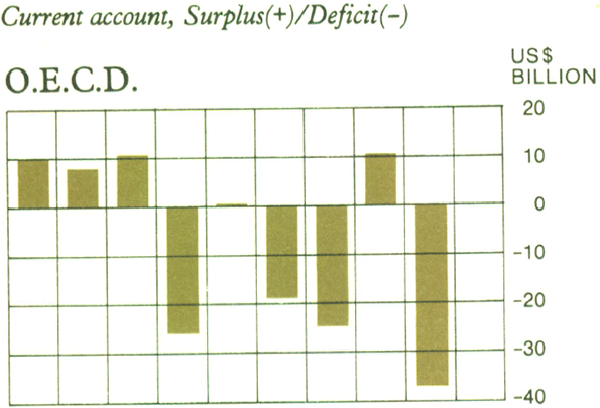
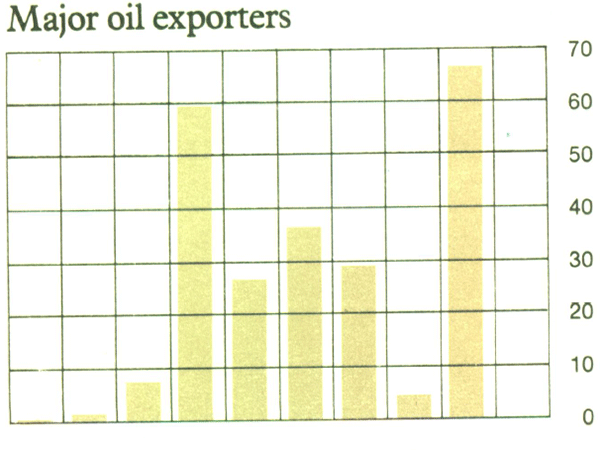
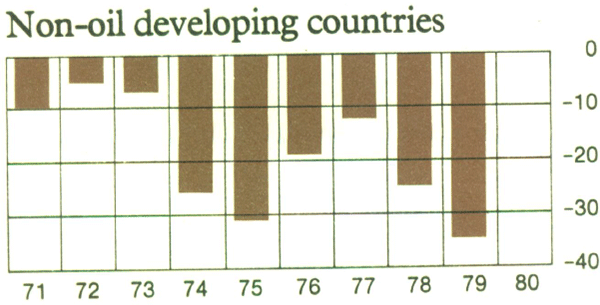
As a result of the increase in oil prices, the current account of the balance of payments improved for oil exporters, and deteriorated for OECD countries and non-oil developing countries. As a group, the major oil producers recorded a current account surplus of US$67 billion in 1979 compared with a surplus of US$5 billion in 1978. The counterpart of this was that, for the OECD countries, the current account deteriorated from a surplus of US$11 billion in 1978 to a deficit of US$38 billion in 1979; and, for non-oil developing countries, the deficit increased from US$26 billion to US$35 billion. This imbalance worsened in the first half of 1980.
Within the OECD group, there was a shift in the pattern of current account balances. The current account of the United States was approximately in balance in 1979 after the large deficits of the previous two years; the current accounts of Japan and Germany moved from heavy surpluses to deficits. This shift in pattern stemmed largely from differences in the cyclical positions of the various economies; from changes in competitiveness, reflecting partly past exchange rate changes; and from the increase in the price of oil.
In foreign exchange markets, the tightening in monetary policy in the United States saw a strengthening of the United States dollar, particularly over February, March and early April. By early April, the appreciation of the dollar since the start of 1979/80 amounted to 20 per cent against the yen, 7 per cent against the deutschemark, 6 per cent against the French franc, and 2 per cent against sterling. Factors in these exchange rate movements were the differing degrees of dependence on oil, inflation performance, monetary policies and, to some extent, intervention by authorities.
With the decline in interest rates in the United States which began in April, the dollar weakened. By the end of June 1980, it had lost most of the gains it had made against the yen since mid-1979, and more than lost the ground it had gained against the deutschemark, the French franc and sterling.