Reserve Bank of Australia Annual Report – 1980 Financial Developments
1. Financial Conditions
Liquidity and Money
In 1979/80, the monetary aggregates showed substantial increases. M3, the measure most commonly used, increased by 12.9 per cent; a narrower measure (M1) increased at a similar rate. In the previous year, the respective increases were 11.8 per cent and 16.7 per cent. Broader measures also increased quickly – e.g. a measure which comprises M3 plus withdrawable funds of permanent building societies and borrowings of finance companies increased by about 14 per cent after an increase of 12.6 per cent in 1978/79. Domestic credit expansion – i.e. growth in M3 coming from domestic factors amounted to 10.7 per cent compared with 12.4 per cent in the previous year.
Developments in the money supply are commonly analysed in terms of M3. The major factors affecting this measure of the money supply are listed in the table on page 16. An important factor in the result for 1979/80 was the reduction in the deficit of the Commonwealth Government. For the year, the domestic deficit was $562 million; this was $313 million below the estimate made in August 1979 and $1,696 million below the outcome in the previous year. A factor adding to liquidity was the turn-around in the balance of payments. This was substantial; over the year the private sector recorded a balance of payments surplus of $974 million compared with a deficit of $254 million in 1978/79. Advances outstanding to rural marketing organisations by the Rural Credits Department of the Reserve Bank fell by $285 million over the year. The total increase in private holdings of LGS assets over 1979/80 was $1,187 million; this compared with $1,734 million in the previous year.
Of this increase in LGS assets, $775 million took the form of increased holdings of government securities by the private non-bank sector. This figure took in a fall of $196 million in holdings of Treasury notes and increases of $174 million and $797 million respectively in holdings of Australian Savings Bonds and Treasury bonds. For much of the year, and particularly during the time when interest rates overseas were at very high levels, the domestic demand for bonds was very weak. By mid-April, private non-bank holdings of Treasury bonds had fallen by about $200 million. In April, interest rates overseas started to fall and, with the introduction of the tap system, sales of bonds from then on picked up.
Holdings of LGS assets by the banking sector showed little change in 1979/80. However, bank balance sheets (and there-fore the money supply) expanded strongly as a result of a sharp increase in bank lending. Over the year, loans and advances outstanding of trading and savings banks increased by $4,422 million or 13.2 per cent. The increase was much larger than in the previous year and reflected both a rapid pace of new lending by trading banks early in the year and a sharp rise in the usage of trading bank overdraft limits. Details of bank lending are given in the second part of this chapter.
| $ million | |||||
|---|---|---|---|---|---|
| 1975/76 | 1976/77 | 1977/78 | 1978/79 | 1979/80 | |
| Budget domestic deficit | 2,873 | 1,864 | 2,361 | 2,258 | 562 |
| Private external transactions | −466 | 19 | −1,202 | −254 | 974 |
| Rural credits advances | 9 | 378 | −106 | 78 | −285 |
| Other factors adding to LGS | −437 | −837 | 676 | −348 | −64 |
| Private LGS Assets | 1,979 | 1,424 | 1,729 | 1,734 | 1,187 |
| less non-bank holdings of: | |||||
| Notes and coins | 380 | 360 | 384 | 421 | 457 |
| Commonwealth Government securities | 1,452 | 1,091 | 1,244 | 720 | 775 |
| Banking LGS Assets | 147 | −27 | 101 | 593 | −45 |
| Bank loans and advances | 3,433 | 3,287 | 3,391 | 3,736 | 4,422 |
| Other assets and liabilities of banks | 393 | 418 | −1,154 | −110 | 555 |
| Bank Deposits | 3,973 | 3,678 | 2,338 | 4,219 | 4,932 |
| less Government and inter-bank deposits | 410 | 578 | −193 | 17 | −255 |
| add back Notes and coin | 380 | 360 | 384 | 421 | 457 |
| Change in Volume of Money (M3) | 3,943 | 3,460 | 2,915 | 4,623 | 5,644 |
A further factor adding to M3 in 1979/80 was a switching by State Governments from fixed deposits to certificates of deposit, reflecting the more favourable interest rate on the latter deposits. As the statistics are compiled, certificates of deposit held by Governments are included in M3, while fixed and current deposits of Governments are not. This switching accounted for 0.6 percentage points of the increase in M3.
The within-year variation in financial conditions was sub-stantial. The Commonwealth's transactions were the major influence here. In the early months of the year, these transactions added less to liquidity and money than in other recent years. Also, over this period, the external transactions of the private sector were in deficit. Mainly because of these influences, liquidity grew relatively slowly; over the September quarter, private holdings of LGS assets rose by only $415 million compared with an average rise of $886 million in this quarter of the previous five years.
Over the December and March quarters, liquidity built up quite rapidly so that the cumulative increase in private holdings of LGS assets reached a seasonal peak of about $3,000 million – not much below the figure in the previous year. The expansion in liquidity in the December quarter flowed mainly from Commonwealth Government transactions; in the March quarter, a substantial surplus on private foreign exchange transactions and large advances by the Rural Credits Department of the Bank provided the impetus.
During the seasonal rundown over the final months of the year, private holdings of LGS assets were reduced by about $1,500 million compared with $1,400 million in the corresponding period of the previous year. There was a large surplus on the Government's accounts; this drain on liquidity was partly offset by an increased inflow of funds from overseas.
FINANCIAL GROUPS: INTEREST RATES*
Interest Rates
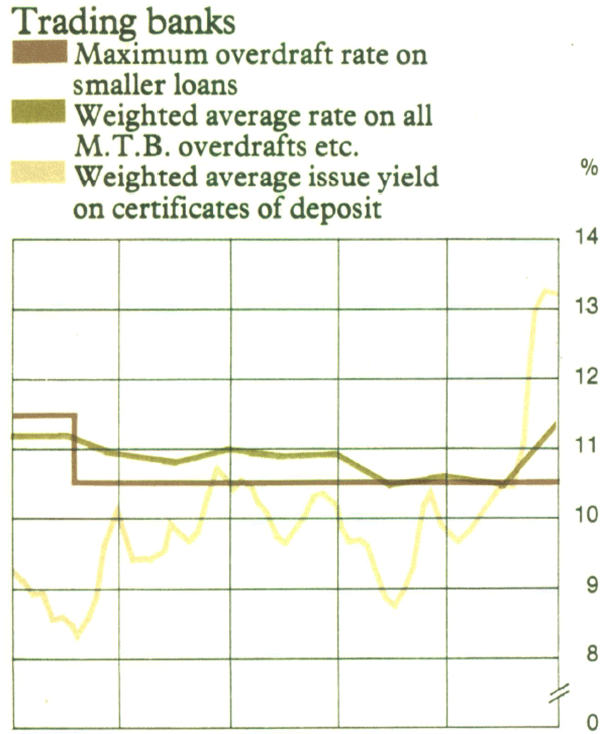
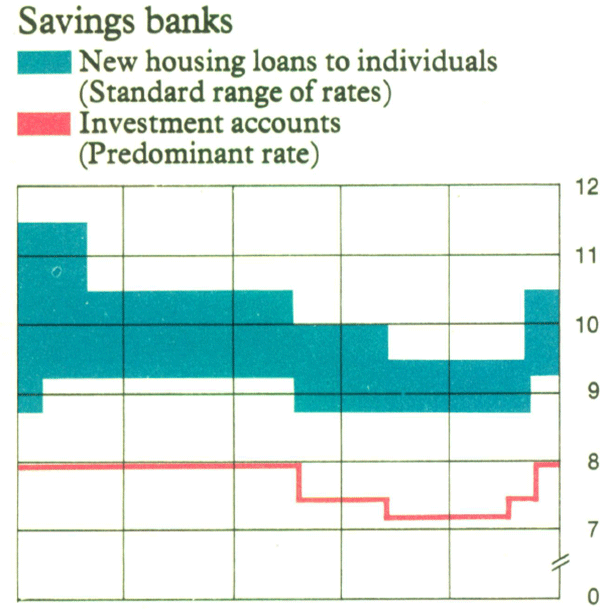
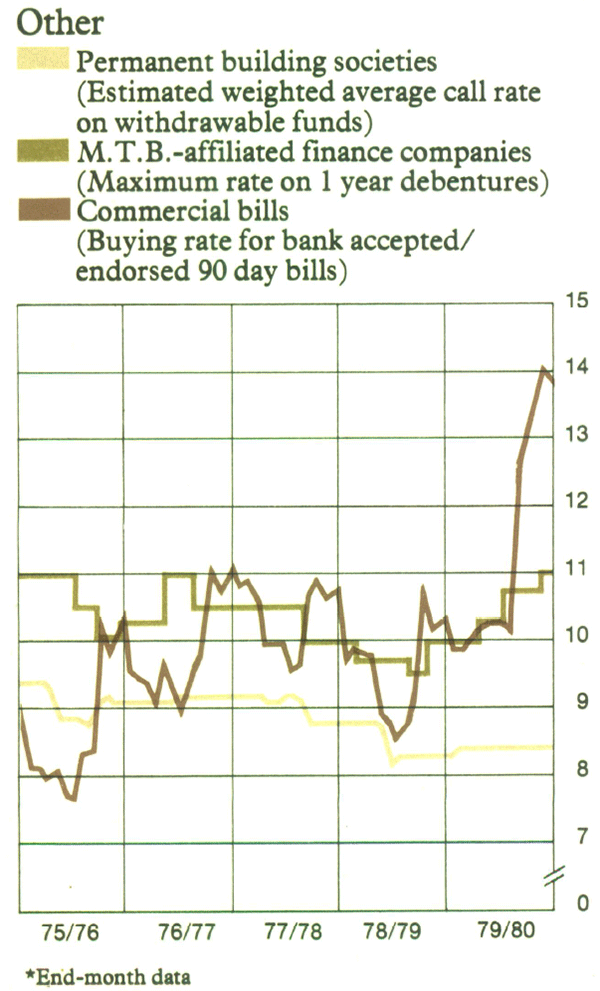
Interest rates in Australia rose over 1979/80. A major influence was the increase in overseas rates. In the closing months of the year, the upward pressure from external factors diminished, particularly following the very sharp fall in interest rates in the United States. Seasonal pressures kept short-term rates in Australia fairly high and, for longer rates, domestic inflationary pressures and the prospect of heavy demand for funds for projected capital expenditures appeared to have a strong influence.
Both public and private sector interest rates rose over the year. The increases in interest rates on government securities were outlined in the previous chapter. Most of this movement took place in the second half of the year; by the end of the year, the yield on two-year bonds had risen by about 1.5 per cent, and on ten-year bonds by 1.7 per cent. Yields on semi-government securities rose by about 1.8 per cent. Yields on both 13-week and 26-week Treasury notes rose in December and, after steadying for a couple of months, moved higher. Towards the end of the year, yields at tender were between 10.5 and 11.0 per cent.
Most banks raised interest rates on larger overdrafts by 0.5 per cent over January/February and by a further 1.0 per cent in April. This brought the rate charged by banks on most large loans to prime borrowers to around 12.5 per cent. Increases of 0.5 per cent in rates charged on smaller overdrafts took place over March/April. This brought the rate to 10.5 per cent – the maximum banks were permitted to charge on these loans. Interest rates on housing loans from trading banks and savings banks moved up 0.5 per cent in early April and by a further 0.5 per cent in July to reach 10.5 per cent, again the maximum permitted on these loans.
Building societies in four States increased rates paid on call deposits by 0.5 per cent during the year. Interest rates paid by societies on term investments rose in all States, by up to 1.5 per cent. Rates charged on loans rose by up to 0.75 per cent; at the end of the year, the interest rates on housing loans by building societies mostly were in the range of 11.0 to 12.5 per cent. Finance company borrowing rates at year-end were on average 1.0 to 1.5 per cent higher than at end-June 1979. Yields on bank accepted/endorsed bills rose by around 3.5 per cent over the year.
Government Financing
The deficit of the Commonwealth Budget was $2,029 million in 1979/80. This compared with the August estimate of $2,193 million and an outcome in the previous year of $3,478 million.
A much smaller part of the deficit was financed by overseas borrowings in 1979/80. Over the year, net overseas raisings amounted to $187 million compared with $1,349 million in the previous year. The components of the domestic financing were: net sales of Commonwealth Government securities, $302 million; borrowing from the Reserve Bank and use of cash balances, $1,135 million; and other financing transactions, $405 million. Of the $302 million net sales of securities, $205 million was accounted for by Treasury notes and $174 million by Savings Bonds and Special Bonds; there were net redemptions of $77 million in respect of Treasury bonds and other public loans. In the previous year, domestic financing had come mainly from the sale of bonds (including Australian Savings Bonds) and Treasury notes, with each contributing about $1,000 million.
Banks increased their holdings of government securities by $262 million compared with an increase in holdings of $873 million in the previous year. The contribution to Commonwealth Government financing by non-bank groups was $775 million, about the same as in the previous year. The Reserve Bank contributed $679 million compared with $378 million in the previous year.
The deficit of the total public sector in 1979/80 was about $5,000 million; this compared with a deficit of about $5,500 million in 1978/79. Besides the Commonwealth Government financing transactions noted above, the public sector deficit was financed by increased borrowings under the Loan Council programmes and some reduction in cash balances. The larger semi-government and local authorities borrowed about $2,000 million in 1979/80, some 15 per cent more than in 1978/79. The smaller authorities borrowed about $460 million, up 10 per cent on 1978/79.
The Share Market
Share prices climbed steadily during the first half of 1979/80, apart from a dip in November. This steady climb was followed by a sharp jump over January and early February, with the Sydney ‘all ordinaries’ index reaching a peak of 947 on 14 February; this was 28 per cent above the level at end-December and 64 per cent above the level at the start of the year. The increases over these months were associated with increased capital inflow and high commodity prices. Share prices fell over the second half of February and over March, but later increased again. The ‘all ordinaries’ index closed the year at 904, up 56 per cent on the figure a year earlier.
Against the background of buoyant share trading and prices, new equity issues increased very strongly. For the year as a whole, the value of equity issues announced rose by 177 per cent after a rise of some 30 per cent in 1978/79.
FINANCIAL GROUPS: SELECTED LIABILITIES
2. Financial Intermediation
Most domestic financial intermediaries faced a strong demand for finance in 1979/80; total loans outstanding increased by about 15 per cent over the year. The intake of funds by these financial institutions increased a little less quickly than their lending. Accordingly, for most institutions, the ratio of liquid assets to deposits at the end of the year was lower than twelve months earlier.
Deposits and Borrowings
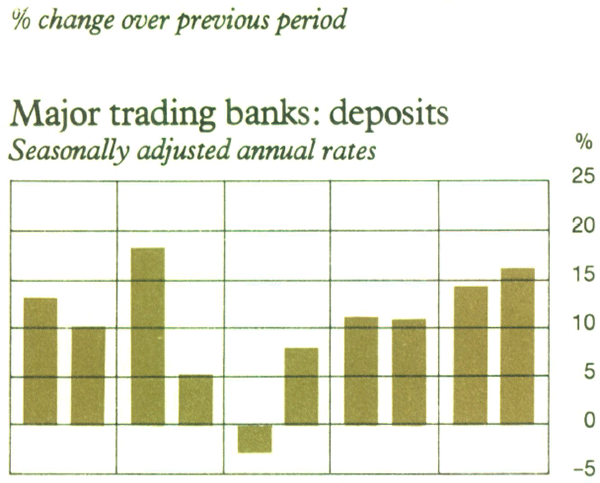
Deposits of major trading banks increased by 15.7 per cent in 1979/80 compared with 11.4 per cent in the previous year. The banks made large issues of certificates of deposit during much of the year. There was a strong demand for funds to finance the sharp increase in lending and the banks' ability to attract funds via fixed deposits was restricted by the interest rate ceiling on these deposits. Yields at which certificates of deposit were issued moved up beyond the 10 per cent level (which is the maximum rate banks may pay on fixed deposits) in October/November and then rose to over 13 per cent in the June quarter. Certificates of deposit comprised 10.9 per cent of total deposits at the end of the year compared with 1.1 per cent at the end of the previous year. Fixed deposits fell by 3.2 per cent over 1979/80 compared with a rise of 9.2 per cent in the previous year. Current deposits rose by 13.1 per cent, somewhat more slowly than in the previous year.
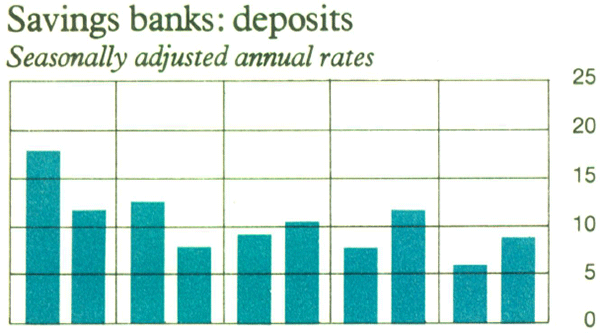
Savings bank deposits increased by 7.2 per cent in 1979/80; this was slower than the 9.9 per cent increase in 1978/79. Deposits in investment accounts increased by 6.9 per cent and other deposits increased by 7.4 per cent.
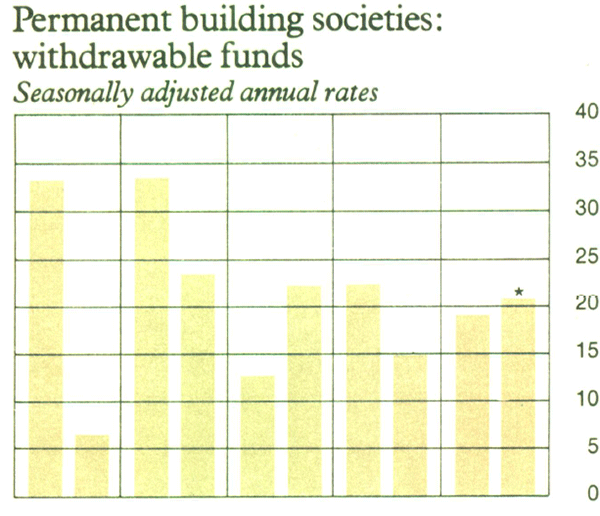
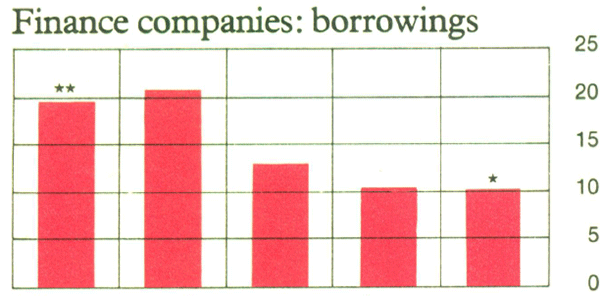
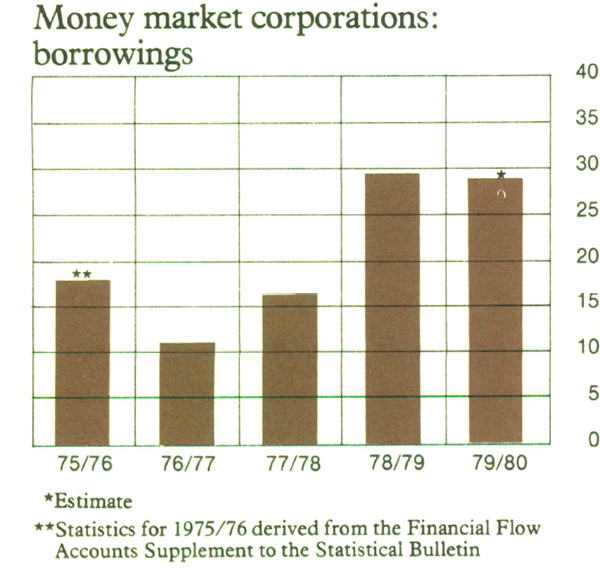
The withdrawable funds of permanent building societies continued to grow rapidly. The increase during 1979/80 was about 20 per cent; this followed a rise of 19 per cent in the previous year. Borrowings by finance companies increased by about 10 per cent in 1979/80, the same as in the preceding year. Borrowings by money market corporations expanded strongly – by around 30 per cent – in 1979/80; this followed a rise of 29 per cent in the previous year.
Lending
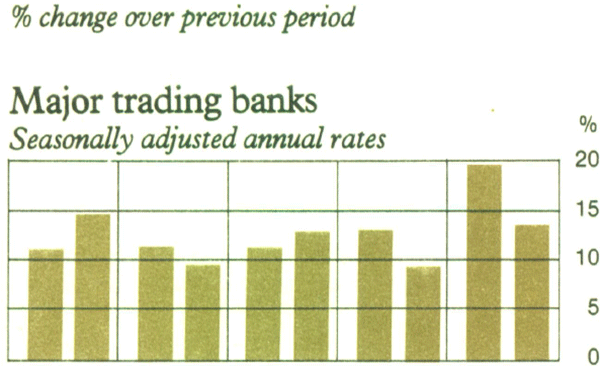
Loans, advances and bills discounted by major trading banks increased by 16.7 per cent in 1979/80 compared with 11.3 per cent in 1978/79. A substantial factor in the sharp rise in the latest year was the increase in the usage of overdrafts; overdraft balances outstanding increased by 14.6 per cent during the year. Lending to consumers was high; Bankcard outstandings increased by 22.1 per cent, and personal instalment loans by 22.2 per cent. Term and farm development loans were up 19.3 per cent. Holdings of commercial bills were little changed over the year.
MAJOR TRADING BANKS: LIQUIDITY AND LENDING

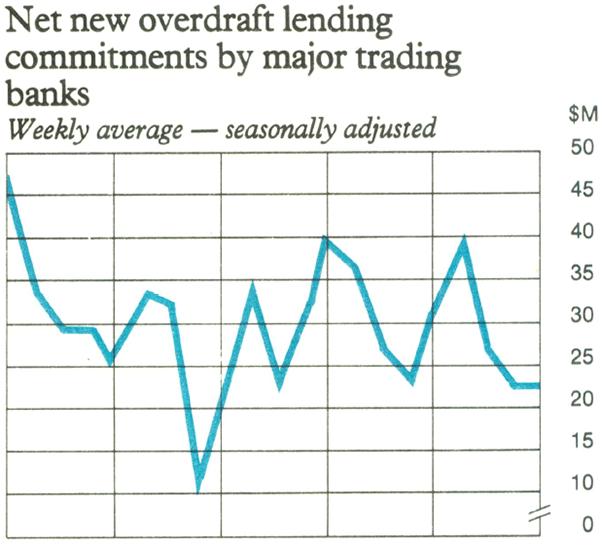
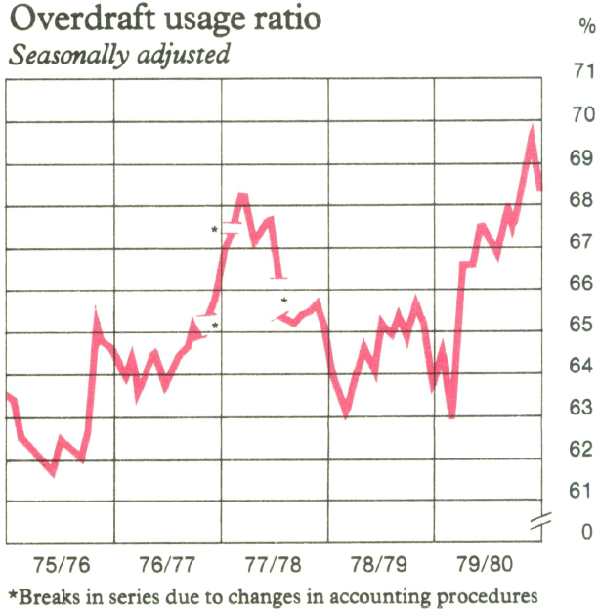
The percentage of overdraft limits used rose substantially over September/October,remained at a high level through to the start of the June quarter, and then rose further to end the year at about 70 per cent – up 5 percentage points on a year earlier. New overdraft approvals ran strongly during the first half of the year but later were more subdued and, over the year, averaged $28.6 million per week, about the same as in the previous year. The figures for the first and second halves of 1979/80 (on a seasonally adjusted basis) were $34.1 million and $23.1 million respectively.
There was very rapid growth in banks' commercial bill limits during 1979/80. Discount limits grew by 85 per cent to $2,889 million, and acceptance/endorsement limits grew by 22 per cent to $5,419 million. Financing of the Australian Wheat Board created some bulky movements in these limits within the year, but over the full year their net impact was not great.
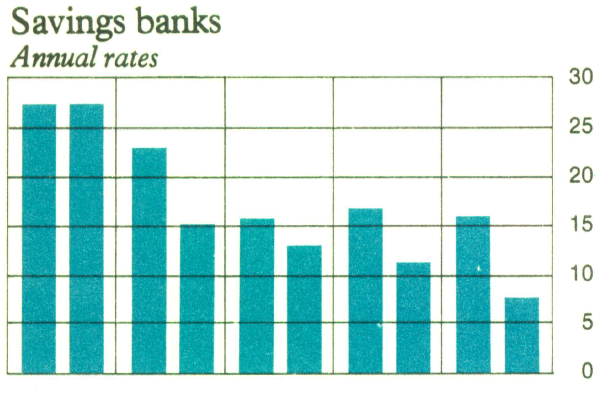
Advances outstanding of savings banks increased by 11.9 per cent in 1979/80 compared with 14.2 per cent in 1978/79. Most of this increase was in housing loans which, at June 1980, represented 51.1 per cent of deposits. The proportion of loan approvals that went to new dwellings rose slightly (to about 30 per cent) after falling in the previous two years.
Permanent building societies increased their loans outstanding by 16.2 per cent in 1979/80, slightly less than in the previous year. Lending fell early in the year following a reduced inflow of funds towards the end of the year before, but recovered strongly over the last three quarters. The proportion of loans going to new houses fell slightly to a little under 30 per cent.
Lending by finance companies increased at a relatively slow pace; the increase for the year was about 11 per cent. Consumer demand for certain types of finance was depressed and there was strong competition from banks in personal finance. Leasing finance was the only component tending to show much growth.
Advances of money market corporations continued to grow strongly in 1979/80; over the year they increased by about 24 per cent. This followed an increase of 34 per cent in the previous year.
Liquidity
The liquidity of the major trading banks in 1979/80 was lower than in 1978/79; for most of the year, the LGS ratio was some two percentage points below its level in the corresponding period of the preceding year. The ratio reached a seasonal peak of 25.3 per cent in February and fell to a low of 18.9 per cent in June.
FINANCIAL GROUPS: ADVANCES OUTSTANDING
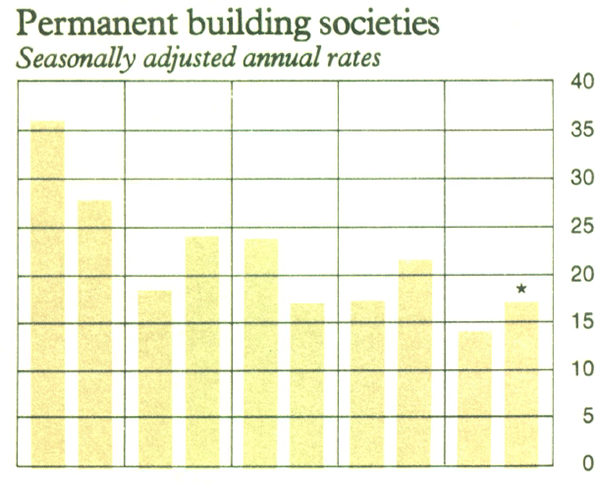
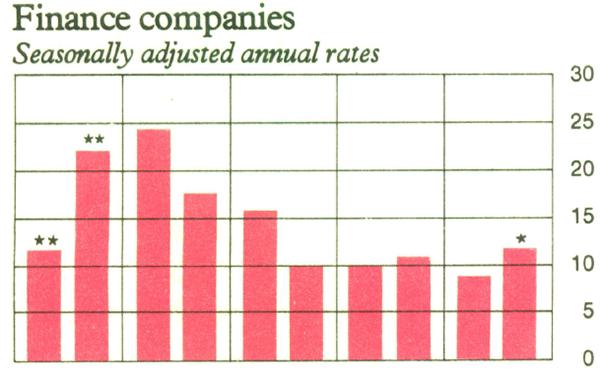
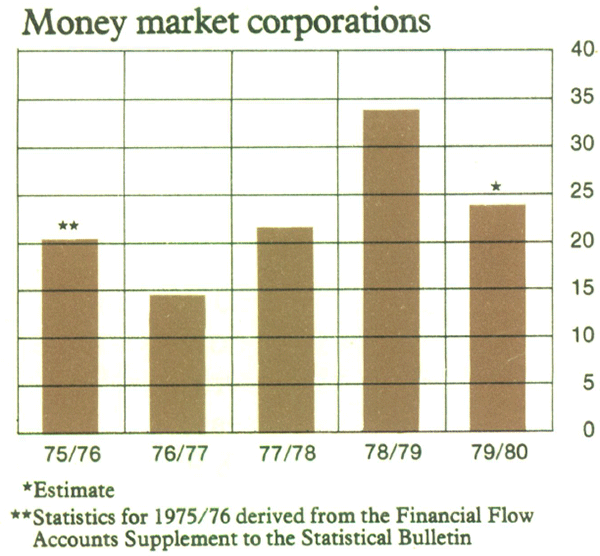
The proportion of savings bank deposits invested in liquid assets and public sector securities continued to fall in 1979/80; at end-June 1980, it was 47 per cent compared with 50 per cent a year earlier.
For most of 1979/80, permanent building societies' holdings of liquid assets (broadly defined) tended to be a little lower than in the previous year. At the end of the year, holdings were equal to about 17 per cent of borrowings.
3. Institutional Developments
The Bank of Adelaide/ANZ Merger
As noted in last year's Report, arrangements for the merger of The Bank of Adelaide with Australia and New Zealand Banking Group Limited (ANZ) were set in train in the closing months of 1978/79. In October 1979, The Bank of Adelaide shareholders approved the scheme for the merger. The scheme was approved by the Supreme Court of South Australia the following month.
Proposal to Establish a New Bank
In April 1980, the Treasurer announced that the Government had been approached by Australian interests regarding the establishment of a new bank. While a formal application had not been made at that stage, the matter had been the subject of considerable consultation with the Government.
Under existing Government policy, it is open to domestic interests to apply for authority to carry on banking business. Such an application needs to comply with the Government's foreign investment policies and with the requirements of the Banks (Shareholdings) Act. This Act limits the amount of voting shares of a bank in which an individual holder may have an interest to 10 per cent of the bank's voting shares. The granting of an authority would require also that the Government consider the applicant suitable for the holding of such an authority. A successful applicant would, of course, be required to comply with existing policy requirements.
Arrangements for Marketing Commonwealth Securities
During 1979/80 arrangements for marketing Commonwealth securities were changed. From 19 December, the arrangement whereby Treasury notes were continuously on sale at pre-determined prices was replaced by a system of weekly tenders for named amounts of notes, with the Reserve Bank acting as agent for the Commonwealth.
In a tender, the minimum bid is for $100,000 face value and bids may also be for any multiple of $5,000 face value above that figure. Bids are accepted from persons or organisations eligible to hold Treasury notes in the form of inscribed stock who have registered with the Bank. Notes are allotted in ascending order of yield. Under these arrangements, the authorities influence directly the amount of Treasury notes sold.
Changed arrangements for the sale of new bonds – the tap system – came into effect on 30 April 1980. Under this system, securities are available in one or more maturities on a more or less continuous basis. This system contrasts with the past practice of issuing bonds through periodic cash loans. Concurrently with the tap system, the Reserve Bank conducts market operations through its own bond portfolio. The changed system for issue of new bonds gives the authorities more flexibility in adjusting the quantity of securities issued and the maturity spread of the securities.
Details announced when a new tap stock is introduced are: the maturity; the coupon rate; the indicative amount of the stock to be issued; and the price and yield to apply on the first day of the issue. Subsequently, prices and yields are available daily from the Reserve Bank. The minimum subscription to tap stocks is $5,000 face value and subscriptions may be for any multiple of $1,000 above that figure.
Along with the introduction of the tap system for selling Treasury bonds, there were also changes in arrangements for marketing of local and semi-government securities. Under the changed arrangements, maximum interest rates for these securities are set by reference to the yield on Treasury bonds of relevant maturities. Generally, an announcement is made each Friday evening of the maximum rates to apply in the following week although, when appropriate, variations in rates will be made at other times.
Deposit Insurance for Permanent Building Societies
In February 1980, the Treasurer announced that the Government had endorsed a framework for a private industry-based scheme for the insurance of deposits with permanent building societies. Under the scheme, building societies would establish and fund a national insuring corporation. The corporation would have power to borrow or to arrange stand-bys and lines of credit from normal commercial sources and would have discretion to arrange liquidity support for insured societies which may be experiencing temporary losses of liquidity. Although it was envisaged that participation in the scheme would be voluntary, State Governments would, if they so wished, be able to make participation mandatory in their own State.
Currency Futures Trading Facilities
In January 1979, the Treasurer stated that the Government had no objection to the establishment of currency futures trading facilities in Australia; however, non-resident participation in local markets, and arbitrage transactions by residents involving overseas markets, would not be permitted. An inter-company currency hedge market had been in existence for some years; an inter-bank currency hedge market commenced operations in June 1979. Sydney Futures Exchange Limited began trading in currency futures in March 1980 with contracts denominated in United States dollars and Japanese yen. All settlements in these markets are in Australian dollars. Participation is not restricted, as in the official market, to dealings which cover foreign exchange risks arising from trade transactions.
Australian Resources Development Bank
With the Resources Bank well established and operating with a diversified funds base, the Reserve Bank terminated its participation in the provision of temporary bridging loans to the Resources Bank from the end of September 1979. The Reserve Bank had provided temporary bridging loans to the Resources Bank since its establishment in 1967.
As from 1 February 1980, the Australian Banks' Export Re-Finance Corporation, ABERC, previously owned by the major trading banks which are also the shareholders of the Resources Bank, became a wholly-owned subsidiary of the Resources Bank. As a result, the Resources Bank now funds refinance loans through ABERC to assist the trading banks in providing extended term finance for Australian exports of capital goods and services.
Following the takeover of ABERC by the Resources Bank, the Reserve Bank terminated, from 31 January 1980, a loan facility of $6 million which had been available to that corporation from its establishment in 1964.
Committee of Inquiry into the Australian Financial System
As outlined in last year's Report, a Committee of Inquiry was established early in 1979 to inquire into and report on the structure and methods of operation of the financial system and on the regulation and control of the system. During 1979/80 the Committee received written submissions and held public hearings at which parties were given the opportunity to elaborate their views.
The Bank's submission to the Committee comprised twelve papers. The first six were submitted in June 1979. They were descriptive papers, intended to provide a convenient body of information. A further six papers were submitted later in 1979; they contained discussion of selected issues in the Bank's policy areas. Copies of the twelve papers submitted by the Bank have been made available to the public as Occasional Paper No. 7. The Bank has also taken part in the seminars conducted by the Committee.
The major points in the Bank's second set of papers to the Committee are summarised on the next page.
The Bank's Submission to the Committee of Inquiry: Major Points
The second set of papers contains discussion of a number of current policy issues including the relationship of monetary policy to general economic management; the role of direct regulation of banks and other financial intermediaries; conditions for the stability of financial intermediaries; foreign exchange (including exchange control) arrangements in Australia; and the entry of new banks into the Australian system including as a special case, foreign entrants. The Bank's papers were designed primarily to explain present practices and underlying considerations. The object was to provide a factual ‘platform’ for the Committee's examination of the issues.
While the papers made few explicit proposals for change, an underlying judgment is that in the conduct of monetary policy market operations are generally more effective than direct controls. However, there can be constraints on the use of market operations. Moreover, to ensure efficient and timely influence on bank lending (without excessive fluctuations in interest rates), it seems unavoidable that banks should continue to observe some form of asset ratio, variable for monetary policy purposes. Concern for the stability of the banking institutions points that way also. Other direct controls, particularly on bank interest rates, might more easily be relinquished.
Severe practical difficulties would beset general extension of asset ratios to the numerous and varied non-bank financial corporations registered under the Financial Corporations Act. While this implies some discrimination against banks, maintenance of full public confidence in banking liabilities requires that they accept some burdens; benefits as well as burdens flow from their special position.
Substantial evolution took place in foreign exchange arrangements in Australia in the 1970s. Present arrangements appear to be working reasonably well and it is not evident that changes would of themselves confer significant national benefits in present conditions. This is not to say that foreign exchange practices in Australia should not undergo further evolution; desirably, changes should be timed to accord with periods of relative stability in markets.
There have been no new entrants into the general trading banking area in Australia over the past 50 years: indeed, consolidation has been the trend. This reflects a dearth of interest in a banking authority from domestic sources though market forces cannot be ignored. It also reflects the attitude of successive governments to overseas ownership of banks in Australia. If present policy on overseas ownership were relaxed, it would be important from the central bank's point of view to ensure that the effectiveness of monetary policy was not diminished or financial stability impaired. Development of criteria to assess and to queue entrants into the industry would be necessary.