Reserve Bank of Australia Annual Report – 1995 Developments in Financial Intermediation
This chapter comments on some recent developments in the provision of credit to the private sector by financial intermediaries in Australia. Credit is defined here as the sum of loans and advances provided by financial intermediaries and bank bills outstanding. Banks as a group typically account for around 80 per cent of this credit. Changes in total credit, and in its main components, in recent years are shown in the following table.
Credit to the private sector
(Twelve-months-ended percentage change)
| June 1989 | June 1990 | June 1991 | June 1992 | June 1993 | June 1994 | June 1995 | |
|---|---|---|---|---|---|---|---|
| Housing | 20.2 | 9.9 | 7.7 | 12.6 | 18.6 | 22.7 | 15.8 |
| Personal | 16.0 | 8.8 | 0.1 | −5.2 | −0.6 | 3.5 | 10.1 |
| Business | 22.3 | 12.0 | 0.1 | −6.0 | −4.6 | −0.8 | 5.3 |
| Total | 21.0 | 11.1 | 1.8 | −1.4 | 2.2 | 7.3 | 9.7 |
Total credit grew at a moderate rate in 1994/95 but its composition was rather different from that in the two preceding years. Lending for housing, which grew by over 20 per cent in 1993/94, began to slow down from about September 1994. Although new loan approvals declined, the outstanding stock of housing loans continued to expand, albeit at a slower rate. In the six months to June 1995, housing credit outstanding grew at an annual rate of 12 per cent, compared with 20 per cent in the preceding six months. On the other hand, lending for business and for personal purposes has picked up over the past year. In the six months to June 1995, personal lending grew at an annual rate of about 12 per cent, the same as for housing lending. Lending for business, after contracting over a long period, showed positive growth throughout 1994/95, growing at an annual rate of around 6 per cent over the second half.
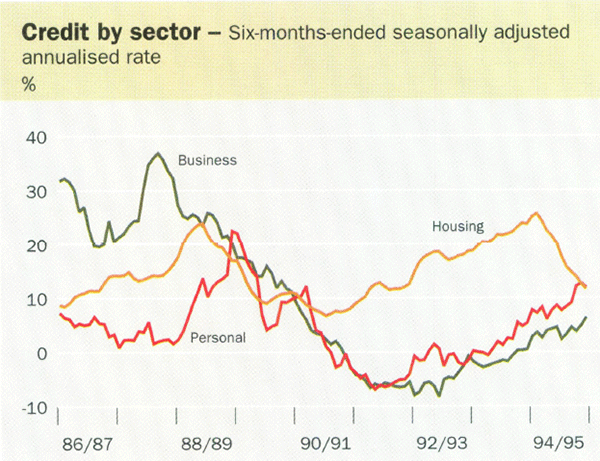
On the other side of intermediaries' balance sheets, deposits grew slightly faster in 1994/95 than in the previous year. This saw M3 and broad money rise by 6.9 per cent and 7.5 per cent, respectively – rates which were broadly in line with the growth in nominal GDP. The lower growth rates for these monetary aggregates, relative to that for credit, reflected the strong capital positions of the banks, which allowed them to fund a higher proportion of their lending from capital.
Lending to households
The slowing in lending for housing during the year reflected the turning of the housing cycle, after the extremely strong upswing of the previous few years, reinforced by the tightenings in monetary policy in the second half of 1994. Looking over a longer run of years, an important structural change has occurred through the large increase in lending for housing and the corresponding change in household balance sheets. In contrast to the late 1980s, over recent years households have been increasing their gearing while businesses have been reducing theirs.
The strong growth in borrowing for housing is attributable to both demand and supply factors. On the demand side, the fall in interest rates since early in 1990 produced levels of housing affordability not previously enjoyed during the era of deregulated financial markets. This has encouraged households to take on more debt. At the same time, given the sharp lift in house prices towards the end of the 1980s, and the relatively modest growth in household incomes since, borrowers have had to rely more heavily on debt to acquire a home.
On the supply side, banks have been keen to lend for housing, particularly given the absence of demand from the business sector and the relatively high profitability of housing loans. Not only were existing banks encouraged to expand their lending, but competitors from outside the industry entered the field. In the past year in particular, several life offices and specialised mortgage originators backed by wholesale banks not directly involved in retail lending have begun to make their presence felt.
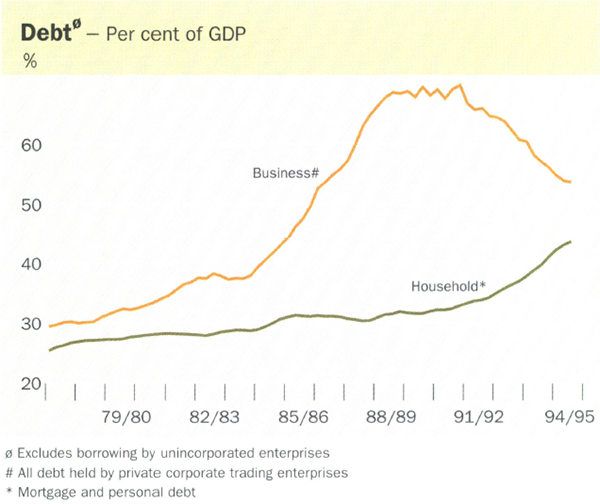
These developments have contributed to a significant increase in the ratio of housing debt to household disposable income. This ratio has been on an upward trend for many years but that rise has become more pronounced in recent years. In the 13 years from 1977 to 1990 the ratio rose from 24 per cent to 33 per cent, but by March 1995 it had risen to 53 per cent. The ratio of housing debt to the value of residential houses and land is a much smaller figure, but it too has risen markedly over the past five years – from around 10 per cent in 1990 to around 15 per cent in March 1995. (These seemingly low figures reflect the fact that some 40 per cent of dwellings are owned outright, and many more have small outstanding mortgages.)
The rise in aggregate mortgage indebtedness reflects an increase in the average size of loans and an increase in the number of households with mortgages. Aggregate mortgage interest repayments relative to household disposable income are now slightly higher than in 1990, but the growth in the number of households with loans means that the repayment burden on a typical loan is less than it was in 1990. On average, the burden of the increase in the size of loans has been more than offset by the lower mortgage interest rates prevailing now compared with 1990.
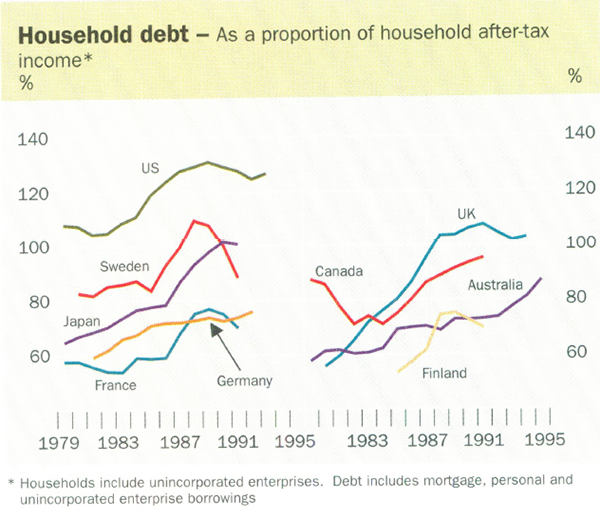
When borrowing for personal purposes – currently about one-third that of borrowing for housing purposes – is added in, the growth in household indebtedness is less pronounced but still significant. On this broader measure of debt, the ratio of household debt to household disposable income has increased from 50 per cent in 1990 to 68 per cent in March 1995. Even so, Australian households remain less highly geared than households in a number of comparable industrial countries.
Lending to business
Business credit, which accounts for approximately half of total credit, has shown positive growth since early 1994, after three years of contraction. In structural terms, however, these three years of declining business debt levels, followed by 18 months of only modest growth in debt, have seen business balance sheets substantially repaired. The level of business credit outstanding at June 1995 was around 90 per cent of the level at December 1990, while business turnover, assets and profits were considerably higher. Through a combination of debt repayment, equity raising, profit retention and, until recently, low investment, the business sector has succeeded in greatly reducing its gearing. As gearing has declined and profits have risen, businesses have embarked on a new round of investment, and resumed borrowing from financial intermediaries.
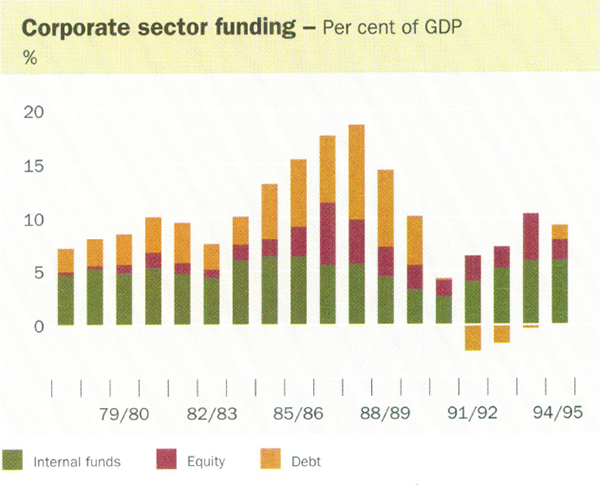
Internally generated funds are traditionally the main means of financing business investment. With healthy profits, augmented by capital raisings, it is not surprising, therefore, that the recent strong revival in investment has occurred with only modest growth in borrowing. In 1994/95, internal funds were equivalent to around 85 per cent of corporate investment. This is a high proportion by the standards of the 1980s – when debt was relatively much more important – but it is not unusual by the standards of the 1960s and 1970s. Consistent data for business sector leverage are not available, but the stock of corporate debt to GDP gives one approximation. This has fallen from nearly 70 per cent in 1988/89 to 54 per cent in 1994/95. Interest cover, or the number of times profits cover interest payments, has roughly doubled over the same period, from 2½ to 5 times. Both these indicators are suggestive of much healthier business balance sheets than in the late 1980s.
Implications for monetary policy
What implications do these balance sheet changes have for the way monetary policy operates?
Monetary policy is usually viewed as operating through changes in interest rates affecting interest-sensitive expenditure decisions, and through the exchange rate. These channels as such are not much affected by developments of the kind described earlier in this chapter. But another important channel is the interaction between spending behaviour and the balance sheet positions of both households and businesses, commonly called the “cash flow” effect. This channel is affected by balance sheet positions. As firms and households become more highly geared, their ability to service borrowings – even for viable projects – becomes more limited, and their non-interest expenditure is likely to be constrained by their cash flow. In these circumstances, the effect of a given interest rate increase becomes greater; as debt servicing pre-empts a higher proportion of earnings, other expenditures have to be trimmed.
This “cash flow” channel is most easily understood in relation to the business sector, which is a “deficit” sector in the sense that its interest payments traditionally exceed its interest receipts by a substantial margin. With the jump in corporate leverage in the 1980s, corporate cash flows became much more sensitive to changes in nominal interest rates. In 1988 and 1989, for example, many firms found themselves squeezed by rising interest payments, even before they felt the impact of falling sales. If anything, the potency of monetary policy was enhanced in those conditions. On the other hand, the sensitivity of cash flow to changes in monetary policy appears to have been moderated in the early 1990s as corporates concentrated on reducing their debt levels.
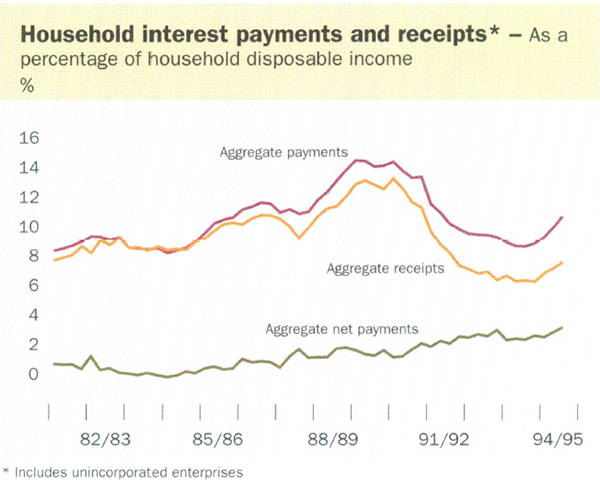
It is sometimes claimed that monetary policy has a much weaker effect on the household sector, and could even have a perverse effect. Such claims are based on a view that households as a group constitute a “surplus” sector, with an excess of financial assets over debt, and interest receipts in excess of payments. On this view, an increase in interest rates generates net income for the household sector and therefore facilitates higher, rather than lower, spending. This reasoning, however, is fallacious for at least two reasons:
- The household sector is only in surplus if shares, unit trusts and superannuation are included. It is in deficit so far as direct holdings of interest-bearing assets are concerned; it makes net payments of interest equivalent to about 3 per cent of household income. A rise in interest rates will, therefore, reduce the cash flow of the household sector, the more so as household indebtedness rises.
- Household expenditure data show that the net receivers of interest tend to be either high-income earners or retirees. Net payers of interest, on the other hand, tend to be concentrated in the middle income range and to have large mortgages, so that they have little choice but to reduce their spending in some areas when interest rates rise.
Other factors are also at work which are likely to make households more sensitive to interest rate rises. One is the change from a high to a low-inflation environment. In the former, even when high inflation rates were matched by high interest rates, there was a tendency over time for loan repayments to fall away in real terms as wages increased strongly, although the nominal value of the debt remained the same. This effect – often referred to as “front loading” – meant that borrowers could expect the burden of debt to be diminished over time by ongoing high rates of inflation. In a low-inflation environment, however, the real repayment burden will not diminish much over time, making borrowers more sensitive to interest rate increases during the life of a loan.
Another factor with potentially similar effects is the advent of “honeymoon” loans, where the interest rate is initially low before reverting to the standard variable loan rate after a year or so. If, during this initial period, the variable rate has also risen, the actual step-up in interest payments could be quite large, with possibly significant implications for other expenditures by the households affected. In practice, however, many borrowers who take “honeymoon” loans opt to make repayments based on the standard variable loan interest rate from the outset, effectively taking the benefit in the form of higher repayments of principal. Moreover, in their own interests, as well as those of their customers, banks and other lenders will generally test the capacity of prospective borrowers to adequately service loans at interest rates some margin above current levels.
One spin-off of the recent period of low inflation is the spread of fixed-interest loans, most commonly with maturities of three to five years. Borrowers with existing loans of this type are able to avoid the squeeze on cash flow which occurs when monetary policy is tightened, and to that extent, the impact of changes in monetary policy will be dampened. So far, however, this has not loomed as a major factor, given that new housing loans with rates fixed for two or more years still represent only 10 to 15 per cent of the total.
Intermediaries' interest rates
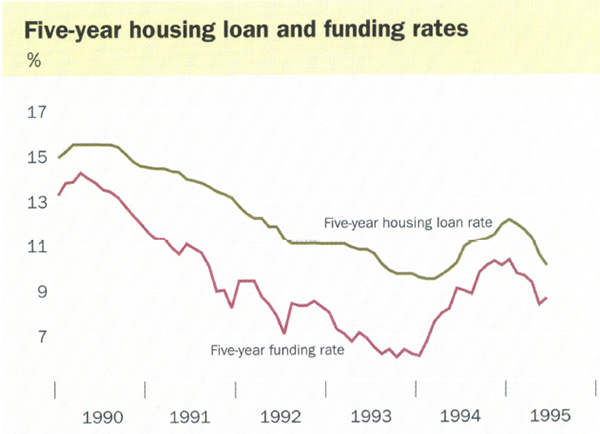
The cash rate was raised by 2.75 percentage points over 1994/95 but interest rates charged by banks on business and housing loans rose by about 1 percentage point less. This outcome mainly reflected the fact that bank deposit rates did not rise by as much as cash rates. There was also a slight contraction in the margin between the average cost of funds to the banks and their average loan rate; the former rose by 2 percentage points over the year, the latter rose by a little less.
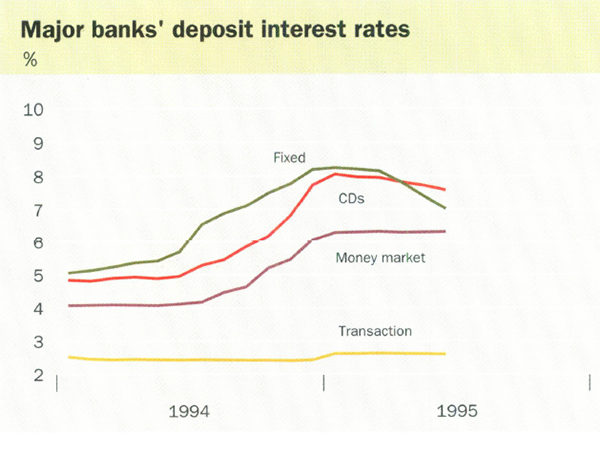
Banks collectively receive about 25 per cent of their total deposits through transactions accounts (such as current accounts, passbook, investment savings and pensioner deeming accounts) which earn low rates of interest. The average interest rate paid on these deposits rose from 2.4 per cent in June 1994 to 2.6 per cent in June 1995. No interest at all is paid on a further 8 per cent of bank deposits. Interest rates paid on money market accounts, however, increased broadly in line with the cash rate; the average rate paid rising from around 4 per cent to 6½ per cent over the year. Interest rates on certificates of deposit and fixed-term deposits also followed money market security yields.
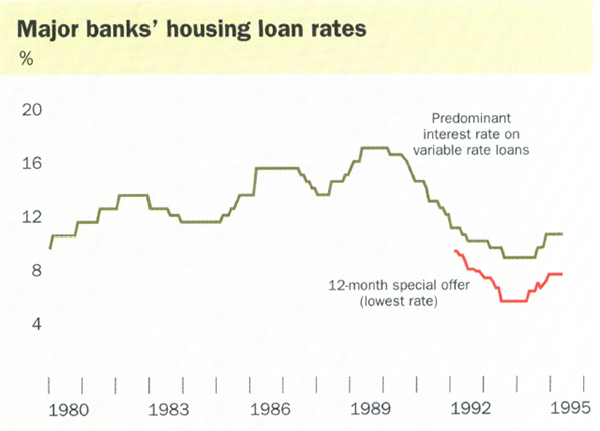
On the lending side, the standard variable-rate housing loan rose by 1.75 percentage points over the year, to 10.5 per cent. Special deals incorporating substantial discounts for the first year of the loan were again offered to new borrowers. Some borrowers also opted for fixed-rate mortgages, where the interest rate is fixed for three to five years on the basis of equivalent bond market yields. Margins on these loans are slimmer than for variable-rate loans, and by the end of the year, rates on most fixed-rate loans were under 10 per cent. Life offices and mortgage originators, which generally price their loans at a modest margin above the 90-day bill yield, added to the competitive pressures on banks, resulting in some narrowing of the margin between interest rates on standard variable-rate loans and short-term money market interest rates. Ongoing pressure from the newer entrants, and from the lower-cost banks, is likely to see a further narrowing of housing loan margins over time.
Interest rates on business loans rose by similar amounts as for housing loans, with the standard overdraft indicator rate rising by between 1.7 and 2 percentage points. At June 1995, the overdraft indicator rates of the major banks varied between 10.6 and 11.25 per cent. More banks now appear to be making greater efforts to attract small business borrowers. This is evidenced, for example, by offers of special deals to new borrowers, with discounts of around 2½ percentage points, and by the introduction of new types of loans, including capped-rate loans and loans which enable borrowers to fix the cost of drawdowns up to six months ahead.
Start-up finance is always a problem for very small businesses but for most established small and medium businesses access to finance is not currently a major problem. This conclusion comes through in different surveys of small businesses, and in the deliberations of the Reserve Bank's Small Business Panel, which met twice during the past year. In part, the improvement reflects greater efforts by banks, including several regional banks, to tap the small business market. It also reflects initiatives by governments, banks, small business organisations and other groups to improve communications between banks and their small business customers, including through educational programs. The improvement in cash flows resulting from generally good growth in profits, which reduced small businesses' reliance on external financing, was obviously another factor. A particular ongoing difficulty in the eyes of many Panel members is a reluctance of banks generally to lend for export activities because of the perceived additional risks involved.
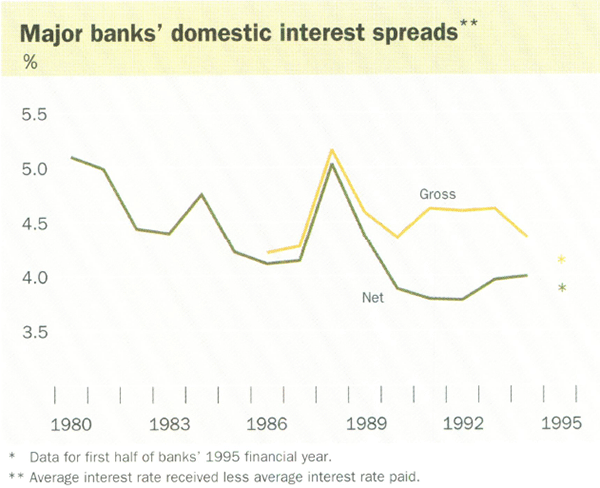
With loan interest rates increasing by a little less than deposit rates, there was a marginal decline in banks' net interest spread (the difference between average interest received and average interest paid). The latest figures available on spreads are for the half year ending March 1995. The average net domestic spread of the major banks in this period was 3.9 per cent, compared with 4.0 per cent in the banks' 1994 financial year. The gross domestic spread (which adjusts for the effect of interest forgone on non-performing loans) was 4.2 per cent in the latest half year, compared with 4.3 per cent in 1994.
