Reserve Bank of Australia Annual Report – 1995 Reserve Bank Earnings and Operations
Earnings
Monetary and banking policy objectives have primacy over profit maximisation in the Bank's operations. The Bank, however, holds a substantial volume of financial assets and, in the course of its operations, earns large profits in most years. Over the past decade, profits have totalled more than $21 billion; in 1994/95 they amounted to $1,772 million, compared with $1,508 million in 1993/94.
The Bank's profits have two components – “underlying” earnings, and the capital gains (and losses) realised on its holdings of securities and foreign exchange. Underlying earnings reflect the margin between the interest received on assets and the interest paid on liabilities, less the Bank's operating expenses. Bank assets consist almost entirely of Commonwealth Government securities (CGS) and gold and foreign exchange (GFE), the foreign exchange component of which comprises mainly fixed-interest securities of foreign governments denominated in foreign currencies. The Bank's liabilities include the large volume of currency notes on issue, on which no interest is paid. Underlying earnings depend mainly, therefore, on the level of interest rates in Australia and abroad, and on the size of the Bank's balance sheet. These earnings, which tend to be reasonably stable from one year to the next, amounted to $1,649 million in 1994/95.
|
Underlying earnings |
Realised gains & losses* |
Net operating earnings |
|
|---|---|---|---|
| 1985/86 | 1,292 | 1,371 | 2,663 |
| 1986/87 | 1,412 | 2,035 | 3,447 |
| 1987/88 | 1,508 | 18 | 1,526 |
| 1988/89 | 971 | −554 | 417 |
| 1989/90 | 1,248 | −153 | 1,095 |
| 1990/91 | 1,322 | 391 | 1,713 |
| 1991/92 | 1,516 | 1,038 | 2,554 |
| 1992/93 | 1,760 | 2,803 | 4,563 |
| 1993/94 | 1,556 | −48 | 1,508 |
| 1994/95 | 1,649 | 123 | 1,772 |
| Average | 1,423 | 702 | 2,125 |
| * The charge to earnings in 1993/94 when the market value of investments fell below cost (and the charges to provisions in the three years to 1989/90), are recorded here as capital losses. | |||
The other component of profits is determined by movements in interest and exchange rates, and fluctuates widely. Gains (and losses) arise in one of two ways. First, the capital values of domestic and foreign securities in the Bank's portfolio will change as interest rates change. When interest rates fall, for example, the value of securities in the Bank's portfolio rises, and vice versa. The net decline in bond yields over the course of 1994/95 generated realised gains for the year as a whole of $86 million in respect of actual sales of securities, as well as unrealised gains of $80 million; the latter returned the revaluation reserve for investments to surplus. This outcome contrasts with the previous year, when sharp rises in bond yields resulted in realised losses and pushed the reserve into deficit, requiring a charge of $676 million against that year's earnings.
Secondly, gains (and losses) can occur through changes in the Australian-dollar value of foreign-currency-denominated securities held in official reserve assets, as a consequence of exchange rate movements. If, for example, the Australian dollar falls against the currency in which securities are denominated, the value of those holdings in Australian dollars rises. Exchange rate gains and losses are realised when relevant official reserve assets are sold. In 1994/95, reflecting recent weakness in the Australian dollar, realised foreign exchange gains totalled $37 million; unrealised gains also occurred, increasing the surplus in the foreign currency revaluation reserve.
In summary, realised gains on the sale of financial assets totalled $123 million for the year. This brought the Bank's net operating earnings to $1,772 million, an increase of $264 million on the previous year.
The Bank's profits are paid to the Commonwealth Government, after any transfers to various reserve funds which the Bank maintains to deal with contingencies. These reserves have been built up in recent years to the point where they meet the target levels established by the Board and no additional transfers from 1994/95 earnings were sought. The amount of the interim payment to be made to the Government out of the Bank's current year earnings is a matter for determination during the course of 1995/96.
Reserve Bank profits and payments to Government
($ million)
|
Net operating earnings |
Transfers to reserves |
Balance available for Commonwealth |
Final payment from previous year |
Interim payment from current year |
Total payment |
|
|---|---|---|---|---|---|---|
| 1985/86 | 2,663 | 192 | 2,471 | 1,060 | 925 | 1,985 |
| 1986/87 | 3,447 | 793 | 2,654 | 1,546 | 1,055 | 2,601 |
| 1987/88 | 1,526 | 740 | 786 | 1,599 | 300 | 1,899 |
| 1988/89 | 417 | 277 | 140 | 486 | – | 486 |
| 1989/90 | 1,095 | 520 | 575 | 140 | 300 | 440 |
| 1990/91 | 1,713 | 210 | 1,503 | 275 | 400 | 675 |
| 1991/92 | 2,554 | 200 | 2,354 | 1,103 | 400 | 1,503 |
| 1992/93 | 4,563 | 750 | 3,813 | 1,954 | 600 | 2,554 |
| 1993/94 | 1,508 | – | 1,508 | 3,213 | – | 3,213 |
| 1994/95 | 1,772 | – | 1,772 | 1,508 | 200 | 1,708 |
| 1995/96 | 1,572 |
The Bank has little control over the external factors which can influence its earnings but it does have direct managerial control over some of its revenues and costs, including through:
- the way it manages international reserves;
- the terms on which it provides services to its customers; and
- the controls it exercises over its own operating costs.
Management of international reserves
(a) General considerations The Bank's portfolio of foreign currency assets is held primarily to fund transactions in the foreign exchange market. In keeping with this purpose, foreign currency reserves are invested only in assets of high liquidity and solid credit standing. In recent years, reserves have consisted almost exclusively of securities issued or backed by the governments of the United States, Japan and Germany.
Given that the Bank is only one of many investors in offshore markets, it has substantial discretion in managing its foreign currency assets, although it is always careful not to be a disruptive influence. The Bank uses this discretion to manage its exposures to potential movements in exchange rates and interest rates on overseas securities. Adjustments to the portfolio are made on a medium-term basis and can involve:
- adjustments to the currency composition of reserves;
- movements of funds among the various international markets in line with expectations of relative rates of return; and
- changes to the duration of securities held in individual markets in line with expected movements in yield curves.
The table below shows the absolute return on foreign currency holdings over recent years, as well as the rates of return on individual portfolios measured in relevant denominations. All returns are measured on a mark-to-market basis, consistent with the general practice in the funds management industry. Returns here include interest income and both realised and unrealised gains and losses. This is different from the basis used to calculate the earnings shown in the Bank's accounts, which exclude unrealised gains and losses.
Returns on international reserves
|
Absolute return |
Rate of return (per cent) |
|||
|---|---|---|---|---|
| $A million |
US assets (US$) |
Japanese assets (Yen) |
German assets (DEM) |
|
| 1991/92 | 1,698 | 8.8 | 10.7 | 9.8 |
| 1992/93 | 1,461 | 5.2 | 7.5 | 13.4 |
| 1993/94 | 581 | 2.8 | 4.2 | 5.3 |
| 1994/95 | 727 | 6.0 | 3.1 | 6.3 |
Total returns on the Bank's holdings of foreign investments recovered somewhat in 1994/95 from the low levels of the previous year when they were depressed by capital losses associated with rising security yields. Rates of return on both the US dollar and German mark portfolios increased but those on yen holdings fell.
In keeping with market practice, the contribution of the Bank's management of international reserves is assessed by comparing actual returns with those on a benchmark portfolio. This benchmark portfolio has characteristics which would enable it to meet the Bank's objectives for liquidity, credit risk and long-term return. In mid 1994, the Bank commissioned an external review of its benchmark portfolios to test their conformity with best practice. This review was completed in September 1994 and confirmed that the methodology employed by the Bank met its objectives and was free of any significant biases.
The current benchmarks, and the ranges within which investments are managed, are as follows:
Benchmarks for foreign currency assets
|
US dollars |
Yen |
European currencies |
|
|---|---|---|---|
| Currency and asset composition (% of total assets) |
|||
| – Benchmark | 40 | 30 | 30 |
| – Discretionary range | 20–60 | 10–50 | 10–50 |
| Duration (months) | |||
| – Benchmark | 12 | 30 | 30 |
| – Discretionary range | 0–18 | 0–36 | 0–36 |
The table below shows actual returns compared with those on the benchmark over the four years for which the Bank has actively managed its portfolio of international reserves.
|
Rates of return (in SDRs) (per cent) |
Value of difference between actual and benchmark returns |
||
|---|---|---|---|
| Actual | Benchmark | ($A million) | |
| 1991/92 | 9.8 | 8.9 | 165 |
| 1992/93 | 16.3 | 11.6 | 420 |
| 1993/94 | 4.0 | 3.8 | 31 |
| 1994/95 | 5.2 | 7.4 | −331 |
The return in 1994/95 was below the return which could have been earned on the benchmark portfolio. This followed three years of performances above benchmark. Last year's underperformance occurred in the second half of the year and resulted mainly from a fairly conservative approach, particularly in regard to US and Japanese investments. Given the uncertainty regarding the outlook for the US economy, and the low levels to which long-term yields in Japan had fallen, the Bank decided to hold a relatively high proportion of its investments in very short-term securities which were subject to limited price risks.
In the event, this cautious approach proved to be unwarranted. As the US economy slowed, bond yields in that country fell sharply over the first half of 1995, resulting in substantial capital gains. Because of its low holdings of longer-term bonds relative to the benchmark, the Bank did not benefit to the same extent as the benchmark from this fall in yields. Similarly, bond yields in Japan continued to fall sharply in the first half of 1995, notwithstanding the low levels they had already reached by the end of 1994. Yields on 10-year bonds in Japan ended the year at 2.7 per cent, around record lows.
Some of the underperformance also reflected the Bank's underexposure, relative to the benchmark, to the rising yen in the first half of 1995. As the yen strengthened through this period, to levels which were judged to be beyond what could be justified by Japan's economic and financial position, the Bank reduced its holdings of yen. With the yen continuing to strengthen, this meant that its portfolio began to underperform the benchmark. While the underperformance could have been reduced by buying back yen, the Bank did not believe such purchases could be justified from a longer-term perspective. The fact that the Bank of Japan was consistently selling yen in the market through this period to stem its rise was another consideration; the Bank is careful to avoid activities in overseas financial markets which might complicate the operations of host central banks.
(b) Gold The Bank's holdings of gold totalled approximately 250 tonnes, valued at $4.3 billion, at 30 June 1995. Gold-lending activities by the Bank expanded further over the year, with the quantity on loan increasing to 64 tonnes; the number of counterparties involved increased from 10 to 12. Earnings on gold loans amounted to $6.0 million in 1994/95, a rise of $0.9 million on the previous year, reflecting both an increase in outstandings and some improvement in margins.
Customer services
Through its network of capital-city branches, the Bank provides a range of banking, registry and settlement, note issue and cash distribution services. The Bank aims to recover fully the costs of its banking, registry and some specialised cash distribution services through fees and charges. No charges are made for note issue, wholesale note distribution or the processing of notes for quality control purposes; these are viewed as public services.
Faced with continuing advances in technology and ongoing competitive pressures, the Bank has sought to improve the quality of its customer services and associated systems. To this end, it has made significant investments in electronic data-processing systems and pursued best practice in its operational areas.
(a) Banking services Transaction-oriented banking services are provided to the Commonwealth Government (the Bank's principal customer), several State governments and government instrumentalities, and a number of overseas official institutions. The Bank continues to work closely with its government customers to improve cash management practices, especially through the development and installation of electronic banking services designed to raise the efficiency of payments and collections systems. During 1994/95, several agencies began using the Bank's Government Direct Entry System (GDES) to collect revenues through direct debiting of payers' nominated bank accounts – the Australian Taxation Office now collects payroll and company taxes through direct debit; the Australian Customs Service collects excise payments and import duties from its agents through direct debit; and the Department of Social Security is collecting overpayments of some pensions by this method. Efficiency gains have again enabled the Bank to reduce its total charges to the Commonwealth for banking services, notwithstanding an increase in the volume of transactions processed.
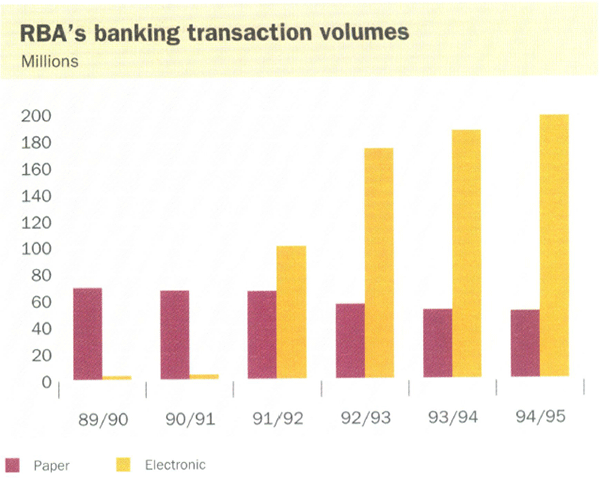
Credit transactions processed through GDES increased by 6 per cent, to 198 million, during 1994/95. As in the previous year, this amounted to approximately 50 per cent of all bulk electronic credit payments exchanged among financial institutions in Australia. Additional payments incorporated into GDES during the year related to the Home Child Care Allowance and Drought Relief.
The Bank's financial EDI (electronic data interchange) facility processed 83,400 transactions, about 26 per cent more than the previous year. This service allows Commonwealth departments to settle commercial transactions electronically with customers of the Commonwealth Bank. The Department of Finance also uses the system to make interagency payments and disbursements from the Commonwealth Government to the States. The Commonwealth has announced its commitment to settle a wider range of commercial transactions through the financial EDI facility and the Bank is well-placed to assist in meeting this commitment.
Advances in electronic systems and technology continue to impact on traditional banking arrangements, leading to further reductions in paper-based transactions processed by the Bank. In 1994/95, 51 million transactions were processed, down from 52 million in the previous year and 69 million five years ago. This trend is evident across the finance sector, with providers and users of financial services pursuing lower costs and greater efficiency through the increased use of electronic systems.
The number of customers using ReserveLink, the Bank's PC-based desk-top banking package, increased from 71 to 110 during 1994/95. This system, which allows customers to undertake a range of banking transactions from their offices, has been enhanced progressively to keep pace with the latest technology and changing requirements of customers. An upgraded version of the package was released during the year.
(b) Registry and settlement services Through its branch network, the Bank provides registry services for the Commonwealth Government, borrowing authorities of the governments of New South Wales, South Australia and Western Australia, and several other local and foreign official organisations. Services include maintenance of ownership records, issuance of securities, payment of interest and redemption of securities at maturity. Efficiencies resulting from the closer integration of registry counter services and back offices contributed to a 15 per cent reduction in the cost of registry services conducted for the Commonwealth Government last year.
Membership of the Reserve Bank Information and Transfer System (RITS) has grown strongly since it was introduced in August 1991, with 175 organisations now using the system to settle electronically their transactions in Commonwealth Government securities. The system handles over 96 per cent of turnover in the professional market, and has $88 billion of securities lodged in it.
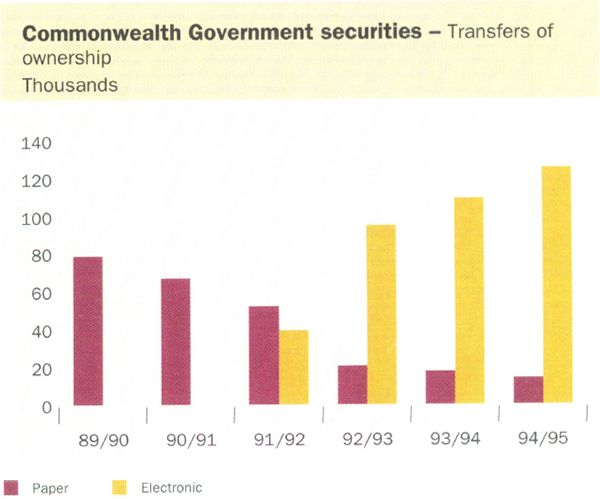
Other services provided by RITS include the automatic payment of interest and maturity proceeds in respect of securities held in the system; provision for members to make high-value loans, either unsecured or secured by mortgages over securities in RITS; and, for those members with accounts at the Bank, a capacity to make high-value payments. In 1994/95, RITS handled about 110,000 of these types of transactions. RITS members can also lodge bids electronically at tenders for Treasury bonds and notes and almost all bids are now lodged this way. Two new types of Treasury securities were introduced into RITS during the year, namely Treasury indexed bonds and Treasury adjustable rate bonds.
A new RITS facility has been developed for simultaneous settlement of interbank obligations arising from the settlement of equity and other transactions on the Australian Stock Exchange's electronic settlement facility, CHESS; this is scheduled to begin operation in March 1996.
As noted earlier, the Bank is proposing to expand RITS to provide for the settlement of transactions in State government and private sector debt securities which are now settled on Austraclear's FINTRACS system. This combined system would form the basis of a real-time gross settlement (RTGS) system, enabling all high-value payments undertaken electronically in Australia to be settled across banks' Exchange Settlement Accounts at the Reserve Bank.
The Bank acts as National Collator for the Australian Payments Clearing Association. In this role, the Bank receives by fax daily from each bank details of obligations arising from transactions in each clearing stream; it collates these data and calculates the net amount owed to or by each bank for settlement to Exchange Settlement Accounts on RITS at 9 am the next morning. The Bank is proposing to streamline these information flows by using direct electronic communications links.
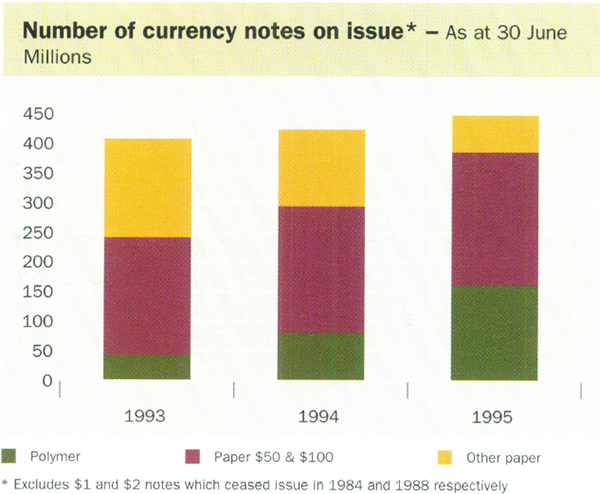
(c) Note issue and cash distribution The value of notes on issue grew by 5.5 per cent in 1994/95, compared with 7.4 per cent in the previous year. Higher denomination notes continue to dominate, with the $50 and $100 notes together accounting for 85 per cent of the total value of notes on issue. In terms of numbers of notes, some 490 million pieces were on issue at end June 1995, much the same as a year earlier. The $50 note continued to account for about a third of the total, followed by the $20 and $100 notes (both around 18 per cent).
Value of notes on issue
($ million)
|
At end June |
$1 |
$2 |
$5 |
$10 |
$20 |
$50 |
$100 |
Total |
Increase (per cent) |
|---|---|---|---|---|---|---|---|---|---|
| 1991 | 43 | 73 | 249 | 679 | 2,048 | 5,345 | 6,356 | 14,793 | 14.0 |
| 1992 | 42 | 71 | 261 | 585 | 1,836 | 5,724 | 6,660 | 15,180 | 2.6 |
| 1993 | 42 | 70 | 297 | 591 | 1,813 | 6,284 | 7,269 | 16,367 | 7.8 |
| 1994 | 21 | 69 | 313 | 634 | 1,795 | 6,837 | 7,907 | 17,577 | 7.4 |
| 1995 | 20 | 49 | 332 | 614 | 1,848 | 7,193 | 8,482 | 18,538 | 5.5 |
During 1994/95, the Bank continued to increase the efficiency of its currency operations. A major step was the installation of a new computerised accounting and administration system to streamline the distribution of cash to banks and other customers. Productivity in used-note processing remained at high levels; about 1.4 billion notes were processed, of which about 85 per cent were re-issued and the remainder destroyed.
Polymer notes
The release of the new polymer $20 note – the third in the new series – commenced on 31 October 1994. A new polymer $50 note is planned for release later in 1995. It will be similar in basic colouring to the paper $50 and will feature David Unaipon, an Aboriginal inventor, and Edith Cowan, the first woman elected to a parliament in Australia. The series will be completed with the release of a polymer $100 note in the first half of 1996; Dame Nellie Melba and Sir John Monash will be featured on that note.
The need to replenish stocks of the $5 note provided an opportunity to incorporate some improvements into that note at minimal cost. A more brightly coloured $5 note was issued in April 1995 to help avoid possible confusion with the $10 note; some other changes were also made.
The special technologies embodied in polymer notes are enhancing the security and durability of Australia's currency notes. Research aimed at ongoing improvements is continuing into both the security and handling characteristics of polymer notes.
The Bank's administration
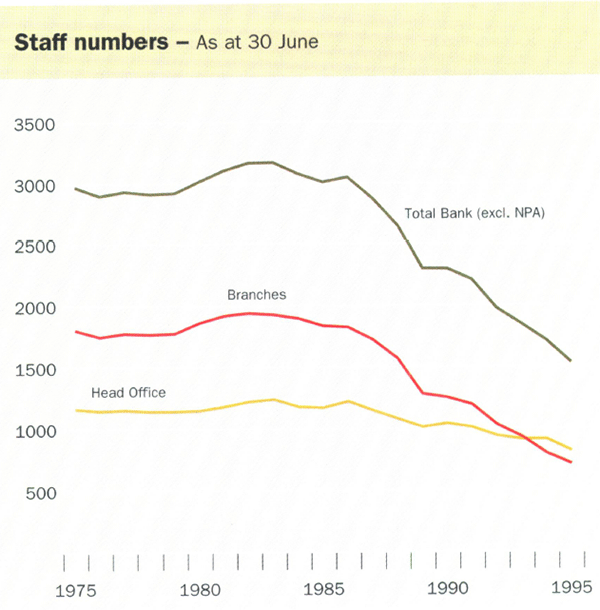
(a) Staffing Staff numbers in the Bank (excluding Note Printing Australia) fell a further 10 per cent during 1994/95, to 1532. This represents a halving of numbers since 1985, the reduction having been implemented mainly through a series of voluntary redundancy and early retirement programs. In recent years, the largest adjustments have occurred in the Bank's eight branches, with clerical/processing positions in the registry, settlement, clearing and cash-handling areas most affected. Although branch staff numbers declined again in 1994/95, the main adjustments in the past year were in Head Office administrative support areas, where numbers fell by over 15 per cent. Ongoing adjustments to staff numbers can be expected as new technologies are adopted and responsibilities change, but the major restructuring process of the past several years has now run its course.
In a climate of tighter resourcing, improving the quality of staff remains an important priority. Expenditure on training continues at a high level, supported by an active program of study assistance, external secondments and in-house courses. Graduate and specialist recruitment programs are adding to skill levels. The Bank also has trained about 100 young people under the Australian Government Traineeship scheme, many of whom have subsequently joined the Bank's staff. In part because of increased natural attrition, the Bank re-entered the market for base-level recruits in early 1995, the first time in almost five years.
(b) Operating costs In nominal terms, the Bank's “underlying” operating costs (which exclude the lumpy expenditure on voluntary redundancy offers – VROs) have fallen by 1 per cent over the five years since 1989/90. This implies a significant reduction in real terms.
Operating costs
($ million)
| 1989/90 | 1990/91 | 1991/92 | 1992/93 | 1993/94 | 1994/95 | |
|---|---|---|---|---|---|---|
| Staff costs# | 118.0 | 117.8 | 116.4 | 112.3 | 111.7 | 108.0 |
| Other costs* | 51.9 | 62.6 | 68.6 | 68.7 | 67.7 | 59.6 |
| “Underlying” operating costs | 169.9 | 180.4 | 185.0 | 181.0 | 179.4 | 167.6 |
| Cost of VROs | 22.3 | 3.7 | 18.8 | 2.7 | 9.8 | 18.1 |
|
# Excludes VROs and, in 1994/95, an additional charge to comply with new accounting
standard AAS30. * Includes premises and equipment (including depreciation), but excludes IMF maintenance of value payment. |
||||||
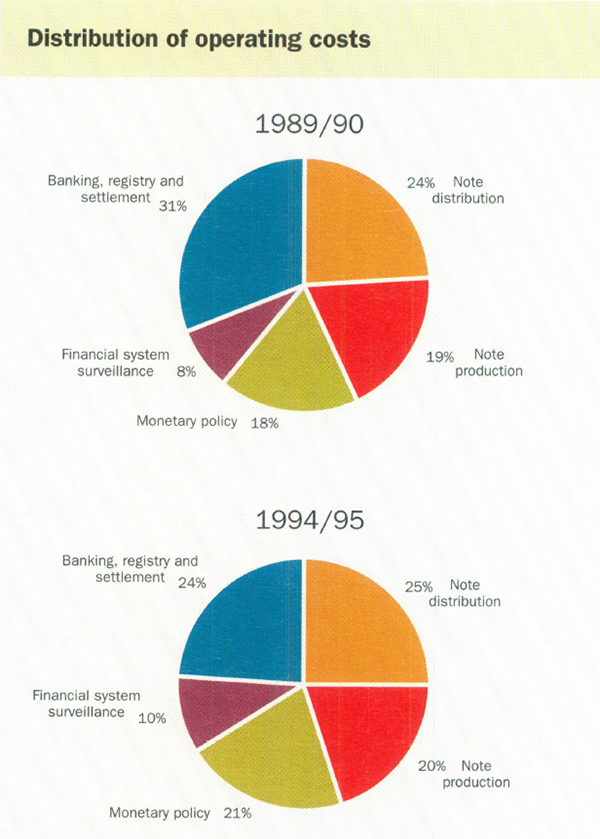
The distribution of operating costs across the Bank's main functions has changed over this period. The share accounted for by “core” functions – note distribution, monetary policy, and financial system surveillance – has risen from about 50 to around 56 per cent while the share for note production and “customer services” – banking, registry and settlement – has fallen. These changes reflect, in large measure, greater use of technology and a sharper commercial focus in the Bank's business areas, as well as the loss of some banking business, all of which have contributed to staff reductions in those areas.
Cost containment remains a priority in the provision of customer services, especially in those areas where the Bank competes with private-sector suppliers. “Corporate” (or internal support) services have been subjected to the same scrutiny, in part to help reduce the burden of overhead costs on the business areas. To this end benchmarks are being developed to encourage best practice in several activities, such as information technology, energy management and property services.