Bulletin – September 2017 Finance The Neutral Interest Rate
- Download 534KB
Abstract
Central banks monitor the neutral interest rate for a number of reasons, a key one being that it provides a benchmark for assessing the stance of monetary policy. This article describes the determinants of the neutral interest rate and discusses its trends in Australia over recent decades. We estimate that Australia's neutral interest rate has declined by 150 basis points since 2007 and is currently around 1 per cent. However, because we cannot observe the neutral rate directly, there is considerable uncertainty around these estimates. The fall over the past decade is largely attributable to a decline in the economy's potential growth rate and an increase in risk aversion of households and firms.
The Neutral Interest Rate and its Relevance for Monetary Policy
Real policy interest rates in Australia and other developed economies have declined over recent decades. Cyclical factors have clearly played a role, particularly in recent years. But even after accounting for cyclical influences, the real policy rate required to bring about full employment and stable inflation over the medium run – known as the neutral interest rate – appears to be lower now than in the past.[1]
Central banks, including the Reserve Bank of Australia (RBA), monitor the neutral interest rate for a number of reasons. The neutral interest rate provides a benchmark for assessing the current stance of monetary policy.[2] If the real policy rate – that is, the cash rate less expected inflation – is below the neutral rate, then monetary policy is exerting an expansionary influence on the economy. If the real policy rate is above the neutral rate, then monetary policy is exerting a contractionary influence on the economy. Estimates of the neutral interest rate can also be useful for understanding issues such as whether monetary policy has become more or less effective over time.[3]
In this article we describe the determinants of the neutral interest rate, set out alternative methods for inferring the level of the neutral interest rate in Australia, and discuss factors that may have contributed to changes in the neutral interest rate over time.
Determinants of the Neutral Interest Rate
In a small open economy like Australia, both domestic and international developments influence the neutral interest rate. To understand the determinants of the neutral interest rate, however, it is clearest to consider first the case of a closed economy that has neither trade nor financial dealings with the rest of the world.
In a closed economy, all investment must be funded by domestic saving. The neutral interest rate equates saving and investment at the level of income that is consistent with full employment and stable inflation. Accordingly, most explanations of the neutral interest rate start with factors that influence the amount of saving or investment in the economy. Developments that increase saving will tend to lower the neutral interest rate; developments that increase investment will tend to raise the neutral interest rate.
Many determinants of savings and investment, and therefore the neutral interest rate, tend to evolve quite slowly and hence we should expect the neutral interest rate to change only gradually. One example is the economy's potential growth rate. In an economy with a high potential growth rate, perhaps because of strong productivity or population growth, expectations of increases in future demand create a strong incentive for firms to invest. At the same time, the prospect of future income growth reduces the incentives of households to save. Both of these forces will tend to raise the neutral interest rate.
Besides population growth, another aspect of demography that can influence the neutral interest rate is the age structure of the population.
An increase in the share of the population who are of working age – who typically have a higher propensity to save than the young or old – would be expected to lower the neutral interest rate. Similarly, because high-income earners tend to have a greater propensity to save, an increase in income inequality could also lower the neutral interest rate.
Institutional arrangements and regulatory changes can also influence the neutral interest rate. For example, a financial liberalisation that relaxes household borrowing constraints could temporarily reduce saving, and raise the neutral interest rate, as households transition to a higher steady-state level of leverage. A shift from a largely public pension scheme to a model where individuals self-insure against longevity risk may entail a higher saving rate if individuals are unable to take advantage of private risk pooling. This would lower the neutral interest rate.
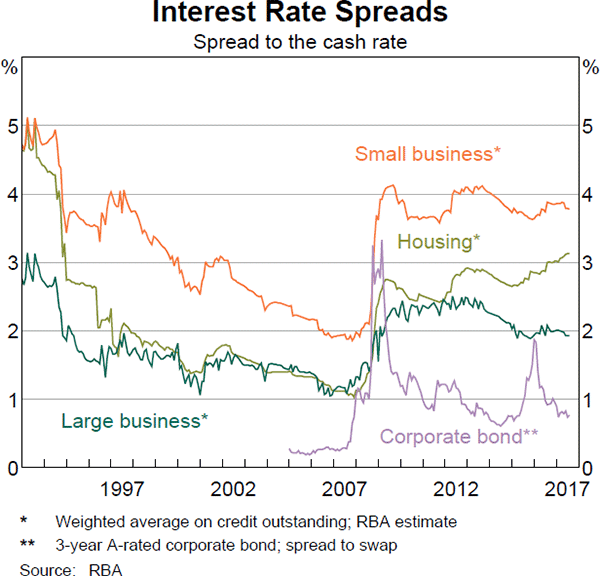
Another influence on the neutral rate that has attracted attention in recent times is the risk appetite of firms and households and the way risk is priced into market interest rates. This influence can move more rapidly than other determinants. When risk aversion rises, for any given cost of borrowing, firms are less willing to make long-term investments with an uncertain return.[4] At the same time, households are less willing to borrow against future income to fund current consumption. These developments will lower the neutral interest rate. Greater risk aversion is also likely to coincide with an increase in investor preferences for safe assets. One consequence of this is a widening in the spreads between the policy rate and the market interest rates that determine the behaviour of households and firms. A given market interest rate will correspond to a lower policy rate if spreads widen. Given that the neutral interest rate is defined in terms of the real policy rate, this will also lower the neutral interest rate.
In an open economy, where capital can move reasonably freely across borders, global interest rates will influence domestic interest rates. This means that, over the medium run, trends in overseas productivity growth, demographics and risk appetite will affect the neutral interest rate in Australia. It also means that changes in the domestic determinants described above will affect Australia's neutral rate by less than they would if Australia were a closed economy. As an example, consider an increase in trend productivity growth in Australia. This would be expected to raise the Australian neutral interest rate and investment returns more broadly. The higher returns on offer will increase the attractiveness of Australia for foreign investors. This, in turn, will lead to greater capital inflow and a wider current account deficit. At the same time, greater capital inflow will cause an appreciation of the exchange rate, reducing the international competitiveness of Australian firms and putting downward pressure on investment returns in Australia. In this way, an increase in productivity growth in an open economy will lead to a smaller increase in the neutral interest rate than in a closed economy, together with movements in the current account and the exchange rate.
Empirical estimates point to similar trends in neutral interest rates across advanced economies. This suggests that for small open economies, international influences play a large, perhaps dominant, role. On the other hand, trends in determinants of the neutral interest rate, such as demographics and productivity growth, tend to be highly correlated across advanced economies. This makes it hard to distinguish between international influences and domestic influences that are common across economies.[5]
Estimating the Neutral Interest Rate for Australia
The neutral interest rate is not directly observable, so we must infer its value from the behaviour of market interest rates and other economic variables. We describe the results from two methods of estimating the neutral interest rate: a model-based approach and one that estimates the neutral interest rate based on financial market prices.
Model-based estimates
Our first measure of the neutral interest rate infers its value from the behaviour of interest rates, economic activity, the unemployment rate and inflation. Other things being equal, when the real policy rate is above its neutral level for a period of time, monetary policy should be exerting a contractionary influence on the economy. That is, the unemployment rate should rise, and the inflation rate should fall. Similarly, when the real interest rate is below its neutral level, monetary policy should be exerting an expansionary influence and the pace of economic activity should pick up.
To move beyond this stylised description of how monetary policy works and derive quantitative estimates of the neutral interest rate, we require a model that describes how real interest rates affect the economy and a method to update our estimates of the neutral rate using observable information from the model.
Our model consists of three key equations (for more details, see Appendix A).[6] The first is an investment-savings (IS) curve that relates the output gap – the level of real GDP relative to its potential level – to lagged values of the output gap and the gap between the real policy rate and the neutral interest rate. The second is an Okun's law relationship that maps the output gap to the gap between the unemployment rate and the non-accelerating inflation rate of unemployment (NAIRU). The third is a Philips curve that translates deviations of the unemployment rate from the NAIRU into inflation.
In addition, the model features equations for unobserved variables, including the trend growth rate of potential output, the NAIRU and the neutral interest rate. The equation for the neutral interest rate links its value to the trend growth rate of output plus an unexplained component that accounts for all other factors that influence the neutral interest rate, such as risk aversion or demography. We do not model these additional determinants of the neutral interest rate explicitly. The baseline assumption is that they will stay constant in the next period.
We use a statistical technique known as the Kalman filter to determine how much to revise our estimates of the neutral interest rate in response to surprises in observable variables. For example, if the level of output is lower than the model would have expected, a possible explanation is that the stance of monetary policy is less expansionary than previously thought.[7]
In response, we might lower our estimate of the neutral interest rate.
Graph 1 presents the model's estimate of the neutral interest rate, as well as an indication of the degree of uncertainty around these estimates. The solid line shows the central estimate – the model's best guess of the neutral interest rate at each point in time. The shaded area shows the one standard deviation probability interval around the central estimate. The model suggests that there is a 68 per cent probability that the neutral interest rate lies within the shaded area.[8]
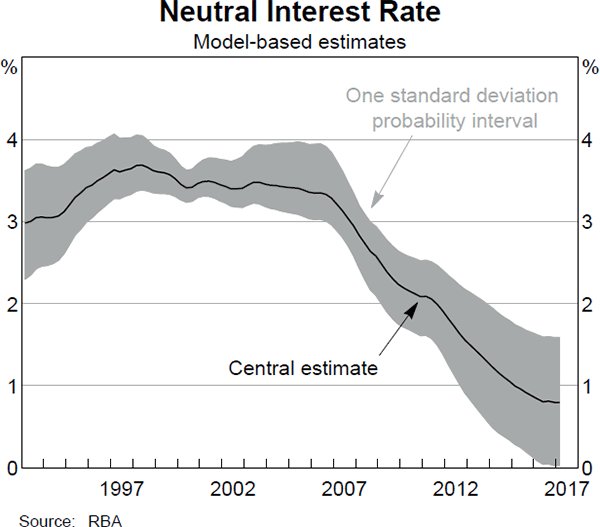
The estimated neutral interest rate was fairly stable at around 3½ per cent from the early 1990s until 2007. Since then, the estimated neutral interest rate has declined steadily and is currently around 1 per cent. Although there is some uncertainty around the precise level of the neutral interest rate at any point in time, even the upper bounds of the confidence bands are currently below 2 per cent.[9] That is, the model points to a high probability that the neutral interest rate has declined over the past decade.
A concern with any model-based estimate is that it may be sensitive to the assumptions that went into constructing the model. To gauge the robustness of our results, we also estimated two alternative models. The first eliminates the Okun's law relationship from the model, as is common in models used to estimate the neutral interest rate in other advanced economies. The second includes import prices as an additional observable variable influencing inflation, as is common in other empirical models of inflation in Australia. Reassuringly, the neutral interest rate estimates from these alternative models align closely with the estimates from the baseline model. We use estimates from all three models in the model-combination exercise described below.
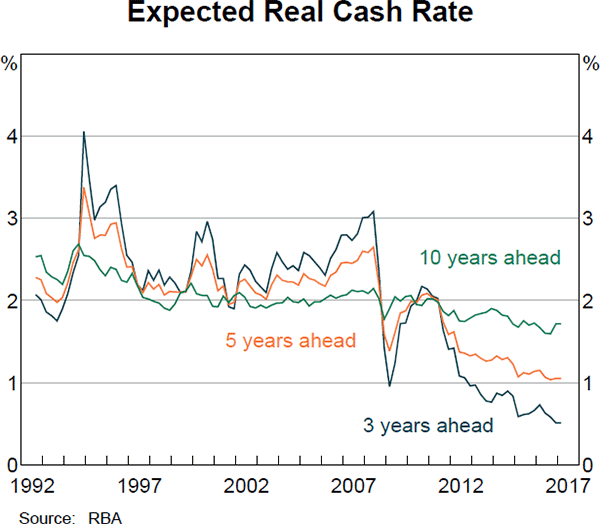
An alternative approach to estimate the neutral interest rate is to use expectations of future short-term real interest rates implied by financial market pricing on the assumption that real interest rates should return to their neutral level over time as the economy returns to equilibrium.[10] Graph 2 shows three alternative estimates of the neutral interest rate, which are the expected short-term real interest rates three, five and 10 years in the future as implied by yields on inflation-indexed government bonds. Financial market estimates of the neutral interest rate are generally lower than model-based estimates for the 1990s and 2000s. However, they also point to a large fall in the neutral interest rate since the mid 2000s and estimate it currently to be around ½ to 1½ per cent, which is consistent with the model-based estimates.
All methods of estimating the neutral interest rate have shortcomings and choosing the most appropriate measure is, to a large extent, a matter of judgement.[11] A pragmatic approach is to maintain and monitor a range of indicators. To the extent that alternative measures produce similar estimates of the level and changes in the neutral interest rate, we may have some confidence in the message they provide.
Graph 3 compares the ex post real cash rate – the cash rate deflated by year-ended trimmed mean inflation – to the different estimates of the neutral interest rate described above. The line labelled ‘mean’ is the average of the available estimates at each point in time. This is our preferred estimate of the neutral interest rate. The shaded area shows the range between the highest and lowest estimates. The average of the estimates declined from 3 per cent in the early 1990s to be around 1 per cent currently. Most of the decline has occurred since 2007. The range of estimates currently spans ½ per cent to 1½ per cent. The highest estimate of the neutral interest rate at present is below the lowest estimate prior to 2007. Although we are uncertain about the level of the neutral interest rate at any point in time, we can be fairly confident that it is lower now than in the past.
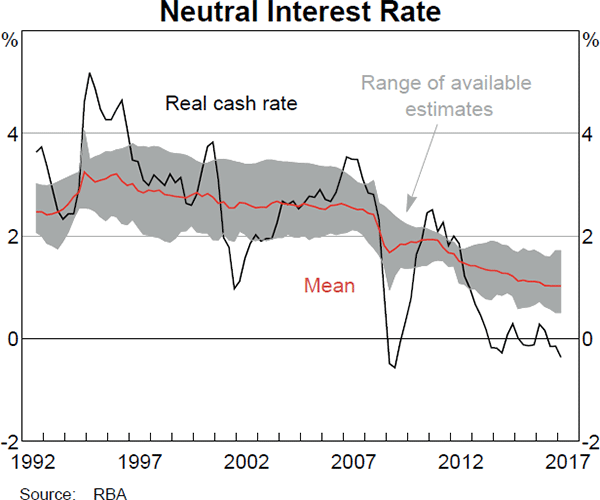
The relationship between the ex post real policy rate and the neutral interest rate corresponds to standard accounts of the conduct of Australian monetary policy during the inflation-targeting era.[12] During the tightening phases of the mid 1990s and mid 2000s, monetary policy was clearly exerting a contractionary influence on the economy, while in the immediate aftermath of the global financial crisis, monetary policy helped to stimulate economic activity. All of the available estimates suggest that the stance of monetary policy is currently expansionary.
Comparison with international estimates
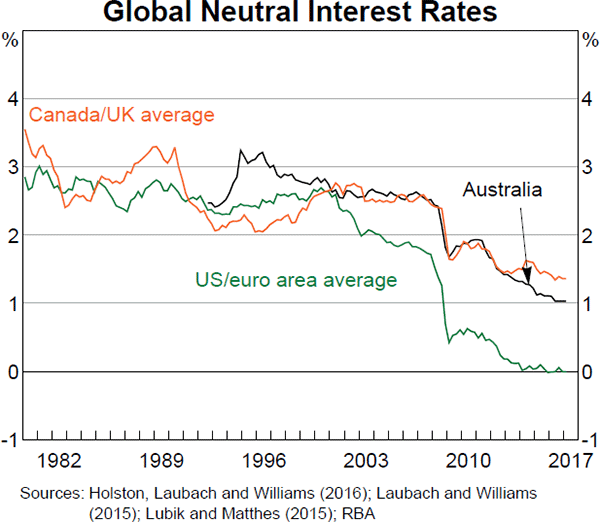
The fall in the estimated neutral interest rate in Australia mirrors similar declines in other advanced economies. Graph 4 compares the average estimate of Australia's neutral interest rate with a range of international estimates. For most of the economies, estimates of the neutral interest rate were reasonably stable through the 1990s, but have declined since 2007. The size of the estimated fall in Australia's neutral interest rate is similar to that of Canada and the United Kingdom, but smaller than the estimated declines in the United States and the euro area. However, given the uncertainty inherent in these estimates, we would caution against reading too much into this divergence.
What Can Explain the Decline in the Neutral Interest Rate?
Our estimates point to a fall in Australia's neutral interest rate of around 150 basis points since 2007. Most of this decline can be explained by a decline in potential growth and an increase in risk aversion that, in part, has manifested itself in a widening in spreads between the policy rate and market interest rates. To the extent that these developments coincided with related developments overseas, this helps to account for the similar trends in Australian and overseas neutral interest rates over the past decade.
As well as estimates of the neutral interest rate, the neutral interest rate model used here also produces estimates of Australia's long-run potential growth rate. These suggest that potential growth has declined by around ½ percentage point since the mid 1990s.[13] Many economic models suggest that a one percentage point decline in the economy's potential growth rate should correspond to a similar decline in the neutral interest rate. This suggests that around 50 basis points of the decrease in the neutral interest rate can be attributed to slower potential output growth.
Across many advanced economies, the risk appetite of firms and households has diminished over the past decade.[14] One indication of this is that firms are investing less than one might expect given the outlook for demand and financing (Kent 2014). Another indication has been through a widening of spreads between market interest rates and the cash rate. Although there is some heterogeneity across measures, most borrowing spreads in Australia have widened by 100 basis points or more (Graph 5).[15] Changes in spreads should have a roughly one-for-one effect on the neutral interest rate. That is, together with trend growth, heightened risk aversion and a widening in spreads seems to account for most of the decline in the neutral interest rate since 2007.[16] Most of the increase in risk aversion and widening in spreads occurred around the time of the global financial crisis. These developments are therefore the most plausible explanation for the large fall in the neutral interest rate that occurred at this time.
The contributions of other determinants of the neutral interest rate are harder to quantify. Our assessment is that the contribution of other identifiable influences on the neutral interest rate in Australia has been small. In part, this reflects the fact that these influences tend to evolve only gradually and hence cannot account for the large decline in the neutral interest rate observed around the time of the global financial crisis.
Conclusion
Australia's neutral interest rate has declined over recent decades. This mirrors, and is likely to some extent to have been caused by, a downward trend in neutral interest rates in other advanced economies. Much of the decline in the neutral interest rate since 2007 seems to reflect a reduction in the economy's potential growth rate and an increase in risk aversion by households and firms.
At the same time, uncertainty surrounding estimates of the neutral interest rate should be kept in mind. Alternative estimation methods reach different conclusions about the level of the neutral interest rate, and the individual estimates themselves are somewhat imprecise. As such, it is appropriate to use a suite of indicators, rather than rely on estimates from a single measure. It is entirely plausible that our estimates of the neutral interest rate could increase, or decline further, as the economy evolves. For this reason, the Bank intends to update and monitor these estimates on a regular basis.
Appendix A: Estimating the Model
The model consists of equations linking the output gap, the unemployment rate and inflation. These equations reflect the theoretical relationships between these variables implied by most standard macroeconomic models. Details of the variables used are in Table A1.
IS curve:
Okun's law:
Phillips curve:
where  is the output gap. The model also includes equations for the unobserved state variables,
potential output
  , trend growth (gt)
and the non-accelerating inflation rate of unemployment or NAIRU
  . In contrast to
the equations for the output gap, unemployment rate and inflation, the state
equations are atheoretical:
The neutral rate is described as a function of trend growth and a latent factor zt, which accounts for all other factors that can affect the neutral interest rate:
We estimate the model using Bayesian methods. This allows us to combine prior information about the values of the estimated parameters from economic theory and other studies with information from the data. Intuitively, the estimation procedure searches for the combination of parameter estimates that best explains the observed behaviour of output growth, inflation and the unemployment rate, but penalises parameter estimates that are far from our expectations. The size of the penalty depends on the strength of our ‘priors’. If we have strong reasons to believe that a parameter falls in a particular range, the penalty for deviating from that range will be large. For other parameters, where our beliefs are not as strong, the penalty will be small. For example, economic theory and empirical evidence strongly suggests that a higher real policy rate will lower the pace of economic activity. Therefore, our priors rule out parameter estimates that imply a positive relationship between the real policy rate and economic activity.
For a given set of parameter estimates, we use a statistical technique known as the Kalman filter to generate estimates of the neutral interest rate. At each observation in the sample, given an estimate of the neutral interest rate and Equations A(1)–A(8), the model will produce a prediction for the output gap, the unemployment rate and inflation. Any differences between the predictions and actual data will cause some revision in the estimate of the neutral interest rate for that quarter. Using the revised estimate of the neutral interest rate, the process is then repeated for the next quarter. Once we reach the end of the sample, we use the Kalman smoother to construct estimates of the neutral interest rate based on the full history of the data.
Table A2 describes the prior distributions and estimation results.
| Variable | Description | Source |
|---|---|---|
| yt | Chain-volume real GDP | ABS |
 |
Current estimate of potential real GDP | |
| πt | Quarterly trimmed mean inflation | ABS |
 |
Inflation expectations | Cusbert (2017) |
| rt | Nominal cash rate deflated by trimmed mean inflation | ABS; RBA |
 |
Current estimate of the neutral interest rate | |
| ut | Unemployment rate | ABS |
 |
NAIRU | |
|
Source: RBA |
||
| Parameter | Posterior | Distribution | Prior Mean | Standard deviation | |
|---|---|---|---|---|---|
| Mode | Mean | ||||
| Structural parameters | |||||
IS curve –  |
1.53 | 1.48 | Normal | 1.10 | 1.50 |
IS curve –  |
−0.54 | −0.53 | Normal | −0.20 | 1.50 |
IS curve –  |
0.05 | 0.06 | Inverse gamma | 0.15 | 1.00 |
| Phillips curve – πt(L) | 0.39 | 0.41 | Beta | 0.50 | 0.25 |
Phillips curve –  |
−0.32 | −0.33 | Normal | −0.50 | 0.30 |
Okun's law –  |
0.62 | 0.64 | Normal | 0.50 | 0.30 |
| Shock processes | |||||
| IS curve | 0.38 | 0.37 | Inverse gamma | 1.00 | 1.00 |
| Phillips curve | 0.79 | 0.80 | Inverse gamma | 1.00 | 1.00 |
| Unemployment | 0.07 | 0.07 | Inverse gamma | 0.25 | 0.25 |
| Trend output | 0.54 | 0.55 | Inverse gamma | 1.00 | 1.00 |
| NAIRU | 0.15 | 0.15 | Inverse gamma | 0.40 | 0.25 |
| Trend growth | 0.05 | 0.05 | Inverse gamma | 0.25 | 0.50 |
| Unexplained r* | 0.22 | 0.34 | Inverse gamma | 0.40 | 0.25 |
|
Source: RBA |
|||||
Footnotes
The authors are from Economic Analysis Department, and would like to thank Richard Finlay and Jonathan Hambur for their contributions to this article. [*]
The term ‘neutral interest rate’ sometimes refers to the real short-term interest rate that will bring about full employment at any point in time, given the presence of these transitory business cycle influences. On average, over a normal business cycle, this interest rate will coincide with the medium-run concept of the neutral interest rate described above, but it will exhibit greater volatility because it will also adjust in response to transitory economic developments. [1]
Strictly speaking, the relevant interest rate for policy decisions is the neutral nominal interest rate, which is equal to the neutral interest rate plus expected inflation. If medium-run inflation expectations are stable – a reasonable assumption for Australia over recent decades – then a change in the neutral interest rate will translate one-for-one into a change in the neutral nominal interest rate, and hence the policy rate over the medium run. [2]
If monetary policy has become less effective, then the policy rate will need to be lower during an easing phase and higher in a tightening phase to achieve the goals of monetary policy. By contrast, if the neutral rate has fallen, interest rates will be lower than in the past in both phases. [3]
It is difficult to distinguish between increases in risk aversion and increases in subjective perceptions of risk. Both are likely to have increased during the global financial crisis (Hoffmann, Post and Pennings 2013). Throughout this article we use the generic term risk aversion to refer to a reduction in risk-taking by households and firms, regardless of whether this reflects true risk aversion or the perception of increased risk. [4]
In some cases, the distinction between domestic and overseas influences is unclear. For example, overseas developments are likely to affect productivity growth and borrowing and lending spreads in Australia. [5]
Our model is similar to that used by Holston, Laubach and Williams (2016) and Kiley (2015). [6]
Most discrepancies between the model and the data do not reflect shifts in the neutral interest rate. For example, economic activity may be weaker than the model expects because of a transitory dip in consumer expenditure or bad weather that reduces farm production. By using information from multiple data series, the model is able to distinguish between shifts in aggregate demand or supply and movements in the neutral interest rate. [7]
The probability interval incorporates uncertainty about both model parameters and shocks. [8]
This is also true if we consider the two standard deviation probability interval. [9]
In theory, financial market measures should incorporate all available information about movements in the neutral interest rates. A problem with these measures is that financial market interest rates may incorporate time-varying term premia, and the estimates may be sensitive to the method used to take account of these term premia. [10]
For example, model-based estimates may be sensitive to the assumptions underpinning the economic relationships in the model, and financial market-based estimates may be sensitive to the method used to extract term premia and inflation expectations. [11]
For example, Debelle (2009). [12]
External estimates point to a similar decline in the economy's potential growth rate. For example, the growth rate at the projection horizon of the Commonwealth Budget has declined by 50 basis points since the mid 1990s. Lancaster and Tulip (2015) also estimate a ½ percentage point fall in potential growth over this period. [13]
Aside from trend growth, our model is silent on the other influences on the neutral interest rate. Our inferences regarding the influence of risk aversion therefore rely on off-model information. [14]
The widening in spreads over this period is also likely to reflect regulatory changes. [15]
The narrowing interest rate spreads during the 1990s, which one might have expected to increase the neutral interest rate, coincided with a period of stability in the neutral interest rate. One explanation for this is that other factors were putting downward pressure on the neutral interest rate over this period. We leave a full decomposition of influences on the neutral interest rate over recent decades to future research. [16]
References
Cusbert T (2017), ‘Estimating the NAIRU and the Unemployment Gap’, RBA Bulletin, June, pp 13–22.
Debelle G (2009), ‘The Australian Experience with Inflation Targeting’, Speech at Banco Central do Brasil XI Annual Seminar on Inflation Targeting, Rio de Janeiro, 15 May.
Hoffmann AOI, T Post and JME Pennings (2013), ‘Individual Investor Perceptions and Behavior During the Financial Crisis’, Journal of Banking and Finance, 37(1), pp 60–74.
Holston K, T Laubach and JC Williams (2016), ‘Measuring the Natural Rate of Interest: International Trends and Determinants’, Finance and Economics Discussion Series, Board of Governors of the Federal Reserve System 2016-073.
Kent C (2014), ‘Non-mining Business Investment – Where to from here?’, Address to the Bloomberg Economic Summit, Sydney, 16 September.
Kiley MT (2015), ‘What Can the Data Tell Us About the Equilibrium Real Interest Rate?’, Federal Reserve Board Finance and Economics Discussion Series 2015-077.
Lancaster D and P Tulip (2015), ‘Okun's Law and Potential Output’, RBA Research Discussion Paper No 2015-14.
Laubach T and JC Williams (2016), ‘Measuring the Natural Rate of Interest Redux’, Board of Governors of the Federal Reserve System Finance and Economics Discussion Series 2016-011.
Lubik TA and C Matthes (2015), ‘Calculating the Natural Rate of Interest: A Comparison of Two Alternative Approaches’, Federal Reserve Bank of Richmond Economic Brief EB15-10.


