Bulletin – June 2019 Payments Bank Fees in Australia
- Download 445KB

Abstract
The Reserve Bank has conducted a survey on bank fees each year since 1997. Banks’ overall income from fees was little changed in 2018. The removal of ATM withdrawal fees by a number of banks reduced total fees charged to households. However, this was largely offset by the continued increase in fee income from small businesses, reflecting strong growth in credit card and debit card transactions.
Overall, Bank Income from Fees Was Little Changed in 2018
The Reserve Bank's annual bank fee survey provides information on the fees charged by banks' Australian operations.[1] The survey focuses on fee income from the provision of loans, deposit services and payment services. The 2018 survey included 16 institutions, capturing 90 per cent of the Australian banking sector by balance sheet size.[2] Fee income from operations outside of Australia and other fee income obtained through funds management and insurance operations were not covered by the survey. This article summarises the results from the latest survey, covering banks' financial years ending in 2018.[3]
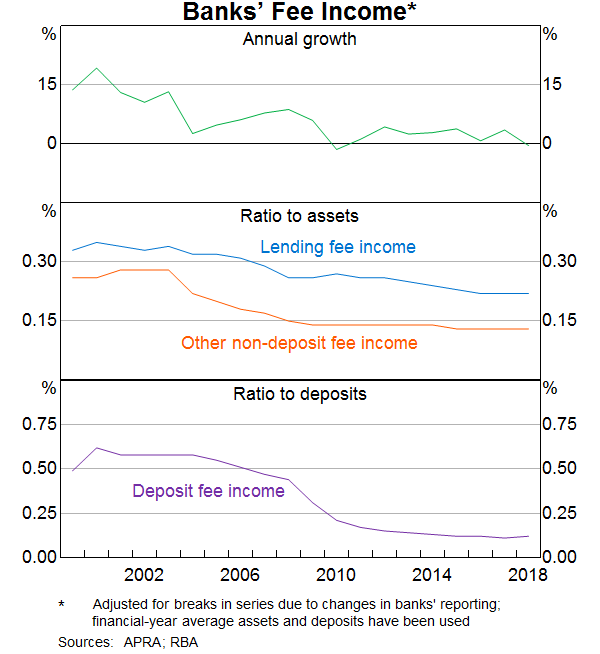
In 2018, domestic banking fee income was little changed, partly reflecting subdued growth in lending assets and deposits (Table 1). The ratios of fees to assets and deposits remained flat (Graph 1). A decrease in fee income from households was largely offset by an increase in fee income from small businesses. Fees charged to households accounted for around one-third of banks' fee income; fees charged to businesses accounted for the remainder.
| Households | Businesses | Total | ||||
|---|---|---|---|---|---|---|
| Level $ million |
Growth Per cent |
Level $ million |
Growth Per cent |
Level $ million |
Growth Per cent |
|
| 2015 | 4,357 | 4.4 | 8,145 | 3.5 | 12,502 | 3.8 |
| 2016(a) | 4,349 | –0.2 | 8,250 | 1.3 | 12,598 | 0.8 |
| 2017 | 4,481 | 3.0 | 8,561 | 3.8 | 13,042 | 3.5 |
| 2018 | 4,189 | –6.5 | 8,795 | 2.7 | 12,984 | –0.4 |
|
(a) Fee income from households in 2016 was affected by a transfer of assets Source: RBA |
||||||
Fee income from households decreased …
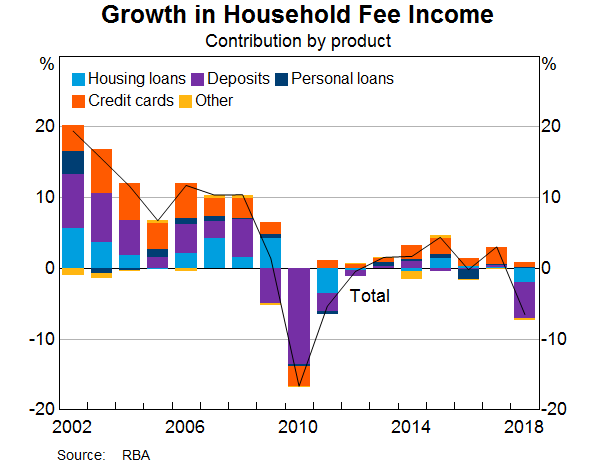
Bank fees charged to households decreased by 7 per cent in 2018, after having grown moderately in recent years. Fee income from households continued to be largely made up of fees on credit cards (41 per cent), housing loans (28 per cent) and deposits (22 per cent). The decrease in fee income in 2018 was primarily driven by a significant decrease in fee income from household deposits (Table 2; Graph 2). Fee income from housing loans also declined.[4] Fee income from credit cards continued to grow, though more slowly than in the past few years.
| 2016 $ million |
2017 $ million |
2018 $ million |
Annual growth 2018 Per cent |
Average annual growth 2012–17 Per cent |
|
|---|---|---|---|---|---|
| Loans: | 3,155 | 3,269 | 3,222 | –1.5 | 2.7 |
| – Housing | 1,258 | 1,263 | 1,175 | –7.0 | 1.0 |
| – Personal(a) | 331 | 336 | 341 | 1.5 | 0.4 |
| – Credit cards | 1,565 | 1,670 | 1,706 | 2.2 | 4.8 |
| Deposits | 1,123 | 1,138 | 912 | –19.9 | 0.9 |
| Other fees(b) | 71 | 67 | 56 | –17.1 | –8.1 |
| Total | 4,349 | 4,481 | 4,189 | –6.5 | 2.1 |
|
(a) Fee income from personal loans in 2016 was affected by a transfer of assets
Source: RBA |
|||||
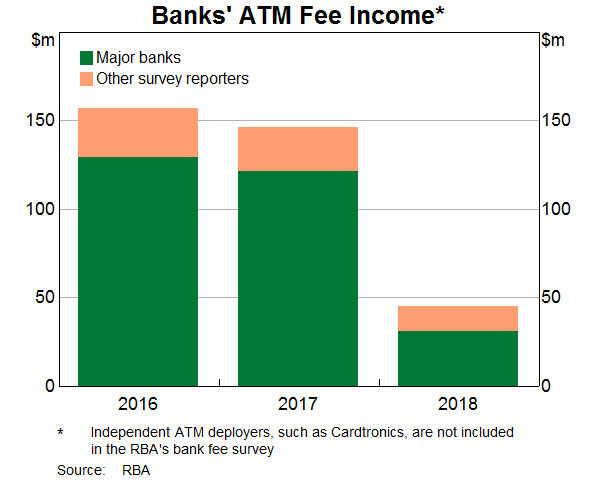
Fee income from deposit accounts fell by 20 per cent in 2018 largely owing to a number of banks, including the four major banks, abolishing the ATM withdrawal fees charged to cardholders from other financial institutions in late 2017 (Graph 3). The decline in fee income also reflected a decline in the number of ATM withdrawals. The decline of ATM use in recent years has been associated with a fall in the use of cash for transactions as consumers have been increasingly using electronic payment methods, particularly payment cards.[5]
Income from exception fees on transaction deposits – which include overdrawn, dishonour and honour fees – also decreased substantially. This owed to lower overdrawn fees, both because of reductions in unit fees on some accounts and fewer overdrawn accounts. Fee income from non-transaction deposit accounts was little changed.
Income from fees on housing loans decreased by 7 per cent in 2018. This was largely driven by lower volumes of new and refinanced housing loans over the year. The decline in fee income from housing loans also partly reflected reductions in unit fees on a number of products, with some banks waiving account servicing fees for customers with package arrangements. Fee income from personal loans remained stable.[6]
Fee income from credit cards continued to be the largest single source of banks' fee income from households. Credit card fees charged to households continued to grow in 2018, but at a slower pace compared with previous years, reflecting in part a decline in income from exception fees. Changes in unit fees were mixed in 2018 – late payment fees and annual fees on rewards cards increased, while foreign currency conversion fees and annual fees on non-rewards cards declined (Table 3).
| 2016 | 2017 | 2018 | Annual growth 2018 Per cent |
|
|---|---|---|---|---|
| Annual fees ($) | ||||
| – Non-rewards cards | 53 | 60 | 57 | –6.0 |
| – Rewards cards | 191 | 199 | 204 | 2.4 |
| – All cards | 137 | 147 | 150 | 1.8 |
| Other fees | ||||
| – Foreign currency conversion fees (per cent of value) | 2.8 | 2.8 | 2.7 | –0.1 ppts |
| – Late payment fee ($) | 18 | 19 | 19 | 3.7 |
|
(a) Simple average of advertised fees for cards issued by a sample of seven banks; only cards that are available to new cardholders are included in the sample; note that changes in the sample affect the average fee; includes fee-free cards; does not include any fee waivers or reductions; as at June of each year Sources: Credit card issuers' websites; RBA |
||||
… but this was largely offset by higher fee income from small businesses
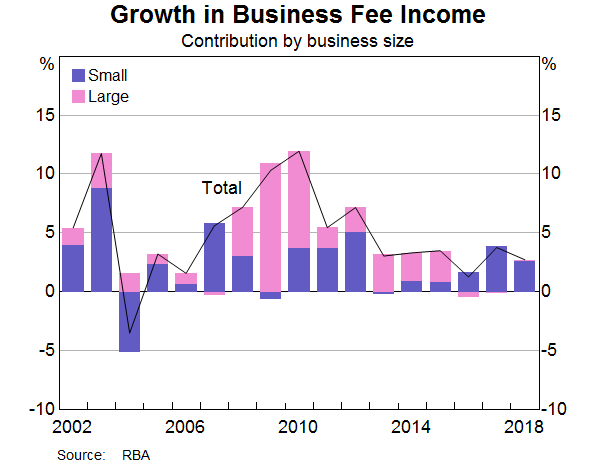
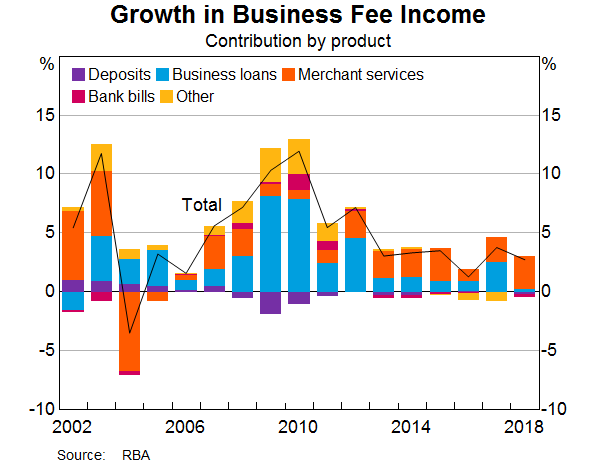
Total fee income from businesses increased by 3 per cent in 2018, almost entirely due to higher fee income from small businesses (Graph 4; Table 4). By product, the main driver for growth in fee income from businesses was the continued increase in income from merchant service fees on card transactions (Graph 5). Fees charged for business loans also increased slightly, while fee income from business deposit services and bank bills both decreased. Fee income from businesses continued to be made up mostly of fee income on loans (43 per cent) and merchant service fees (36 per cent).
| 2016 $ million |
2017 $ million |
2018 $ million |
Annual growth 2018 Per cent |
Average annual growth 2012–17 Per cent |
|
|---|---|---|---|---|---|
| Deposit accounts | 600 | 601 | 583 | –3.1 | –1.0 |
| – of which: exception fees | 60 | 62 | 70 | 12.0 | 6.6 |
| Loans | 3,512 | 3,718 | 3,741 | 0.6 | 3.1 |
| – of which: exception fees | 55 | 50 | 47 | −6.1 | 7.0 |
| Merchant service fees | 2,736 | 2,911 | 3,145 | 8.0 | 7.0 |
| Bank bills | 179 | 176 | 157 | –10.9 | –6.3 |
| Other(a) | 1,222 | 1,162 | 1,169 | 0.5 | –1.4 |
| Total | 8,250 | 8,561 | 8,795 | 2.7 | 3.0 |
| – of which: exception fees | 115 | 113 | 117 | 3.9 | 6.8 |
|
(a) Includes banking-related fee income from businesses that cannot be directly related to a deposit or loan account, merchant or bank bill facility (e.g. guarantees or foreign exchange fees) Source: RBA |
|||||
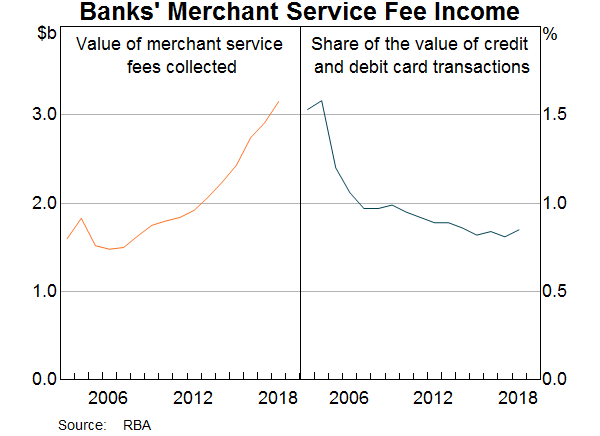
Merchant service fee income continued to grow strongly in 2018 amid double-digit growth in the volume of card transactions (Mitchell and Wang 2019). Banks reported that growth was driven by fees charged to small businesses for accepting card transactions, although merchant service fees charged to large businesses also increased. Non-transaction merchant service fee income (for example, from set-up fees, annual fees, and terminal rental costs) increased slightly, but remained small relative to card transaction fees. Unit fees on debit card transactions were affected by the RBA's new interchange fee standards, which became effective in July 2017. These standards lowered the benchmark for debit card interchange fees from 12 cents to 8 cents per transaction. As interchange fees (which are paid by banks) are a significant component of the cost of providing payment services to merchants (RBA 2016), reductions in these fees typically flow through to lower merchant service fees. However, merchant service fee income remained relatively stable as a share of transaction value in 2018 (Graph 6). This was largely due to a compositional shift in the value of card transactions processed by network, away from the cheaper eftpos network to the relatively more expensive Mastercard and Visa networks. Although merchant service fees for Mastercard and Visa debit card transactions declined as a share of transaction value over the year (consistent with the lower benchmark for interchange fees), they remained well above the average merchant service fee for the eftpos system.[7] Some banks also reported changes in their merchant service fee structures over the past year. The implementation of least-cost routing by the banks – which will allow businesses to direct contactless debit card payments to the network with the lowest fees – is likely to put downward pressure on the unit fees paid by merchants (RBA 2019).
The increase in fees charged for business loans in 2018 reflected higher fee income from small businesses, partly offset by a decrease in the fees charged to large businesses. The changes in fee income from both small and large businesses owed to movements in account servicing fees, which make up the bulk of business loan fees. Lower average unit fees contributed to the decrease in fees from large businesses; overall lending to large businesses increased notably over the survey period (while lending to small businesses increased only slightly).
The decline in fee income from business deposits was driven by a decrease in fees charged to small businesses, though this largely reflected fees refunded for customer remediation. Around two-thirds of fee income from business deposits was for deposit services provided to small businesses.
Fee income from bank bills declined sharply, as businesses continued to shift from bank bills to other, more flexible lending products. In particular, bank bill fees charged to large businesses dropped to a negligible level in 2018, making up less than 1 per cent of total fee income from bank bills.
Footnotes
The authors are from Domestic Markets Department. [*]
The data from the survey are published in the Reserve Bank's Statistical Table C9 and are subject to revision. [1]
Survey results have been affected by mergers and acquisitions among participating institutions and some changes in participants' methodology (where possible, this has been reflected in revisions to data reported in previous years). [2]
All data from the survey are based on individual banks' financial years, which differ across banks (the data in Table 3 were not collected through the survey and are instead based on calendar years). Improved data on bank fees will be reported from 2020 in the new Economic and Financial Statistics (EFS) collection – these data are designed to be more consistent across institutions, including because they will be based on a consistent reporting period. For more information on the EFS collection, see Bank, Durrani and Hatzvi (2019). [3]
For more information on the types of fees charged on housing loans, see ACCC (2018a and 2018b). [4]
For more information, see Mitchell and Thompson (2017). [5]
The personal loan category includes fees associated with term loans, margin loans to households, and home-equity loans where the predominant purpose is not known; the category excludes credit card lending. [6]
For more information, see the Reserve Bank's Statistical Table C3. [7]
References
ACCC (Australian Competition and Consumer Commission) (2018a), ‘Residential Mortgage Price Inquiry’, ACCC Interim Report, March.
ACCC (2018b), ‘Residential Mortgage Price Inquiry’, ACCC Final Report, November.
Bank J, K Durrani and E Hatzvi (2019), ‘Updates to Australia's Financial Aggregates’, RBA Bulletin, March, viewed 19 June 2019.
Mitchell S and C Thompson (2017), ‘Recent Developments in the ATM Industry’, RBA Bulletin, December, pp 47–54.
Mitchell S and H Wang (2019), ‘New Payments Insights from the Updated Retail Payments Statistics Collection’, RBA Bulletin, March, viewed 19 June 2019.
RBA (Reserve Bank of Australia) (2016), ‘Review of Card Payments Regulation: Conclusions’, Media Release No 2016-15, 26 May.
RBA (2019), ‘Payments System Board Update: May 2019 Meeting’, Media Release No 2019-13, 24 May.