Bulletin – June 2020 Global Economy Economic Effects of the Spanish Flu
- Download 691KB
Abstract
The Spanish flu reached Australia in 1919 and remains the country’s most severe pandemic in terms of health outcomes. At the peak of the pandemic, sickness due to influenza temporarily incapacitated 2 per cent of the labour force. However, despite the social distancing measures used by governments to contain the virus, few job losses in this period were due to a lack of available work. The labour market also recovered quickly, but it is not clear how relevant this experience is for the modern economy.
Introduction
The outbreak of COVID-19 infections and the associated containment measures have significantly affected the Australian economy. When faced with a shock like COVID-19, economists usually look to the historical record for a guide as to how things might play out. Although there have been a number of pandemics since the turn of the 20th century, the most severe in terms of health outcomes was the Spanish flu, which began in 1918 and lasted until 1920.
This article discusses the effects of the Spanish flu on the labour market and GDP in Australia. It does this by analysing the economic data and other evidence for the period. While the Spanish flu provides a useful case study, its usefulness is tempered by the differences in the economy and its institutions in 1919 compared with the same in 2020. Using the Spanish flu period to draw lessons on the economic effects of pandemics is additionally challenging because it also coincided with a period of major economic adjustment after the end of the war. I begin by providing a brief overview of the timeline and epidemiology of the Spanish flu and the measures used by authorities to contain the virus.
The Spanish flu was less deadly in Australia than other countries
Globally, the Spanish flu pandemic occurred in three main waves – the first in early 1918, the second and most deadly from September 1918 to January 1919, and the third from February 1919 through the remainder of the year.[1]
Graph 1 shows estimates of mortality rates over time.[2] According to these estimates, 2.1 per cent of the world's population died from Spanish flu. The mortality rates were particularly high in countries with large populations (notably India), which explains why the ‘weighted’ mortality rate exceeds the ‘unweighted’ rate in Graph 1.

Because of Australia's remoteness and rapid quarantine response, it was one of the few countries to avoid Spanish flu during 1918 (Graph 1). The first case appeared in Melbourne, on 9 or 10 January 1919, before spreading to Sydney and South Australia by the end of the month (Graph 2; Graph 3) (National Museum of Australia 2020). In Perth, the combination of the city's relative isolation and effective state border quarantine control meant that Spanish flu did not arrive there until June 1919. Similarly, the virus did not reach Tasmania until August. By the end of 1919, the pandemic was over.


Some regions experienced multiple waves of infections and mortality. For example, Sydney – which had the highest mortality rate of any metropolitan area in Australia – experienced two waves of the epidemic characterised by rapidly rising then falling infections. Epidemiologists continue to debate the reasons why some regions had multiple waves of infections, although the imposition and removal of social distancing measures is a leading explanation.[3]
Mortality rates for Spanish flu were highest for those aged 18 to 40. In NSW, more than half of all deaths were in this age group. This stands in sharp contrast to most other influenza pandemics, such as the 1891 influenza pandemic (and the current COVID-19 pandemic), where the majority of deaths were in people aged over 60 (Curson and McCracken 2014). These differences in the age distribution of mortality should be kept in mind when attempting to draw parallels between the labour market implications of Spanish flu to those of COVID-19.
The containment measures were similar to that being implemented today
The economic effects of a pandemic depend in large part on the measures used to contain the spread of the virus. Many of those measures implemented during the Spanish flu pandemic are remarkably similar to those used in the current pandemic. For example, on 28 January 1919 – the day after NSW was proclaimed to be ‘infected’ – all libraries, schools, churches, theatres, halls and indoor entertainment venues were shut down. Six days later, racecourses and hotels were closed and people on public transport and in public places were required to wear masks. NSW schools remained closed throughout February (McQueen 1976).[4] Other states implemented similar measures to contain the virus. Movement by public transport was restricted and state borders were closed. Streets were sprayed with the disinfectant phenyl and the public were urged to practice cough etiquette, regular handwashing, ventilation and disinfection (Curson and McCracken 2014). These travel bans, quarantine and social distancing measures are similar to those used by governments today.[5]
While various containment measures were employed, most were not in place for the duration of the pandemic, and each state and region had a different response. For example, in early March 1919 the low rate of infection led NSW authorities to assess that the threat had passed and so most containment measures were lifted (Caley et al 2008). However, these measures were reinstated later in the month following a sharp rise in infections. Containment measures then remained in place until mid May when they were lifted for a second time, and were not again reinstated despite another wave of infections (NSW State Archives & Records 2020).
Research on the economic effects is limited
Research on the economic effects of the Spanish flu is limited by the lack of economic statistics for this era. Garrett (2008) instead uses historical newspaper reports to gauge the effects of the pandemic on US businesses. The effects were large. For example, the Arkansas Gazette in October 1918 was reporting a 30 per cent fall in grocery sales and a 40–70 per cent fall in sales at merchants and department stores. At the same time, sales of medical drugs and mattresses were surging. The Commercial Appeal (Memphis) was reporting that severe labour shortages were affecting industrial output.
More recent studies released since COVID-19 have found evidence of large and statistically significant effects of the Spanish flu on economic activity. For example, Barro et al (2020) found that the Spanish flu reduced real GDP per capita by around 6 per cent in the typical country over the period 1918–21. Correia, Luck and Verner (2020) found that Spanish flu reduced US manufacturing output by 18 per cent, though their findings have been challenged (Rinaldi, Lilley and Lilley 2020).
The paper by Correia et al (2020) also emphasises the important link between government containment measures and economic outcomes. In theory, the economic effects of containment measures could be positive or negative. They are also hard to separately identify. For example, while containment measures do restrict any economic activity that relies on social interactions, many households would have reduced social interactions regardless of government intervention in order to reduce their risk of becoming infected. Furthermore, government restrictions can help solve ‘coordination problems’ associated with containing the virus, and thus can, in theory, reduce the overall economic disruption caused by a pandemic in the medium term. Interestingly, Correia et al found US cities that implemented early and extensive interventions in response to the Spanish flu experienced stronger economic growth after the pandemic subsided relative to those that did not. But as noted above, the accuracy of their methodology has been questioned by Rinaldi et al (2020) and further work in this area is needed.
In the remainder of the article I discuss the evidence on the economic effects of the Spanish flu in Australia. To do so, I draw on a range economic data and qualitative information from newspapers and government reports from the time.
Newspapers and reports from the time paint a mixed picture about the economic effects …
The Victorian factory inspectors' report for 1919 paints a mixed picture about the effects of Spanish flu on manufacturing activity (CIFS 1920). Output was reported to be ‘well maintained’ during 1919 with ‘plentiful’ orders. But it was also reported that 1919 would have been a ‘record year’ had business not been ‘dislocated’ and ‘progress retarded’ by several factors, one of which was the Spanish flu. The influenza ‘not only considerably reduced the number of employees temporarily, but the regulations prescribed to prevent its spread restricted the movement of purchasers’. Nonetheless, the report notes that ‘retail shopkeepers had a very good year’, particularly those selling high-quality goods.
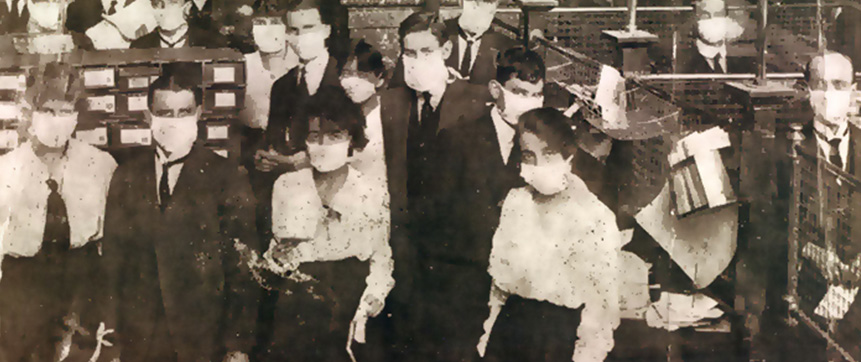
The NSW Industrial Gazette also painted a mixed picture of the effects of influenza on the NSW economy (DLISS 1919). The first mention of Spanish flu was in the March 1919 edition, where it was reported that there had been a decline in job search and hiring activity in February that was due in part to ‘the restrictive effect on certain industries of the impending epidemic’. Newspapers from the time also reported that retail trade in Sydney was ‘hit badly’, with the volume of sales falling by 25–40 per cent for several ‘large, representative’ retailers due to a sharp decline in foot traffic (Figure 1).[6] Retailers responded by ramping up mail order facilities, which were in strong demand due to the epidemic. The entertainment industry was also affected, with reports that between 5,000 and 6,000 cinema employees were ‘thrown out of work’ in metropolitan Sydney due to the compulsory closure of cinemas.[7]

Although the removal of government restrictions in early March meant employees could resume work in cinemas and theatres, restrictions were soon reimposed (Department of Labour and Industry and Social Services 1919). In addition, even after the restrictions were lifted for a second time, voluntary social distancing by households meant theatres were ‘playing to half empty houses’.[8] In June, there were some reports of businesses being ‘paralysed’ by the pandemic, such as in Maitland NSW where offices, shops and factories were ‘practically at a standstill’.[9]
There were reports of ‘slackness’ in some trades in mid 1919 due to the influenza, with caterers, waitresses, jewellers and theatrical employees being most affected (Department of Labour and Industry and Social Services 1919). On the other hand, it was reported that ‘labour demand exceeded supply’ in the construction sector and for female labour in domestic services.[10] While the incapacitation of employees left some firms with labour shortages, businesses in some sectors were able to manage these labour shortages through greater use of overtime hours.
… while quantitative data point to reasonably large economic effects
In this section I discuss some quantitative estimates of the effect of Spanish flu on the labour market and activity. A complicating factor in this analysis is the difficulty in distinguishing the effects of the Spanish flu from those of the war. When Spanish flu began transmitting through the Australian community in early 1919, the war was well and truly over; however, there were lingering effects of the war on economic activity. In particular, the Australian economy was in a period of transition from the public-led demand growth during the war to private-led growth thereafter. The subtraction from GDP due to the removal of the wartime stimulus was considerable, and is likely to have had a large influence on economic outcomes during the period in which the Spanish flu was spreading (Graph 4). In terms of the labour market, returning veterans also needed to be re-absorbed into the labour market and it is unclear from the aggregate data how smoothly this transition went. Where possible, this article tries to disentangle the separate effects of the Spanish flu from the effects of the war, although in many cases I was not able to do this convincingly.

Labour market impacts
The most reliable source of labour market data for the period are those reported by trade unions to the Commonwealth Bureau of Census and Statistics.[11]
These data show that the unemployment rate for union members rose by 3 percentage points during the Spanish flu (Graph 5). It is likely that most of this increase was caused by the pandemic. The peak in unemployment in the June quarter 1919 coincided with the peak in the flu-related death rate in that year. Moreover, the increase in unemployment during the first half of 1919 was driven by an increase in unemployment due to sickness, which the Commonwealth Bureau of Census and Statistics (1922) directly attributed to the flu epidemic. It is important to note that the statistics reported by trade unions did not require a person to be ‘actively seeking work’ and ‘available for work’ in order to be classified as unemployed, in contrast to current ABS definitions.[12] In the Labour Force Survey (LFS), people who are not currently in work due to illness are classified as ‘not in the labour force’ or ‘employed’ (but working zero hours), depending on whether they retain their job during their period of illness. All things considered, we should think of this rise in ‘unemployment’ due to illness during the Spanish flu as a decline in some broader concept of labour supply, rather than a rise in the rate of unemployment. At its peak the epidemic appears to have temporarily incapacitated 2 per cent of employees.

Unemployment due to ‘a lack of work’ also rose during the Spanish flu, contributing 1 percentage point to the overall increase (Graph 5). This at least partly reflects the effect of containment measures used by governments, which significantly restricted economic activity, as well as the effect of the pandemic on aggregate demand. However, the size of this increase in unemployment was very modest and within the usual range of quarterly changes in the series. Unemployment due to other reasons also rose during the pandemic, which may be due to more people taking time off work to care for sick relatives (which, again, would be classified as not in the labour force or employed in the LFS).
The muted rise in unemployment owing to a lack of work is surprising given the extent of the social distancing responses. It is unclear why this is the case. One possibility is that the decline in labour demand (due to social distancing) was matched by a decline in labour supply (due to illness). Another possibility is that the union survey is not representative of the broader labour market. While the high degree of unionisation meant the survey covered half of the total labour force, the sample was weighted towards industries like building and metal trades. Unskilled casual labour, agriculture, and the self-employed were not captured in the survey (Forster 1965). It is possible that the containment measures had a different (i.e. larger) effect on those sectors that were not surveyed than those that were.
Differences in the timing of the epidemic across the states also supports the conclusion that the rise in unemployment (broadly defined) in 1919 was mainly due to the Spanish flu rather than other factors, such as the tapering of wartime stimulus. The unemployment rate in the ‘first-infected states’ (NSW, Victoria and South Australia) peaked one quarter before the ‘last-infected states’ (Western Australia and Tasmania), consistent with the timing of the virus spread (Graph 6). Although the unemployment rate rose sharply, it also fell sharply once the pandemic abated in late 1919. The speed of recovery in the labour market and absence of any obvious scarring effects is noteworthy.

In some industries, Spanish flu also led to industrial unrest. The Seamen's Union, whose members lived in cramped quarters on ships, organised one of the most protracted set of strikes in Australian history in an attempt to improve the safety of their living conditions (McQueen 1976). Waterside workers refused to unload ships for fear of infection and some public workers demanded ‘epidemic pay’ (Curson and McCracken 2014).
Effect on GDP
The seminal collection of historical GDP data for Australia is that compiled by Matthew Butlin (1977). Butlin's data suggest that GDP rose by 2¼ per cent in 1918/19 and fell by 5½ per cent in 1919/20, which are the two financial years that spanned the Spanish flu outbreak in Australia (Graph 7). Average growth for these two years was similar to that in the two years leading up to the epidemic. At face value, this might lead one to think that Spanish flu had a small effect on GDP. The strong growth in the years following the epidemic may also lead us to believe that any effects of Spanish flu on the level of output were quickly reversed, with the recovery exhibiting a ‘V-shaped’ pattern.

However, we do not know the counterfactual. As discussed earlier, it is difficult to isolate the effects of the Spanish flu from other shocks, such as the removal of the wartime stimulus. Indeed, much of the decline in GDP growth during this period is accounted for by a large subtraction from public demand, while private demand was resilient (Graph 8).

A recent study by Barro et al (2020) does a better job of controlling for ‘third factors’, and specifically the effect of the war. They look at the variation in Spanish flu intensity across 42 countries and over time to estimate the effect of the Spanish flu on GDP. Their regressions control for the effects of the war using a variable that captures the intensity of each country's participation in the conflict.[13] They find that Spanish flu reduced real GDP per capita by 6 per cent in the typical country. However, applying their model estimates to the Australian mortality rates implies that the pandemic reduced Australian GDP by only ¾ per cent. Their models do not fit the data well and it is unclear whether mortality is a good proxy for the disruption in Australia so there is significant uncertainty around this estimate.
Overall, the effects of the Spanish flu on Australian GDP are very hard (if not impossible) to pin down due to the inability to control for other factors that influenced economic growth.
Does this help with our analysis of COVID-19?
The Australian economy is markedly different today than it was in 1919. In 1919, agriculture and manufacturing each accounted for one-quarter of total employment, compared with 2½ per cent and 7 per cent nowadays. In 1919 the exchange rate was pegged to the pound sterling and the world was less globalised. Two-thirds of Australia's exports were rural and half of all Australia's exports were to the United Kingdom. Industrial disputes were pervasive and most employees were paid award wages. Female labour supply (in the market sector) was far lower than it is today, and the technology to work from home was obviously far more limited.
The response of fiscal policy in 1919 was also different than that used in response to COVID-19. A simple measure of the fiscal impact – the change in the consolidated fiscal balance as a share of GDP – suggests that fiscal policy in Australia was broadly neutral, or slightly contractionary during the Spanish flu (though this simple metric is distorted by the war), while being highly expansionary in 2020.[14] Government support for households during Spanish flu generally took the form of in-kind transfers of food, blankets, clothing and rent assistance, rather than cash transfers (NSW State Archives & Records 2020). Support for businesses often took the form of partial compensation for losses sustained due to the restrictions, although in many cases this compensation was paid out many months after the pandemic had passed.
Most importantly, more of household consumption is ‘social’ these days than it was in the past (although it was hard to find data on spending patterns in 1919) (Keogh‐Brown et al 2010). Social consumption can be more easily postponed or abandoned relative to the type of consumption common in 1919 (e.g. food, housing and clothing). All else being equal, a larger share of ‘social’ consumption in the basket means that any effects on GDP will be larger now than in the past. Given these many differences, it is unclear how useful Australia's Spanish flu experience is for the current situation.
The Spanish flu period highlights how disruptive a pandemic can be to economic activity. In saying that, and being mindful of how different the Australian economy is now, the Spanish flu period and the strong economic growth that followed shows that rapid recoveries from pandemics are possible if the public health aspects are not too prolonged. A surprising feature of the Spanish flu episode was how quickly the labour market appears to have recovered.
Footnotes
The author is from Economic Research Department. [*]
The 1918–19 pandemic is often called the ‘Spanish flu’, not because it originated in Spain, but due to its first being widely reported there. [1]
These estimates are from Barro, Ursúa and Weng (2020), which draw on many sources and cover more than 90 per cent of the world's population in 1918. [2]
The beginning of both epidemic waves in Sydney followed a lifting of social distancing measures, which has led some epidemiologists to conclude that those measures played an important role in the dynamics of infection (Caley, Philp and McCracken 2008). Similar conclusions have been drawn using data for US cities, with studies finding that social distancing measures during the Spanish flu flattened the curve in the sense of reducing peak mortality rates (Bootsma and Ferguson 2007; Hatchett, Mecher and Lipsitch 2007; Markel et al 2007; Barro 2020). There are other possible explanations for the two epidemic waves in Sydney, such as seasonal changes in virus transmissibility and multiple circulating viruses (see Caley et al (2008) for a discussion). [3]
In other states, schools were closed for at least part of 1919 either because of government decree or because teachers were sick. [4]
The shortage of hospital beds in NSW led to the creation of hundreds of temporary hospitals in private houses, schools, showground buildings, churches, gaols, bowling clubs, tearooms, drill halls and courthouses. With many health workers incapacitated with influenza, these temporary hospitals were often staffed by lay volunteers (Curson and McCracken 2014). [5]
The declines were 30–40 per cent at David Jones and 25 per cent at Marcus Clark & Co. (department stores) and Nock & Kirby (hardware and general goods) (source: ‘Shop Trade Hit’, The Sun, 6 February 1919, p 5, viewed 1 June 2020. Available at <http://nla.gov.au/nla.news-article222644593>). [6]
‘Showmen's Troubles’, The Sydney Morning Herald, 29 January 1919, p 11, viewed 1 June 2020. Available at <http://nla.gov.au/nla.news-article15822283>. [7]
‘Our Sydney Letter’, Newcastle Morning Herald and Miners' Advocate, 16 June 1919, p 4, viewed 1 June 2020. Available at <http://nla.gov.au/nla.news-article139442782>. [8]
‘Business Paralysed in Maitland’, Singleton Argus, 21 June 1919, p 6, viewed 1 June 2020. Available at <http://nla.gov.au/nla.news-article80753563>. [9]
While advertisements for domestic help had earlier called for a ‘trained nurse’ (who could command any wage), the market for domestic help became so tight that requests were simply for ‘someone who has some knowledge of household duties’. [10]
These data are available in the Commonwealth Year Books. Excluded are unions whose members had permanent employment (e.g. rail workers and public servants) or those employed on a casual basis (e.g. wharf labourers). Although few unions paid unemployment benefits, most kept unemployment registers. A useful discussion of the value and reliability of the trade union data is in Forster (1965). [11]
According to Forster (1965), to be regarded as unemployed in the union reports a person had to be out of work for three or more days in the specified reference week. [12]
The authors measure war intensity as the ratio of military combat deaths to total population. Some of the variation used to identify the effects of the Spanish flu on GDP growth comes from countries that experienced the Spanish flu but were not involved in the war. [13]
The smaller fiscal response during Spanish flu likely reflects the large debt burden accumulated during the war and a lack of understanding about countercyclical fiscal policy (the Spanish flu occurred before Keynesian economic ideas became mainstream in the 1930s). The automatic stabilisers were also not operating very strongly, as progressive income taxes were a smaller share of tax revenue (more than half of all revenue was from indirect taxes like customs and excise duties) and because 1919 preceded the introduction of unemployment and sickness benefits in the 1940s. The public sector was also a smaller part of the economy in 1919, with tax revenue being below 10 per cent of GDP. [14]
References
Barro RJ (2020), ‘Non-Pharmaceutical Interventions and Mortality in U.S. Cities’, NBER Working Paper No. 27049.
Barro RJ, JF Ursúa and J Weng (2020), ‘The Coronavirus and the Great Influenza Pandemic: Lessons from the "Spanish Flu" for the Coronavirus's Potential Effects on Mortality and Economic Activity’, NBER Working Paper No. 26866.
Bootsma M and N Ferguson (2007), ‘The Effect of Public Health Measures on the 1918 Influenza Pandemic in U.S. Cities’, Proceedings of the National Academy of Sciences, 104(18), pp 7588–7593.
Butlin MW (1977), ‘A Preliminary Annual Database 1900/01 to 1973/74’, RBA Research Discussion Paper No 7701.
Caley P, DJ Philp and K McCracken (2008), ‘Quantifying Social Distancing Arising from Pandemic Influenza’, J R Soc Interface, 5(23), pp 631–639.
CIFS (Chief Inspector of Factories and Shops) (1920), ‘Report of the Chief Inspector of Factories and Shops: For the Year Ended 31st December, 1919’, Victoria.
Commonwealth Bureau of Census and Statistics (1920), ‘Official Year Book of the Commonwealth of Australia, No. 13. - 1920’.
Commonwealth Bureau of Census and Statistics (1922), ‘Prices, Purchasing-Power of Money, Wages, Trade Unions, Unemployment, and General Industrial Conditions, 1921’, Labour and Industrial Branch Report, July.
Correia S, S Luck and E Verner (2020), ‘Pandemics Depress the Economy, Public Health Interventions Do Not: Evidence from the 1918 Flu’, March, unpublished manuscript.
Curson P and K McCracken (2014), ‘An Australian Perspective of the 1918–1919 Influenza Pandemic’, NSW Public Health Bulletin, 17(7–8), pp 103–107.
DLISS (Department of Labour and Industry and Social Services) (1919), ‘The New South Wales Industrial Gazette’, XV No. 1 to XVI No 6.
Forster C (1965), ‘Australian Unemployment 1900–1940’, Economic Record, 41(95), pp 426–450.
Garrett TA (2008), ‘Economic Effects of the 1918 Influenza Pandemic: Implications for a Modern-Day Pandemic’, Federal Reserve Bank of St. Louis Review, 90(2), pp 75–93.
Hatchett RJ, CE Mecher and M Lipsitch (2007), ‘Public Health Interventions and Epidemic Intensity during the 1918 Influenza Pandemic’, Proceedings of the National Academy of Sciences, 104(18), pp 7582–7587.
Keogh‐Brown MR, S Wren-Lewis, WJ Edmunds, P Beutels and RD Smith (2010), ‘The Possible Macroeconomic Impact on the UK of an Influenza Pandemic’, Health Economics, 19(11), pp 1345–1360.
Markel H, HB Lipman, JA Navarro, A Sloan, JR Michalsen, AM Stern and MS Cetron (2007), ‘Nonpharmaceutical Interventions Implemented by US Cities During the 1918–1919 Influenza Pandemic’, Journal of the American Medical Association, 298(6), pp 644–654.
McQueen H (1976), ‘The ‘Spanish’ Influenza Pandemic in Australia, 1912–19', in J Roe (ed), Social Policy in Australia – Some Perspectives 1901–1975, Cassell Australia, Stanmore NSW, pp 131–147.
National Museum of Australia (2020), ‘Defining Moments: Influenza Pandemic’, viewed 1 June 2020. Available at <https://www.nma.gov.au/defining-moments/resources/influenza-pandemic>.
NSW State Archives & Records (The State Archives and Records Authority of New South Wales) (2020), ‘Pneumonic Influenza (Spanish Flu), 1919’, State Archives and Records Authority of New South Wales site, viewed 1 June 2020. Available at <https://www.records.nsw.gov.au/archives/collections-and-research/guides-and-indexes/stories/pneumonic-influenza-1919>.
Rinaldi G, A Lilley and M Lilley (2020), ‘Public Health Interventions and Economic Growth: Revisiting the Spanish Flu Evidence’, Harvard University Economics Department and Harvard Business School, May, unpublished manuscript.