Bulletin – June 2020 Australian Economy News Sentiment and the Economy
- Download 695KB
Abstract
The large and immediate effect of the COVID-19 pandemic on economic activity has increased the need for more real-time indicators of the economy. This article discusses a new indicator of `news sentiment’, which uses a combination of text analysis, machine learning and newspaper articles. The news sentiment index complements other timely economic indicators and has the advantage of potentially being updated on a daily basis. The news sentiment index captures key macroeconomic events, such as economic downturns, and typically moves ahead of survey-based measures of sentiment. Related indicators, such as the news uncertainty index, similarly help to better understand real-time developments in the Australian economy.
Real-time Economic Indicators and the COVID-19 Pandemic
Policymakers need to assess the state of the economy in a timely manner to devise appropriate policy responses. The COVID-19 pandemic has disrupted daily life and economic activity and its rapidly evolving nature has increased the need for real-time indicators of the Australian economy. The most common measure of economic activity, GDP growth, is not observed in real time as it is compiled on a quarterly frequency and published with a lag. Policymakers also closely monitor a range of partial indicators of the economy that are more timely, such as survey-based measures of consumer and business sentiment, as well as financial and labour market data. But even these measures are published with lags of weeks or months, and some rely on samples of the population, which introduces sampling variability.
This article discusses a real-time indicator for the Australian economy developed using an alternative approach based on text analysis of news articles. A `news sentiment index' (NSI) is constructed that measures the net balance of positive and negative words used by journalists in news articles about the economy. In making decisions, consumers and business managers are likely to rely on high-frequency information that is broadcast through the news media. To the extent that the information in news media captures a broad audience, it could be more representative than survey data provided by professional data providers (Thorsrud 2018). This indicator can be used to track economic conditions on a daily basis (Shapiro, Sudhof and Wilson 2017).
The text-based approach used in this article is flexible; not only can it proxy for sentiment but also the level of uncertainty in the economy. Broadly speaking, ‘sentiment’ captures people's beliefs about the mean of the distribution of future economic outcomes (the first moment) while ‘uncertainty’ captures the variance of people's beliefs (the second moment) (Haddow et al 2013). There is now extensive research showing that both more negative sentiment and higher uncertainty are associated with lower spending and investment, and hence can predict weaker economic conditions (for example Moore (2017); Bloom (2014); Shapiro, Sudhof and Wilson (2017); Barsky and Sims (2012); Benhabib and Spiegel (2019)). However, some research suggests that survey-based sentiment indicators provide limited new information about the state of the economy (Roberts and Simon 2001). It is possible, though, that alternative sources of information about sentiment, such as the news media, are useful for nowcasting the economy – that is, understanding the present or very recent past. The news media might offer new information that household and business surveys do not or the same information earlier.
The text-based approach can be extended to develop sectoral measures of both sentiment and uncertainty. This includes estimates of news sentiment for housing markets in each capital city, as well as measures of uncertainty that are more closely tied to financial markets. The article also presents some novel estimates of sentiment about monetary policy news, which appear to help predict changes in the cash rate even after accounting for other important factors, such as the RBA's forecasts for the economy.
Measuring News Sentiment
Sentiment is hard to measure as it is not directly observed. Common survey-based measures of sentiment typically ask respondents about their beliefs about current economic conditions as well as expectations for future economic conditions. This article takes a different approach and constructs a proxy for sentiment based on the language used by journalists in news reports on the economy.
There are two general approaches for quantifying sentiment in text – the dictionary (or lexicon) and the machine learning-based approaches. The dictionary-based approach relies on pre-defined lists of words with each word either classified as positive, negative, neutral, or indicating uncertainty. The machine learning approach predicts sentiment of any given set of text after training models with a large set of text that has been assigned sentiment ratings by human readers. For example, models have been developed using social media data, such as Twitter, that provide text that is combined with user feedback to identify the sentiment of the posts. This approach is better able to capture the nuances in human language but it is more complex and less transparent.
This article follows the simpler dictionary-based approach to construct an NSI. The NSI measures the net balance of words used by journalists that are considered to be `positive’ and `negative’. When journalists use more positive words and/or fewer negative words, this is an indicator that sentiment is rising in the economy. This type of index has been used before for other countries, such as the United States, Japan and Europe (see, for instance, Scotti (2016); Shiller (2017); Buckman et al (2020); Larsen and Thorsrud (2018); and Fraiberger (2016)).
The raw data used in constructing the NSI consist of daily news extracted from the Dow Jones Newswires Archive (DNA). Each article listed in the database includes metadata such as publication time, language, region and category. After removing duplicates and selecting only articles that are written in English by Australian media outlets to cover the Australian economy, the resulting dataset includes around 300,000 articles. The data span the period from September 1987 to April 2020 and the sample covers more than 600 newspapers, though The Australian, The Sydney Morning Herald and The Australian Financial Review are the main sources.
Common steps in the natural language processing literature are taken to clean the raw dataset before analysis: numbers, punctuation marks, white spaces, and common stop words are removed from each article. All words are then reduced to their respective ‘stem’, which is the part of a word that is common to all of its inflections (for example, `performs’, `performing’, and `performed’ are reduced to `perform’).
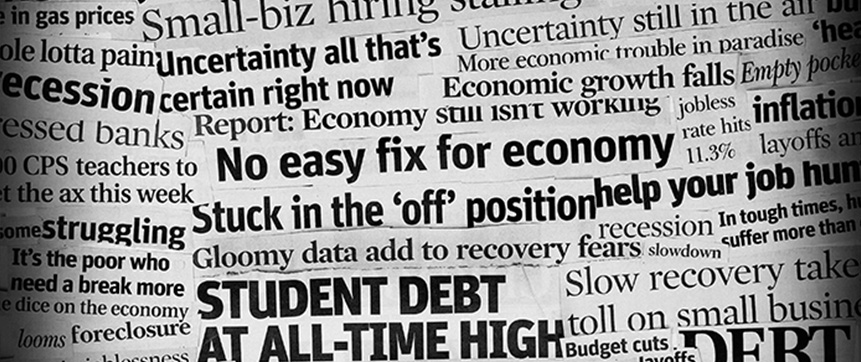
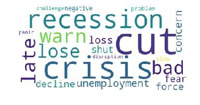
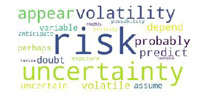
To measure the sentiment of a set of text, that is, whether or not the news is positive or negative, the Loughran–McDonald dictionary is used. This is a word list specific to the domain of economics and finance (see Loughran and McDonald (2011) for more details). The NSI is constructed by counting the number of times that negative and positive words appear in the cleaned text of articles. A news uncertainty index (NUI) is also constructed by counting the number of articles that contain uncertain words. The most common positive, negative and uncertain words in March 2020 are shown in (Figure 1).

To construct the time-series of NSI, the articles are sorted by date of publication and the data are divided into blocks of time, which could be a day. For each time period (t), we compute the sentiment index by subtracting the count of negative words from the count of positive words and then dividing by total word count:
Between September 1987 and March 2020, on average there are around two more negatives than positives for every 100 words in the articles, with a standard deviation of less than one word. The raw data indicate a trend towards relatively more negative words over time so the series is de-trended. The indicator is also standardised to have a mean of zero and a standard deviation of one.
News Sentiment and Economic Conditions
The news sentiment index clearly moves with fluctuations in economic conditions at a monthly frequency, with sharp declines in economic downturns, such as the early 1990s recession, the 2008/09 Global Financial Crisis (GFC) and the pandemic-led contraction more recently (Graph 1).

As mentioned above, the NSI can also be constructed on a daily basis. Because of this, the NSI has the potential to identify turning points in economic activity before other partial indicators, such as survey-based sentiment measures that are available on a monthly basis. For example, based on a 30-day moving average, the NSI was pointing to a sharp drop-off in activity caused by the COVID-19 pandemic in early March, well before the public release of the business survey results at the end of March (Graph 2, right panel). Similarly, the 30-day moving average of the NSI appeared to pick the turning point in economic activity in February 2009 before there were clear signs of a recovery in sentiment based on the business surveys (Graph 2, left panel).

The NSI can tell us about the state of the economy today, but econometric analysis shows that it can also predict changes in other closely watched economic indicators, such as the unemployment rate, one month ahead (see Appendix B). This is true even controlling for other timely indicators of the economy. Relatedly, the NSI can also help with dating business cycles.
News Uncertainty
A measure of news uncertainty can also be constructed based on high-frequency information contained in news articles. The NUI is constructed in a slightly different fashion to the NSI. The NUI is estimated by calculating the share of articles that express uncertainty (through terms such as ‘risk’, ‘uncertainty’ and ‘volatility’), rather than the share of words that express uncertainty. This is due to the more limited number of times that words expressing uncertainty appear in news articles.
In March 2020, the NUI rose to a record high level indicating that the pandemic has caused more economic uncertainty among Australian households and businesses than during the GFC (Graph 3). The NUI also strongly correlates with publicly available measures of economic uncertainty, such as the Economic Policy Uncertainty Index developed by Baker, Bloom and Davis (2016). Both uncertainty indicators eased in April.

Similar to the NSI, the NUI appears to have some predictive power for general business conditions. For example, analysis based on Vector Autoregressive Regressions suggests that increases in the NUI are associated with subsequent declines in survey-based measures of business investment that are available on a monthly basis (see Appendix B).
Housing News Sentiment
Based on the same text-analysis framework, NSIs can be constructed for specific sectors and regions. Shifts in sentiment are believed to be important in housing markets (Soo 2018). As such, a housing news sentiment index (H-NSI) has been developed using housing market-related news articles.[1] The H-NSI indicates that sentiment in the Australian housing market deteriorated towards the end of March 2020 (Graph 4). This is consistent with other high-frequency indicators, such as weekly auction clearance rates, that suggested a sharp decline in housing activity soon after the coronavirus containment measures were put in place in Australia.

Housing news sentiment can also be constructed for individual capital cities (and regional areas) based on samples of local newspapers (e.g. The Sydney Morning Herald for Sydney and The Age for Melbourne). The local housing news sentiment captures key fluctuations in local house prices for Sydney and Melbourne (Graph 5). Similar measures appear to capture local housing price cycles in the United States (Soo 2018). However, based on current estimates, the local H-NSI are less correlated with housing price growth in other capital cities.

![]() Banking News Sentiment and Uncertainty
Banking News Sentiment and Uncertainty
Along similar lines, news sentiment and uncertainty can be estimated for articles that specifically mention the banking sector through related terms (see Appendix A). Banking-related articles account for about 5 per cent of total economics news-related articles. Notably, in recent months, banking news sentiment has dropped but not to the same levels seen during the GFC, while banking news uncertainty has risen to a high level. And there are times in the past in which banking sector sentiment fell and uncertainty rose relative to other sectors of the economy. For instance, this can be clearly seen during the Banking Royal Commission period between 2017 and 2018 (Graph 6). This suggests that there are meaningful differences in news sentiment and uncertainty across sectors.

Monetary Policy News Sentiment
Finally, a monetary policy news sentiment index (MP-NSI) has been developed for articles that mention terms specifically related to monetary policy, such as ‘monetary policy’, ‘cash rate’, and ‘RBA’. These articles account for about 15 per cent of total articles about the economy. The resulting index is quite volatile from month to month (Graph 7). Despite this, the index is correlated with the stance of monetary policy as measured by ‘monetary policy shocks’ (for example Romer and Romer (2004) for the United States, and Bishop and Tulip (2017) and Beckers (2020) for Australia). These ‘shocks’ capture changes in the cash rate that are not systematically related to changes in the RBA's forecasts for economic activity and inflation. This suggests that in setting monetary policy the RBA takes into account additional, qualitative information about the future direction of the economy (over and above what is captured in the RBA's forecasts), that is also evident in news articles; some of this information might be taken into account in the Bank's assessment of risks around the central forecasts, but not in the central forecasts themselves. Research on US monetary policy similarly suggests that the tone of the narrative around the Federal Reserve's forecasts predicts their forecast errors for GDP growth and unemployment (and explains the Federal Reserve's policy decisions over and above their forecasts) (Sharpe, Sinha and Hollrah 2018).

Conclusion
The NSIs introduced in this article can be useful in times of sudden economic change as is currently being experienced in Australia and around the world. The NSI appears to be useful both to understand the current state of the economy and to help predict economic conditions in the near term. The sharp decline in news sentiment in 2020 coincides with the significant ramp-up in news coverage of the COVID-19 pandemic and its economic impact. Some related indicators, such as the NUI and the housing NSI, are also useful real-time indicators of the economy.
Appendix A: List of Terms Used to Identify News Topics
Table A1 shows the terms we use to construct sector or topic specific news indicators. Terms are simplified to lower case and singular. Compound terms must be matched in whole.
| Housing market | Banking | Monetary policy |
|---|---|---|
|
housing
house real estate townhouse apartment |
banking
bank financial institution cba nab anz wbc commonwealth bank of australia westpac australia and new zealand banking group national australia bank (EXCLUDES "central bank") |
monetary
monetary policy cash rate rba central bank reserve bank of australia |
Appendix B: Granger-Causality Tests
Vector autoregression (VAR) models are used to test Granger-causality between the variables. Table B1 presents the Granger-causality results of three equations with key macroeconomic measures as dependent variables and NSI or NUI as explanatory variables. The VAR system is estimated at a monthly frequency and includes survey-based measures of consumer and business sentiment as control variables, and five lags of all variables.
The marginal significance levels are reported for the hypothesis that all five lags of the given right hand side variable can be excluded. In other words, the excluded variable does not Granger-cause the equation variable.
| Equation variable | Excluded variable | F | Marginal significance level |
|---|---|---|---|
| Change in unemployment rate | NSI | 3.82 | 0.00 |
| NAB investment activity index* | NUI | 2.46 | 0.03 |
| Ai Group Performance of Construction index** | NUI | 2.69 | 0.02 |
|
* This index is a survey-based indicator of capital expenditure, conducted by NAB.
|
|||
At the 5 percent level of statistical significance, all three null hypotheses are rejected, suggesting that the NSI Granger-causes changes in the unemployment rate and the NUI Granger-causes both of the business investment indicators.
Footnotes
The authors work in Economic Research Department. [*]
Housing-related articles are defined by Dow Jones' real estate subject code. This code is determined by a proprietary algorithm that is consistent across newspapers and over time. It excludes routine real estate property listings. Housing-related articles can also be identified using other methods such as simple term searches and more sophisticated topic modelling. These methods yield similar results but the Dow Jones classification of real estate articles is found to be the most robust over time and across different newspapers. [1]
References
Baker SR, N Bloom and SJ Davis (2016), ‘Measuring Economic Policy Uncertainty’, Quarterly Journal of Economics, 131(4), pp 1593–1636.
Barsky RB and ER Sims (2012), ‘Information, Animal Spirits, and the Meaning of Innovations in Consumer Confidence’, American Economic Review, 102(4), pp 1343–1377.
Beckers B (2020), ‘Credit Spreads, Monetary Policy and the Price Puzzle’, RBA Research Discussion Paper No 2020-01.
Benhabib J and MM Spiegel (2019), ‘Sentiments and Economic Activity: Evidence from U.S. States.’, The Economic Journal, 129(618), pp 715–733.
Bishop J and P Tulip (2017), ‘Anticipatory Monetary Policy and the ‘Price Puzzle’ ', RBA Research Discussion Paper No 2017-02.
Bloom N (2014), ‘Fluctuations in Uncertainty’, Journal of Economic Perspectives, 28(2), pp 153–176.
Buckman SR, AH Shapiro, M Sudhof and DJ Wilson (2020), ‘News Sentiment in the Time of COVID-19’ FRBSF Economic Letter, Research from Federal Reserve Bank of San Francisco site, 4.
Buckman SR, AH Shapiro, M Sudhof and DJ Wilson (2020), ‘News Sentiment in the Time of COVID-19’, Federal Reserve Bank of San Francisco Economic Letter 8.
Fraiberger SP (2016), ‘News Sentiment and Cross-Country Fluctuations’, in Proceedings of 2016 EMNLP Workshop on Natural Language Processing and Computational Social Science, Association for Computational Linguistics, pp 125–131.
Haddow A, C Hare, J Hooley and T Shakir (2013), ‘Macroeconomic uncertainty: what is it, how can we measure it and why does it matter?’, Bank of England Quarterly Bulletin Q2.
Larsen V and A Thorsrud (2018), ‘Business cycle narratives’, Norges Bank Working Paper Series 3.
Loughran T and B McDonald (2011), ‘When is a Liability Not a Liability? Textual Analysis, Dictionaries and 10-Ks’, The Journal of Finance, 66(1), pp 35–65.
Moore A (2017), ‘Measuring Economic Uncertainty and Its Effects’, Economic Record, 93(303), pp 550–575.
Roberts I and J Simon (2001), ‘What do Sentiment Surveys Measure?’, RBA Research Discussion Paper No 2001-09.
Romer DC and DH Romer (2004), ‘A New Measure of Monetary Shocks: Derivation and Implications’, American Economic Review, 94(4), pp 1055–1084.
Scotti C (2016), ‘Surprise and uncertainty indexes: Real-time aggregation of real-activity macro-surprises’, Journal of Monetary Economics, 82, pp 1–19.
Shapiro AH, M Sudhof and D Wilson (2017), ‘Measuring News Sentiment’, Federal Reserve Bank of San Francisco Working Paper Series 2017-01.
Sharpe SA, NR Sinha and CA Hollrah (2018), ‘What's the Story? A New Perspective on the Value of Economic Forecasts’, Board of Governors of the Federal Reserve System Finance and Economics Discussion Series 2017-107.
Shiller RJ (2017), ‘Narrative Economics’, American Economic Review, 107(4), pp 967–1004.
Soo CK (2018), ‘Quantifying Sentiment with News Media Across Local Housing Markets’, Review of Financial Studies, 31(10), pp 3689–3719.
Thorsrud LA (2018), ‘Words are the New Numbers: A Newsy Coincident Index of the Business Cycle’, Journal of Business and Economic Statistics, 38(2), pp 393–409.