RBA Annual Conference – 1994 Openness and Growth Steve Dowrick
1. Introduction – Opening Up the Australian Economy
Opening up the Australian economy to international trade has become one of the cornerstones of economic policy over the past decade. Tariff protection and assistance to the manufacturing sector, for instance, have already fallen dramatically and are intended to be reduced to negligible proportions by the end of the century. Whereas average effective rates of assistance were over 20 per cent in 1984, they are currently below ten per cent and are projected to fall to five per cent.[1]
The volume of trade has expanded rapidly. In 1981, less than 14 per cent of output was produced for export, much the same as the ratio that had been exported in 1970. By 1993, however, the share of exports in GDP had risen above 20 per cent.[2] Some two-thirds of the increase in exports went to East Asia, the most rapidly growing region in the world.
The mining industry, along with mining-related manufacture, has taken over from agriculture as the dominant exporting sector. Exports of cars and other more high-tech goods are increasing rapidly, albeit from a small base, but Australia remains a substantial net importer of manufactures such as electrical and capital goods.
Following on the work of Australian trade theorists such as Max Corden, Murray Kemp and Peter Lloyd, it has become an article of faith in most economic and policy circles that opening up the economy to international trade will produce substantial benefits in terms of greater consumer choice and higher living standards. Higher productivity is expected to be realised through competitive pressure and through opportunity to specialise in productive activities where we have a comparative advantage or where we can gain from economies of scale.
Belief in the beneficial effects of trade liberalisation has been fuelled by comparisons of the relatively moribund post-war performance of the protected and isolated Australian economy with the dynamic growth in trade and living standards in the economies of East Asia. Such casual empiricism can, however, be quite misleading as it ignores a host of other explanations for the East Asian economic ‘miracles’ including the opportunity for less developed economies to import technology as they industrialise. It is also recognised by the World Bank (1993) that governments of some of these fast growing economies have in fact intervened heavily in trade and have protected domestic industry, especially in the early stages of industrialisation.
There is nevertheless a strong consensus amongst economists that openness to trade, even if combined with elements of direction and protection, tends to promote economic welfare. There are indeed good theoretical reasons to believe that trade liberalisation should increase economic welfare under a wide range of plausible circumstances. It has, however, proved rather more difficult to come up with good reasons why such welfare gains should be at all sizeable. Conventional economic modelling typically estimates the benefit of trade liberalisation as an increase in the level of national income of around one per cent. Whilst such figures are not negligible, they are hardly the basis on which to justify a radical restructuring of the economy with all of its inevitable adjustment costs. So trade optimists have a long tradition of appealing to beneficial effects of trade on the growth prospects of the economy.
Concepts of ‘dynamic gains from trade’ and ‘dynamic comparative advantage’ have long been bandied about as justifications for trade liberalisation, just as trade pessimists and protectionists have supplemented their analyses of terms of trade deterioration and strategic advantage with concepts of ‘immiserising growth’. It is only recently, however, that developments in the modelling of long-run growth have enabled a more formal examination of the consequences of trade for growth.
The main purpose of this paper is to survey some of these recent developments in the economic theory of trade and growth to see if they do provide a sound basis for trade optimism. These new growth theories are contrasted with the conventional static models of trade. The paper then goes on to examine evidence on the link between countries' trade policies and their economic performance before presenting some new empirical results.
The broad conclusion that emerges from the theoretical survey is that trade liberalisation can indeed stimulate growth in the aggregate world economy by enhancing the international flow of knowledge and innovation and by allowing economies of specialisation, not only in the production of goods, but also in the generation of new knowledge and new inputs into production. Whilst trade may have such positive benefits for some countries, it may conversely lock other countries into a pattern of specialisation in low-skill, low-growth activities. To avoid the low growth trap, it is important to link trade liberalisation with appropriate policies on education, training and research and development; otherwise, failures in the markets for investment in skills and knowledge may be compounded by inappropriate trade-induced specialisation.
Empirical estimates of growth returns to trade liberalisation emphasise that such returns are not automatic for all countries. Nevertheless, it is not unreasonable to suppose that with appropriate supporting policies the process of trade liberalisation on which Australia has embarked might raise the long-run annual rate of growth by one half of a percentage point.
2. Estimates of the Gains from Trade – Based on Static Models of the Economy
The standard textbook treatment of gains from trade deals with comparative advantage and the efficiency loss associated with tariffs or other impediments to mutually advantageous trade. I shall use the familiar tool of partial equilibrium analysis, illustrated in Figure 1, for expository purposes.[3] Treating the line MC as the world price of an imported good, a distortion such as a tariff raises the domestic price by the amount τ to p. Demand falls by ετ, where ε is the elasticity of demand. The size of the efficiency loss, in a partial equilibrium analysis, is the area of the triangle C = ετ2/2. So if the tariff is ten per cent and the elasticity of demand is unity, the welfare loss is half of one per cent of consumer expenditure.
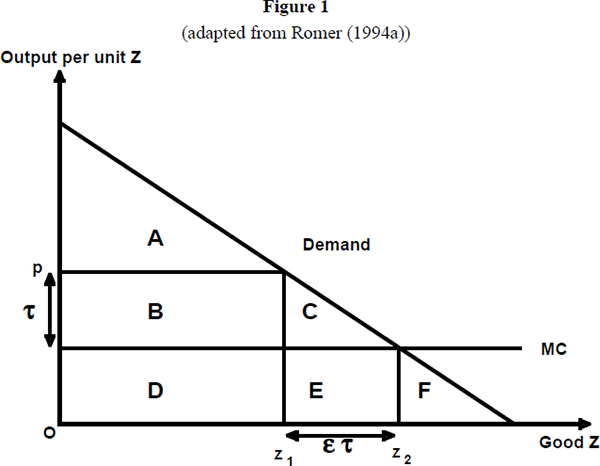
The small magnitude of such losses from trade restrictions is an example of the principle that Harberger applied to both trade and monopoly power. The result extends from this partial equilibrium analysis to general competitive equilibrium analysis as well, allowing for domestic supply responses and income effects on consumer demand. If an economy starts from a competitive pareto-efficient position, then any small distortion will have only second-order effects, of the order of magnitude of the square of the tariff rate.
Baldwin (1992a, p. 162) refers to the body of empirical research which ‘consistently find[s] that trade liberalizations raise aggregate income by an amount that is negligible (0.1 per cent …) or small …’.
The difficulty of finding sizeable gains from trade in conventional economic models is highlighted by a recent World Bank paper by Martin and Yanagishima (1993). Appreciating the point that efficiency gains will usually be tiny unless supply and demand elasticities are large, the authors develop a CGE model on which they impose elasticities ranging from 3 to 6. They acknowledge that these elasticities are substantially larger than those typically estimated by econometric studies, but they fall back on the CGE modellers' favourite observation – that errors in the measurement of variables will tend to lead to under-estimation of parameters in econometric models. Despite their courageous efforts to overcome such econometric deficiencies, the model predicts that liberalisation of trade in the Pacific region will typically yield welfare gains of less than one third of one per cent. In the case of Australia and New Zealand the model actually predicts (tiny) welfare losses from Pacific trade liberalisation due to adverse effects on the terms of trade.
2.1 Second-Best Welfare Gains
It is of course possible to construct models where the welfare loss from the tariff is substantially larger. For example, if there are pre-existing distortions to the idealised competitive economy, the private marginal cost (MC) faced by consumers may exceed the true social cost (e.g. if consumers face distortionary taxation). The loss of consumer surplus due to the imposition of the tariff may now be represented in Figure 1 by C + D + E . We have added to the Harberger triangle a second-best rectangle whose height is determined by the pre-existing distortion between social and private marginal costs. In this case, the efficiency loss due to the tariff may be substantially higher than the first-best analysis indicated.
In a second-best world, policy interventions can have first-order effects. This does not necessarily imply, however, that the case for trade liberalisation is strengthened. Rather, second-best analysis suggests that the stakes are higher. Without a full understanding of the whole range of market imperfections we cannot be sure that trade liberalisation may not move the economy away from, rather than towards, the first-best position.
2.2 Product Differentiation, Monopolistic Competition and Increasing Returns to Scale
Nevertheless, it is clearly not desirable to use the complexity of second-best analysis to paralyse all policy initiatives on the grounds that any change might make things worse. Most economists would probably have a strong presumption that lowering tariffs will in most circumstances move the economy in the desired direction. This presumption is strengthened by the analysis of trade in differentiated products with increasing returns to scale – a case which probably applies to a large proportion of modern trade in manufacturing. Lowering trade barriers allows consumers in a small economy access to a wide range of products at non-tariff prices and, at the same time, allows the domestic producers to exploit economies of scale by concentrating production on a small range of goods for export.[4]
Overall, trade liberalisation can account for a substantial increase in intra-industry trade and lowering of costs in both home and foreign industries. Referring to Figure 1, the gains from liberalisation may again be represented by triangle C plus a rectangle D+E where the height of the rectangle is the fall in domestic costs of production occasioned by the opportunity to exploit economies of scale.
Applied researchers such as Harris and Cox (1985) investigating the Canadian economy have estimated gains from trade liberalisation of the order of magnitude of five per cent when economies of scale are realised by the expansion of intra-industry trade.
Tyers (1993) has applied such an approach to the Australian economy. He builds a calibrated CGE model where there are substantial unrealised scale economies in most Australian manufacturing industries. Trade liberalisation is predicted to actually reduce GDP by around one per cent, largely because of net reductions in the capital stock as the loss of protection hits the more capital intensive industries. The measure of GDP includes, however, returns to foreign owners (lenders) who have financed the capital intensive industries. A better measure of economic welfare is provided by GNP which does increase in response to the removal of tariffs, although the gains are less than one half of one per cent. Moreover, if trade liberalisation is accompanied by more competitive pricing behaviour by Australian firms, then income rises by an additional one or two per cent.
The low estimate of the direct returns to Australian trade liberalisation, despite the opportunity to realise economies of scale, is probably due to the relatively small size of the Australian manufacturing sector, only 15 per cent of GDP, which is where the economies of scale are presumed to exist. Tyers estimates for Korea, where manufacturing value added constitutes 30 per cent of GDP, that income would increase as a result of liberalisation by over three per cent.
2.3 Terms of Trade and Strategic Trade Policy
It is well known that the optimal tariff or export subsidy may not be zero if we relax the assumption of a small country to allow the terms of trade between imports and exports to change. Equivalently, with oligopolistic competition in product markets, the relative prices and strategic responses of home and foreign rivals' products may be altered by domestic trade policy. In such cases, rents (represented, for example, by rectangle B in Figure 1, treating demand as coming from the rest of the world) may be increased by appropriate tariffs.
These strategic or terms-of-trade concerns are probably appropriate, though complex, for large trading blocs such as NAFTA or the EC, or the homes of major exporting manufacturers. There is little suggestion that a small country such as Australia stands to gain much from such strategic interventions.
2.4 New Non-Rivalrous Goods
A very recent paper by Romer (1994a) argues that the gains from trade may be much higher than in traditional competitive analysis if we include the possibility of new non-rivalrous inputs into production. Such goods might be traditional public goods such as bridges, or they might be the knowledge required to set up a new manufacturing process, or the blueprint for a new product, or a dealership network to distribute conventional goods.[5] The technological representation of non-rivalry in production is the existence of a large fixed cost and constant marginal costs. Romer's basic premise is that such non-rivalrous inputs are at the heart of economic progress.
The development of new non-rivalrous inputs can drive long-run growth. But even in a static framework, Romer argues the potential importance of such inputs for welfare analysis. Referring again to Figure 1, although the owner of the newly created good may possess sufficient market power so as to price above marginal costs, competition between producers and arbitrage amongst consumers will in general prevent the owner from realising the full consumer surplus associated with the new good. The area A in the figure is the Dupuit triangle, named after the 19th century French engineer who developed cost-benefit analysis for investment in non-rivalrous goods such as bridges. The size of the Dupuit triangle captures the likely extent of market failure in the provision of new goods.
Romer develops a simple mathematical model to illustrate the possible range of welfare losses due to tariffs in an economy which imports its capital goods. With a fixed range of goods, the welfare loss from a ten per cent tariff is one per cent of national income. When, however, the possibility for the introduction of new non-rivalrous goods is impeded by tariffs, the cost of protection rises to nearly 20 per cent of national income. This example illustrates the more general point that Dupuit triangles associated with innovative goods are expected to be an order of magnitude larger than the welfare losses associated with Harberger triangles. Romer suggests that these ‘static’ welfare costs associated with traditional analyses of non-rivalrous goods are at the heart of the welfare analysis of economic growth.
3. Models of Endogenous Growth and Trade
Given the problems of finding large scale gains from static models of trade liberalisation, there has been a long tradition of appealing to ‘dynamic gains’ to justify trade optimism. Such gains may be associated with capital accumulation, with external economies of scale, with learning by doing, or with technology transfer. In many formal models, the dynamics are transitional in the sense that the model will eventually approach a steady state level, as in the Solow-Swan model of growth. Dynamic gains have also been analysed in the sense of changing the long-run growth path of the economy, as in the work of Schumpeter (1934) and Kaldor (1981). There has been a tremendous upsurge of interest in formal economic modelling of long-run growth over the past five years, typically under the labels of ‘new growth models’ or ‘the theory of endogenous growth’.
3.1 New Theories of Endogenous Growth
The essential feature of supply-side models of economic growth is the accumulation of factors of production; generic capital that might consist of machines and buildings and infrastructure, but can also consist of human skills and knowledge. Any policies which affect the rate of accumulation will affect rates of growth, for example taxation which alters the private returns to capital accumulation.[6]
An awful lot of heat and some light have been generated by the recent round of formal modelling of the processes of economic growth.[7] There are two distinguishing features to these models: first, the technical features which provide sufficient conditions for accumulation to generate long-run growth; and second, an emphasis on the accumulation of non-tangible capital such as skills and knowledge.
Whereas a previous generation of economic theorists, notably Schumpeter and Kaldor, had raised many of the ideas about which the latest generation are now getting excited, genuine innovation has occurred in the mathematical modelling of long-run growth. This has been particularly important in overcoming the long-run investment pessimism associated with decreasing returns to accumulation in the Solow-Swan model.
Romer, Lucas, Barro and others have extended the neo-classical growth model, characterised by formal modelling of investment decisions by a forward looking, rational agent, to clarify the conditions that are required for long-run growth to occur. Hammond and Rodriguez-Clare (1993) have produced a coherent synthesis of the technical features of these models of endogenous growth.
The driving force of all these models is capital accumulation. By building up stocks which increase productive capacity, and using that enhanced capacity to further build up stocks, it may be possible that incentives to continue investing are sufficient to generate continuous growth, but it is also possible that decreasing returns to capital may inhibit growth in the long run. Much of the recent theoretical literature is concerned with the technical conditions under which accumulation can drive growth.
It is important to distinguish between three principal forms of capital:
- physical capital, produced by investment in equipment and structures;
- human capital, generated by education and training and learning by doing; and
- disembodied knowledge, or blueprints, generated by research and development and/or learning by doing.[8]
It is also useful to distinguish between three different sorts of technological interaction:
- flexibility in the production of final goods – the extent to which capital can substitute for fixed factors of production such as labour and natural resources. Models based on production flexibility typically follow in the tradition of the Solow-Swan model and are usually compatible with perfect competition.
- feedback in the accumulation of capital – the extent to which the stock of capital reduces the cost of generating further capital. Feedback models are often used in a neo-Schumpeterian framework where new goods and new ideas produce further goods and further ideas and they typically involve temporary monopoly power.
- spillovers in the production of final goods – the stock of capital owned by one producer affects the productivity of other producers. Models based on spillovers use notions related to the Kaldorian concepts of external economies and Verdoorn's law of dynamic economies of scale.
I shall give a brief summary of three cases where endogenous growth occurs.
Case 1: capital flexibility generates long-run growth
Long-run growth is not feasible if increasing capital intensity drives the marginal product of capital to zero (the Inada condition). This occurs if capital is not readily substituted for labour, for example in the case of a Cobb-Douglas production function. Labour is ‘essential’ in production, in the sense that the marginal product of capital approaches zero as the ratio of capital to labour rises. In the absence of feedback or spillover the long-run growth of output is constrained by the growth of the labour supply and by the growth of exogenous technology. Agents can accumulate human capital and physical capital as much as they like, but they will always run aground on the rock of diminishing returns in the long run. Hence the ‘investment pessimism’ traditionally associated with the Solow-Swan model.
If, on the other hand, the elasticity of substitution between fixed and accumulable factors exceeds unity, then the marginal product of capital no longer declines to zero; labour is no longer ‘essential’. In effect, robots can replace humans on the production line; they can even replace humans in the production of further robots. Of course, labour is still required to organise and direct the production process; but the essential point is that if there is sufficient substitutability between capital and labour, then investment will always contribute to growth. This case is analysed by Pitchford (1960) and more recently by Jones and Manuelli (1990). As long as the return on investment is above the inter-temporal discount rate, then rational agents should choose to invest and the economy will keep on growing.
Case 2: investment feedback generates long-run growth
Feedback might occur where training or research activity increases the individual's stock of knowledge or human capital. It may be the case, for instance, that the larger the stock of knowledge, the easier it is to increase it. Better educated and more knowledgable people learn faster and develop new ideas more easily. An appealing idea is that existing knowledge and understanding, combined with further education and research, generate further knowledge.
Romer (1990, 1993) has particularly argued the case that such feedback is a vitally important feature of the generation of new ideas or blueprints which are intermediate inputs into the production of capital goods but are also inputs into the production of the next generation of blueprints. Grossman and Helpman have modelled direct feedback in the generation of new goods.[9] Learning by doing can be interpreted as a feedback mechanism too.
Case 3: investment spillovers generate long-run growth
The idea here is that the productivity of fixed factors such as labour may be enhanced by spillover benefits from the capital accumulation of other agents. There are several features of investment which may produce such spillovers. The public good qualities of knowledge are a prime example, suggesting positive spillovers from R&D or from learning by doing.
Not surprisingly, private investment decisions which ignore positive spillover benefits to other producers generate a sub-optimal rate of growth. On the other hand, in some circumstances new ideas may be substitutes rather than complements, as in the case of patent races or quality upgrading, in which case the common pool problem implies that there may be over-investment in research.
3.2 The Contribution of Trade to Growth
In the standard neo-classical tradition, the Hecksher-Ohlin-Samuelson analysis, trade will affect the level and composition of output and welfare, but not long-run growth. The new growth models have something in common with the classical tradition of Ricardo and Marx, as developed by Lewis (1980) in his Nobel lecture, where trade can increase the rate of profit and hence the rate of investment and growth.
We can usefully distinguish two sorts of trade-growth models. On the one hand, there are those models that follow Adam Smith in emphasising the role of trade in enabling specialisation which yields increases in productivity through learning by doing or through specialisation in research. Such models rely on spillover and/or feedback mechanisms to generate cumulative increases in productivity and specialisation.
On the other hand, there are Ricardian models where comparative advantage leads to specialisation in particular activities. Some activities are characterised by higher rates of productivity growth, hence countries which specialise in these will tend to grow faster. However, productivity growth is not derived from the specialisation per se; it is an inherent feature of each activity.
3.3 Specialisation as a Source of Growth
This idea lies behind the notion of internal economies of scale in production. Access to foreign markets allows the realisation of potential economies as each country concentrates on the activities in which it has comparative advantage. In traditional models, realisation of scale economies affects levels rather than long-run growth, but if there are sufficient feedback or spillover effects (for example through the development or acquisition of machine tools which enable production of superior tools), then the opportunity to specialise through trade may raise long-run growth.
Rivera-Batiz and Romer (1991) and Rivera-Batiz and Xie (1992) concentrate on the non-rival nature of knowledge as the prime determinant of growth. In their models, the primary growth-enhancing effect of trade in final goods arises because it enables countries to specialise in production and to avoid the duplication of R&D efforts which would occur if each had to produce the entire range of goods for its domestic market.
3.4 Dynamic Comparative Advantage as a Source of Growth
In these Ricardian models, where countries specialise in faster or slower growing activities, a key determinant of patterns of growth is the extent to which skills and knowledge spill over national boundaries. In the case where there are no impediments to the transfer of knowledge – that is, where knowledge is a global public good – the predicted pattern of specialisation in production and trade depends on relative supplies of the other factors of production: natural resources, labour and human capital (or skilled labour). Grossman and Helpman (1991a) find that their analysis of dynamic comparative advantage does not necessarily overturn the traditional Hecksher-Ohlin predictions of static trade theory. Countries with relatively high endowments of skilled labour will specialise in production of innovative or high-technology goods, whilst others will specialise in production of traditional manufactured (unskilled labour intensive) goods or resource based goods.
The rate of growth of output (real GDP) will be higher in the skill-intensive country which specialises in innovative products. Grossman and Helpman (1991a) cite the experience of the Japanese economy in the 1960s and 1970s as it rapidly built up its skill base and transformed the structure of output towards innovative products. But a crucial point in their welfare analysis of trade and specialisation is that this does not necessarily mean that the ‘high-tech’ country will be better off than the labour or resource-intensive countries. In a long-run equilibrium with free trade, their model predicts similar rates of growth of real consumption for all countries. The point here is that with free trade in goods and free transmission of knowledge, it does not matter to consumers whether they are located in the labour-intensive or skill-intensive country; they can enjoy the benefits of innovation through the purchase of traded goods. Faster growth of output in the skill intensive country is offset by deteriorating terms of trade. High-tech goods become relatively cheaper, controlling for quality, in direct proportion to their faster rate of innovation.
These conclusions change somewhat if knowledge is not transmitted freely across national boundaries. With knowledge a national public good, but not an international public good, the more technologically advanced country will have a comparative advantage in the production of further knowledge; hence it will tend to extend its technological lead and expand its share of world production of the innovative products. This cumulative causation will, in a simple model where no knowledge spills over to other countries, lead to a situation of complete specialisation. The country with a head start in the accumulation of knowledge will tend to widen its lead, unless the laggard country's government intervenes to overcome the initial disadvantage.
In Young's (1991) model of learning by doing, where the learning does not spill over national boundaries, a similar prediction emerges: the larger and more advanced countries will grow faster as a result of free trade. They have a comparative advantage in the industries with learning by doing economies of scale, so those industries will expand in response to the opening up of trade and the realisation of further economies will compound their comparative advantage.
Thus, where knowledge is contained within national boundaries, success can breed success. It also follows that intervention can affect the subsequent growth path. Countries are not necessarily constrained by an exogenous factor endowment. However, once again, it does not necessarily follow that gaining a technological lead will make a country better off. International trade in assets and goods still allows the residents of the country that specialises in the production of labour-intensive ‘traditional’ goods to invest their savings in foreign assets and to import the new and cheaper innovative goods.
If private incentives for accumulation of human and knowledge capital reflect social costs and benefits, then, although it may be possible to increase output growth by intervening to change the pattern of dynamic comparative advantage, doing so can actually reduce welfare.
In practice, however, capital market imperfections typically imply sub-optimal investment in human capital; given that human capital is a complement to research, there is then a presumption that incentives to invest in R&D are also sub-optimal, compounding failures in the market for knowledge. A ‘revealed comparative disadvantage’ in knowledge-intensive production may in fact reflect these market failures. In this case, trade liberalisation may lower welfare if it encourages specialisation in low-learning, low-knowledge industries which further decreases incentives for investment in human capital and knowledge.
3.5 Summary
The general import of these models is that trade liberalisation should increase world growth and welfare in aggregate. In the neo-Smithian analysis, everyone grows faster as a result of economic integration. This is also true if trade speeds the international diffusion of knowledge. In the neo-Ricardian analysis, however, some countries whose comparative advantage is in low-growth activities may find that their growth is retarded. Low growth need not be a welfare problem if markets are complete: the citizens of that country will gain from falling prices of the high-tech goods which are more efficiently produced elsewhere. It is only a problem if there are market failures in the acquisition of skills and knowledge which are compounded by trade specialisation. If so, a ‘lucky’ country with abundant natural resources, like Australia, may find itself locked out of the areas of dynamic learning and growth.
4. The Welfare Economics of Growth
Because growth rates compound over time to produce large differences in levels, it is tempting to presume that policies which affect growth must necessarily be more important than policies which only affect levels; hence much of the policy interest in the new wave of theorising about the causes of economic growth. The presumption that growth matters more than levels is not necessarily well founded. There are two related reasons. First, our social welfare calculus will typically discount future income gains. Second, we have to offset the discounted gains from growth with the current costs of the investment (that is, the consumption foregone in order to generate that growth).
If our benchmark is that of a fully competitive, perfect information world, then just as deviations from the static equilibrium position will have only second-order effects, so too will deviations from the dynamic growth path of the economy in terms of net present values. This point is made by Baldwin (1992a) in his analysis of the transitional dynamics of a model with decreasing returns to investment (one which does not, therefore, exhibit long-run growth).
Indeed, Baldwin makes the point which should be familiar from a careful reading of the welfare economics of static models, that trade liberalisation effects are likely to be significant only if there are pre-existing distortions in the economy. If, for example, the social rate of return exceeds the private rate of return (or, presumably, if the social discount rate is less than the private discount rate) and if trade raises profitability, then the extra investment induced by trade will yield a dynamic welfare gain to complement the standard static efficiency effect.
For example, Baldwin suggests that the static output effect of the 1992 EC trade agreement may be to increase GDP by around 4 per cent. Increased profitability should also increase investment, and he calculates that this dynamic effect will in the long run add around 2 per cent to steady-state GDP levels. So the dynamic output effect is around one half of the static effect. But, because the extra investment has to be paid for, and because the returns are realised later, Baldwin estimates that the welfare impact of the dynamic effects is minimal.
Of course, if there are major distortions or information problems in capital markets or substantial externalities in the process of capital accumulation, which raise social returns above private returns, then the dynamic benefits of trade reform may be higher. But we are again faced with the same policy problems as beset static second-best analysis. First, we will often not be sure of the direction of the distortions. Second, even if we know that private returns to investment are sub-optimal, it may not be obvious that trade liberalisation will necessarily increase returns to investment. Third, there is a strong presumption that it would be better to address the market failure in the capital markets directly rather than using trade policy as a second-best instrument.
These arguments are developed by Baldwin (1992b) in the context of a model of investment which leads to a long-run steady state level of output and consumption. Jones and Manuelli (1990) make much the same point in their analysis of endogenous growth models. Once we take account of the opportunity cost of investment and once we discount its returns, there is no presumption that the welfare implications of policies in long-run growth models are substantially different from their effects in models where output converges to a steady state.
This point is implicit in Romer's (1993) discussion of policies for the funding and management of research and development. Although he identifies R&D as being at the core of the growth process, the welfare analysis is couched almost entirely in the traditional terms of static welfare analysis of non-rival and non-excludable goods. The important welfare implication of endogenous growth theory appears to lie not so much in the predictions of the growth process itself, but rather in the focussing of attention on the importance of public goods problems associated with the development of new knowledge and new goods.
From a normative viewpoint then, it is far from obvious that we need be concerned with the effects of trade on growth over and above the effects on static efficiency. Of course, there may be special cases in growth models where the long-run welfare gains from growth outweigh static level effects. If, for instance, there are multiple equilibria in growth paths, then growth effects may predominate.
I draw the tentative conclusion that, in general, welfare analysis loses little if it calculates the welfare gains and losses in the context of conventional static models. What is important is that such analysis should recognise the importance of learning and the accumulation of knowledge and the development of new goods, and that it should deal with the associated problems of non-appropriability, non-rivalry, common pools, etc.
5. Econometric Evidence on the Impact of Trade on Growth – A Brief Survey
A wide range of studies conducted over the past decade or so have indicated a fairly consistent pattern of positive correlations between trade openness and growth. Almost all of these studies are based on cross-country comparisons. For instance, the World Bank (1987) divides a sample of 41 developing countries into four categories of more or less inward or outward-oriented economies. Their classification is based on evidence of rates of protection, direct import controls, export incentives and exchange rate over-valuation plus a considerable element of judgment. GDP growth is strongest in the most outward-oriented countries, and weakest in the most inward-oriented.
As Evans (1989) points out, however, there is little difference between the weakly outward and the weakly inward-oriented groups. Moreover, the strongly outward-oriented group consists of three very particular outliers (Hong Kong, South Korea and Singapore) where other unmeasured factors may be playing a role in their strong growth performance.
Other researchers such as Agarwala (1983) and Dollar (1992) have used measures of price distortion (relative to world prices) for developing countries and find higher growth in those countries with lower price distortions.
Evans (1989) also reports on an unpublished paper by Chenery and Syrquin which predicts trade levels by country size and income, taking the deviation from predictions as a measure of openness. They find that outward orientation is associated with faster growth, particularly for small countries with a comparative advantage in manufacturing.
Lee (1993) estimates trade distortions as a function of tariffs and black market premia for 81 countries, covering developed and developing economies. He finds that, for example, a 20 per cent tariff for a country trading 20 per cent of its output reduces annual growth by 0.6 percentage points, with the effect working mainly through diminished rates of investment.
Further econometric support for the growth enhancing effects of freeing trade is found in studies by Helliwell (1992) and Edwards (1992). Singer and Gray (1988) suggest that the advantages of freer trade are greater for the group of countries whose exports are subject to strongly growing world demand.
A couple of recent studies explore more explicitly some of the ideas thrown up by recent theorising about growth.
Coe and Helpman (1993) find support for their hypothesis that trade flows between developed economies interact with the knowledge gap (measured by differences in stocks of R&D) to raise productivity growth. Whilst their evidence does not contradict their contention that trade diffuses knowledge, they do not explicitly confront alternative hypotheses such as that diffusion might be related to foreign direct investment, geographical proximity, language and culture, telecommunication links, etc.
Backus et al. (1992) appear to have re-discovered the results if not the work of Kaldor and ‘Verdoorn's Law’. They suggest that larger economies and more specialised economies should grow faster than smaller or less specialised economies. They find support for this hypothesis in cross-country comparisons of rates of growth of productivity in manufacturing, but not for non-manufacturing activities.
Lal (1993) is critical of trade and growth studies on the grounds that the indices of trade bias sometimes rely on subjective assessment that is pre-conditioned on the authors' knowledge of economic success. Such a criticism can be made of the World Bank study, but is not particularly pertinent to most of those referred to above which are based on objective measures of trade flows or price distortions. Lal also cites Sheehy (1990) as criticising studies of bivariate correlations between the growth of exports and the growth of GDP for ignoring questions of causation. None of the studies cited above use this specification of the trade-growth relationship.
A different line of criticism comes from Levine and Renelt (1992) who focus on the sensitivity of cross-country partial correlations to the inclusion of other explanatory variables. They find, for instance, that on a single cross-section (averaged over 30 years) the partial correlation between growth and openness is weak when other variables such as investment are included in the regression. Whilst their study sounds a valuable warning about the dangers of inference when important explanatory variables are missing, their approach to ‘data under-mining’ lacks a theoretical basis for arguing why certain variables should, or should not, be included in the regression analysis and for distinguishing endogenous from exogenous variables. Despite the limitations of this approach, they report that trade openness is robustly related to levels of investment and hence to growth.
There is, then, a very strong impression from a wide range of studies of a strong empirical relationship between trade openness and growth.
In the next section I shall present a study of my own that seeks to illustrate this relationship and to test for its robustness to a wider range of statistical techniques than have typically been used. In particular, I am concerned to investigate how robust the relationship is to variation over time as well as variation across countries. We suspect that there are a great many factors influencing countries' growth paths, including institutions of government, labour markets, corporate structure, financial structure, religious beliefs, cultural attitudes, etc. Any simple cross-country correlation that fails to control for these (often unmeasurable) factors is subject to doubts about omitted variable bias. The fast growing Asian NICs are strongly outward oriented, but they also share some historical and cultural characteristics. It may be these unmeasured characteristics which drive both growth and trade quite independently, leaving us to observe a spurious correlation.
Alternatively, it may be the case that economic success leads to lowered costs and increased international competitiveness which in turn encourages trade liberalisation. This contention was the subject of vigorous debate in the 1970s as Kravis (1970), Crafts (1973) and Lewis (1980) debated whether trade was the ‘engine’ or ‘handmaiden’ of growth.
None of the econometric studies mentioned above attempt to deal with these twin issues of omitted variable bias and reverse causation, so in the following section I present the preliminary results of a study which attempts to do just that. In an attempt to overcome problems of omitted variable bias, I construct a panel of data, taking observations over three successive decades. By taking first differences it is possible to eliminate the influences of country-specific factors, or at least of those factors which are invariant over time. Using lagged values as instruments, it is also possible to test for reverse causation.
6. A Panel Study of Trade and Growth
The relationship that I want to estimate involves hypotheses that trade openness may stimulate investment and also that it may stimulate technical progress and employment growth. The regression equations are specified as follows.
The dependent variable in the first equation is the growth of output per worker, Y/L, indexed by i for country and t for the time period. The standard explanatory variables are the growth of capital intensity, captured by the average investment share over the period, I/Y, and the growth of employment, L. The value of labour productivity at the beginning of the period, is a negative proxy for the technology gap between country i and the world leader, a measure of the potential productivity gains from importing technology. T is an additional variable capturing the degree of openness to trade at the beginning of the period. The final three terms represent period-specific factors, country-specific factors and a white noise error term, which affect the growth of multi-factor productivity.

The second and third equations are based on the supposition that capital accumulation and also employment growth may be influenced by income levels, captured by labour productivity, by population growth, P, and by trade openness as well as by country or period-specific factors and a white noise residual.


Substituting (2) and (3) into (1) gives a reduced form specification:

Derivations of these specifications apart from the openness variable are given in Dowrick and Nguyen (1989) and Brander and Dowrick (1994). In regression (1): α1 is the marginal gross rate of return on capital; 1+α2 is the output/employment elasticity; α3 is the marginal impact of openness on productivity growth; −α4 is the rate of catch-up or technological transfer. The εi term represents country-specific and time-invariant effects such as those of historically determined institutions and culture. εt represents common movements in the rate of technological progress, particularly to capture the productivity slow-down after the exceptional growth rates of the 1960s. εit represents random medium-term productivity shocks. Because the data have been averaged over decades, business cycle fluctuations should be largely smoothed out.
In the factor accumulation equations, Y/L captures income effects on savings and on labour supply; population growth is obviously important for labour supply and may have cross effects on capital accumulation. Trade is hypothesised to affect returns to factors, hence to alter their supply.
6.1 Data
Before estimating these regressions, it is useful to examine the data. The source is the latest Penn World Tables (5.5), an earlier version of which is described by Summers and Heston (1991). In order to examine variations over decades as well as cross-country variation, the data is averaged over each of the 1960s, 1970s and 1980s. Sub-Saharan African countries are excluded along with the major Middle Eastern oil exporters because the growth patterns of these countries are typically very different from those of the rest of the world and are extremely difficult to model. Countries are also excluded if more than three annual data points are missing from any decade. This leaves a sample of 74 countries, giving a sample size of 3×74 = 222. (The data are available from the author on request.)
For the purposes of preliminary data analysis I use the country averages over the period 1960–90. Figure 2 plots economic growth (in real GDP per capita) against trade intensity (exports plus imports/GDP) for the 74 countries. It is immediately obvious that there are three significant outliers in terms of trade intensity (Singapore, Hong Kong and Luxembourg). The first two of these are also outliers in terms of growth, so we may expect them to have considerable influence on subsequent statistical analysis of the relationship between trade and growth.
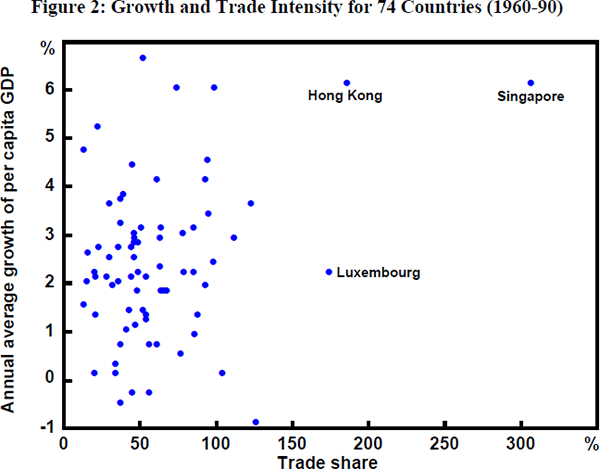
The presence of Hong Kong and Singapore in the sample gives a weak positive correlation between trade intensity and growth (r=0.30). Excluding the three outliers, it is evident that there is no systematic relationship; the correlation coefficient drops to 0.06.
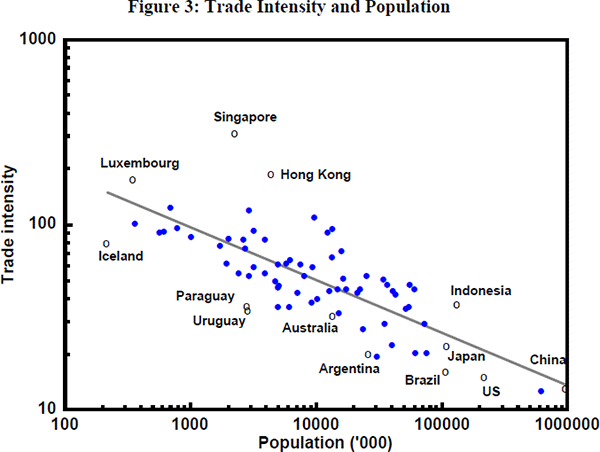
A common feature of the three extremely high-trading economies is that they are small countries, virtually city states. To ascertain whether their trading intensity is in fact exceptional, they should perhaps be compared with other cities rather than with other nations. Here I can approximate that comparison by plotting trade intensity against population size.
The scatter plot in Figure 3 is drawn to a logarithmic scale which shows that there is a very strong log-linear correlation between trade intensity and population. This is confirmed by the results of an ordinary least squares (OLS) regression of the log of population on the log of trade intensity, reported in Table 1.
| Estimation method | OLS |
|---|---|
| Sample countries | all |
| n | 74 |
| Regression coefficients (t-statistic): | |
| Population | 0.277 (10) |
| Constant | 6.48 (27) |
| Summary statistics: | |
 |
0.57 |
| s.e. | 0.40 |
The regression line is drawn in Figure 3 and some of the principal outliers and countries of interest are labelled. Luxembourg, for instance, is not a significant outlier; its high trade intensity is almost entirely explicable in terms of its tiny population. Singapore and Hong Kong, however, are indeed much stronger traders than other countries of similar size. Japan's relatively low trade intensity is largely explained by its size. Australia has a lower trade intensity than predicted, but by far the most significant low-trade outliers are the Latin American economies.
I take Ti, the deviation from the predicted trade intensity in the above regression, as a measure of trade openness. This measure is listed in Table 2, where countries are arranged in order of economic development in 1960.
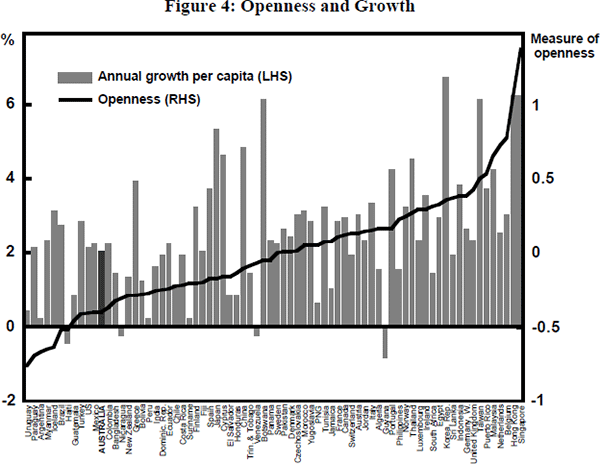
Trade openness is plotted against real GDP growth per capita in Figure 4, with countries arranged in increasing order of openness. Although using a larger sample and more recent data than World Bank (1987), much the same conclusion can be drawn from visual inspection of this figure. It is not apparent that there is any strong correlation between openness and growth, other than at the extremes of the distribution. The few very open economies are clearly growing faster than the few very least open economies, but the relationship for the big majority of countries in the sample is not nearly so clear. There are some inward-oriented countries that have grown fast and a number of outward-oriented countries that have grown relatively slowly.
6.2 Preliminary Regression Results
These simple bivariate correlations do not take account, however, of differences in technology gaps or rates of growth of population, nor do they allow us to distinguish whether countries that have increased their openness over time experience any acceleration in their growth. In order to examine these factors we move to multiple regression analysis.
Table 3 presents preliminary regression results for the aggregate cross-section, averaging the data for 1960–90. The specification is similar to that used by many of the studies reported in the previous section, regressing per capita GDP growth on measures of openness, investment rates and initial GDP levels. Productivity growth does not appear to be related to raw trade intensity (regression 3.1) but it is positively correlated with our derived measure of openness (3.2).
| 3.1 | 3.2 | 3.3 | 3.4 | 3.5 | 3.6 | |
|---|---|---|---|---|---|---|
| Estimation method | OLS | OLS | OLS | OLS | OLS | OLS |
| Sample countries | all | all | all | exclude HK, Singapore, Uruguay, Argentina | low initial income | high initial income |
| n | 74 | 74 | 74 | 70 | 44 | 30 |
| Regression coefficients (t-statistics): | ||||||
| Trade intensity | 0.0014 (0.5) |
|||||
| Openness | 0.014 (4.2) |
0.021 (5.8) |
0.016 (3.3) |
0.013 (2.9) |
0.013 (3.4) |
|
| Investment | 0.168 (6.8) |
0.141 (6.1) |
0.166 (4.9) |
0.130 (5.9) |
||
| Initial GDP | −0.012 (−5.1) |
−0.011 (−4.8) |
−0.003 (−1.5) |
−0.002 (−1.2) |
−0.022 (−4.5) |
−0.017 (−4.4) |
| Summary statistics: | ||||||
|
0.3727 | 0.4754 | 0.2446 | 0.0970 | 0.4640 | 0.7196 |
| s.e. | 0.0129 | 0.0118 | 0.0141 | 0.0142 | 0.0132 | 0.0071 |
| Diagnostic tests: | ||||||
| Heteroscedasticity | ** | * | — | — | — | — |
| Functional form | — | — | — | — | — | * |
| Parameter stability | * | * | — | * | — | — |
| Note: Trade share is log(imports+exports/GDP); openness is the residual
from the regression reported in Table 1; investment is constant price share
of investment in GDP; initial GDP is real GDP per capita in 1960. Diagnostic tests: **, * indicate statistical significance at 1%, 5% level for the Breusch-Pagan or Glesjer tests for heteroscedasticity and the Reset2 test for functional form. ‘—’ indicates absence of statistical significance at 5% level. Where heteroscedasticity is significant, t-statistics are adjusted by the White method. Parameter stability between more and less developed country groups is tested by ranking the countries in order of initial income and performing sequential Chow tests. The test statistic reaches a maximum in regression 3.2 of F(4,66)=2.7 when the sample is split 44:30. |
||||||
If we drop investment from the regression, as in (3.3), we lose a substantial degree of explanatory power but we find an enhanced impact of openness on growth. This suggests that openness works partly through increasing investment rates, perhaps as a result of increased rates of return, but also has a direct effect on labour productivity.
If we drop the two extreme high-growth/high-openness countries (Hong Kong and Singapore) and also exclude the two extreme low-growth/low-openness countries (Uruguay and Argentina) we find that the impact of openness is somewhat reduced, but still highly significant. The regression results are in column (3.4) of Table 3.
Much of the previous literature has concentrated on the developing rather than the industrialised countries, suggesting that the growth process is fundamentally different between the two groups of countries. Indeed, ranking countries in terms of their 1960 GDP levels we do find a statistically significant break in our model parameters between the less and more developed countries. Regressions (3.5) and (3.6) in Table 3 indicate, however, that this break does not affect the openness variable which has the same coefficient in each sample.
These results are really a check that our data are not fundamentally different from those used in previous econometric studies. We confirm that the aggregate cross-section does indeed show a positive correlation between trade and growth.
6.3 Panel Estimation
A major advantage of a panel data set over simple cross-section data (apart from the additional observations and degrees of freedom) is that it enables some control for time-invariant country-specific factors such as institutional arrangements that might be correlated with the explanatory variables. In equations (1) to (4), allowance is made for country-specific terms, εi, υi, etc. If these terms are correlated with openness and growth but are not included in the regression, then OLS regression will yield biased parameter estimates.
One approach is to assume that these unmeasured country-specific terms are fixed parameters which can be estimated by the least squares dummy variable (LSDV) method. This corresponds to the fixed effects model. The inclusion of country dummies is equivalent to first differencing the data and then examining them for correlations between changes in openness and acceleration of growth. Such a procedure certainly avoids bias from omitted country-specific and time-invariant variables, but it is also inefficient in that it effectively discards all the information contained in the pure cross-section averages of the data set.
An alternative procedure that can make more efficient use of the cross-section data as well as the time-series variation is to treat the εi as a random variable and estimate using generalised least squares (GLS). This is the random effects model. It makes use of more of the information in the data set, but parameter estimates may still suffer from bias.
I report results from all three models, noting that the OLS estimates are dominated by the cross-section information; the LSDV estimates utilise only the inter-decade variations in the data; while the GLS estimates utilise both cross-section and time-series variation.
Preliminary results for the reduced form growth equation (4) are reported in the appendix. Tests indicate that the estimates may be biased by the simultaneous impact of economic growth on openness. To deal with the endogeneity of the openness variable, I take the simple expedient of redefining openness as the value at the beginning of the decade rather than the average value over the course of the decade. I report in Table 4 both the LSDV and the GLS results.
| 4.1 | 4.2 | 4.3 | 4.4 | |||||
|---|---|---|---|---|---|---|---|---|
| Dependent variable | Growth of labour productivity | Investment rate |
Growth of workforce | Growth of labour productivity | ||||
| Sample countries | all | all | all | all | ||||
| n | 222 | 222 | 222 | 222 | ||||
| Estimation method | LSDV | GLS | LSDV | GLS | LSDV | GLS | LSDV | GLS |
| Regression coefficients (t-statistics): | ||||||||
| Initial openness | 0.006 (0.9) |
0.007 (2.2) |
0.046 (3.1) |
0.039 (3.6) |
0.001 (0.3) |
0.002 (2.2) |
0.014 (2.0) |
0.011 (3.2) |
| Population growth |
0.73 (0.9) |
−1.1 (−2.0) |
1.00 (9.0) |
0.98 (18.3) |
−0.48 (−1.3) |
−0.55 (−2.8) |
||
| Initial GDP per worker |
−0.042 (−4.9) |
−0.016 (−6.8) |
0.038 (1.9) |
0.047 (5.8) |
0.002 (0.8) |
0.002 (3.3) |
−0.037 (−3.9) |
−0.010 (−3.9) |
| Investment rate | 0.18 (5.2) |
0.14 (6.4) |
||||||
| Labour force growth |
−0.75 (−3.7) |
−0.43 (−3.1) |
||||||
| Decade dummies | yes | yes | yes | yes | ||||
| Summary statistics: | ||||||||
|
0.752 | 0.462 | 0.867 | 0.425 | 0.837 | 0.700 | 0.514 | 0.344 |
| s.e. e(i,t) | 0.015 | 0.016 | 0.037 | 0.038 | 0.0052 | 0.0052 | 0.017 | 0.018 |
| s.e. u(i) | 0.010 | 0.052 | 0.0026 | 0.010 | ||||
| corr[{e(i,t)+u(i)}, {e(i,s)+u(i)}] |
0.28 | 0.64 | 0.20 | 0.28 | ||||
| corr[e(i,t), e(i,s)] | −0.33 | −0.18 | −0.35 | −0.32 | ||||
| Specification tests: | ||||||||
| LSDV vs OLS | ** | ** | ** | ** | ||||
| GLS vs OLS | ** | ** | ** | ** | ||||
| LSDV vs GLS | — | — | — | — | ||||
| Note: Specification tests: ** indicate, for example, that the null hypothesis of the OLS model is rejected at the 1% level against the LSDV model. | ||||||||
The GLS estimate of the openness parameter δ2 is 0.011 while the LSDV estimator is 0.014 (see regression 4.4). These parameter values are substantially smaller than the OLS estimate of 0.021 reported in regression 3.3. This comparison suggests that omitting the unmeasured country effects does indeed bias upwards the estimates, indicating that previous studies which do not control for such effects have probably over estimated the true impact of openness on growth.
Nevertheless, the panel estimates do suggest that the impact of openness on growth is positive. Countries which increase their openness from one decade to the next do tend to have accelerated growth in output relative to countries where trade intensity is static or declining.
The effect of openness on productivity growth is much smaller than it is on output growth, see regression 4.1 which controls for factor supply. The productivity effect is less than half of the total growth effect, suggesting that much of the stimulus to growth works through factor supplies. Indeed, regression 4.2 demonstrates that openness is very significant in increasing investment. On the other hand, openness has little effect on the medium-term growth in labour supply which is, not surprisingly, driven almost entirely by population growth (see regression 4.3).
Are these results dependent on just a few outlying observations, or on the pooling of less and more developed economies? I estimate the same models on a variety of alternative choices of sample. As well as dividing the sample by 1960 per capita GDP, as explained earlier, I also test the effect of omitting the four Asian tigers: Taiwan, Korea, Singapore and Hong Kong. Table 5 reports only the parameter estimates for β3 and δ2, the openness variable in the investment equation and the reduced form growth equation, respectively. Full results are available from the author.
| Countries | n | Growth | Investment | ||
|---|---|---|---|---|---|
| LSDV | GLS | LSDV | GLS | ||
| All | 222 | 0.014 (2.0) | 0.011 (3.1) | 0.046 (3.1) | 0.039 (3.6) |
| All excl. four tigers | 210 | 0.010 (1.3) | 0.005 (1.3) | 0.040 (2.5) | 0.032 (2.7) |
| Developing | 132 | 0.019 (2.0) | 0.012 (2.2) | 0.045 (2.3) | 0.041 (2.9) |
| excl. three tigers | 123 | 0.015 (1.3) | 0.004 (0.7) | 0.044 (2.0) | 0.033 (2.0) |
| Developed | 90 | 0.002 (0.2) | 0.013 (3.3) | 0.008 (0.4) | 0.015 (0.9) |
| excl. Hong Kong | 87 | 0.007 (0.7) | 0.011 (2.2) | 0.013 (0.6) | 0.019 (1.1) |
| Note: t-statistics are in parentheses. | |||||
It is apparent that the strength of the correlation between growth and openness is dependent on the experience of the four tigers. Excluding these four, there is no statistically significant effect, except for the developed country sample using the GLS estimator. It is in the developing country sample (that most commonly used in previous empirical studies) that the statistical relationship between openness and growth appears to depend almost entirely on the strong growth and outward orientation of Taiwan, Korea and Singapore. There are still good reasons to believe that openness is important for growth in the developing world, not least that the LSDV and GLS estimators do make some allowance for special features underlying the phenomenal performance of the NICs. If we are already including country-specific effects in our model to counteract omitted variable bias, it is not clear that we are justified in also discarding the outlying observations from our sample.
With regard to investment, the exclusion of the tigers makes little difference. The strong relationship between openness and investment rates does not hold, however, for the developed country sample. In these countries, outward orientation appears to be reflected in improved productivity performance rather than in increased rates of return to investment. This might reflect greater bargaining strength of organised labour in the developed economies. If productivity increases are offset by higher wages, as workers appropriate the whole of the gains from trade, then returns to capital accumulation would not be affected and investment would not be expected to rise.
6.4 The Effects of Increasing Openness
The model tested so far concentrates on the pure growth effects of the level of openness at the beginning of the decade. If outward orientation produces static efficiency gains, influencing the level of output, then the growth of output should also be affected by the growth of openness.
I report below estimates of the reduced form growth regression augmented by a measure of the growth of trade intensity. The econometric problem here is that we may suspect reverse causation; good economic performance may increase international competitiveness and thus enhance export performance. Unfortunately, the data set does not provide good instruments for the growth of openness. Tests using lagged levels and rates of growth of openness do not reject the null hypothesis that the growth of openness is exogenous, but these tests have little power in the absence of instruments which are strongly correlated with the suspect variable. It is still of interest to inspect these results (see Table 6), but they should be interpreted with caution.
| Countries | n | Initial openness | Growth of openness | ||
|---|---|---|---|---|---|
| LSDV | GLS | LSDV | GLS | ||
| All | 222 | 0.029 (3.5) | 0.016 (4.7) | 0.19 (3.2) | 0.21 (4.7) |
| All excl. four tigers | 210 | 0.025 (2.9) | 0.010 (2.5) | 0.21 (3.5) | 0.20 (4.5) |
| Developing | 132 | 0.042 (3.8) | 0.019 (3.7) | 0.26 (3.5) | 0.24 (4.3) |
| excl. three tigers | 123 | 0.037 (3.2) | 0.012 (2.0) | 0.30 (3.9) | 0.23 (4.2) |
| Developed | 90 | −0.013 (−1.2) | 0.012 (3.0) | −0.24 (−2.4) | −0.07 (−0.9) |
| excl. Hong Kong | 87 | −0.012 (0.7) | 0.010 (1.9) | −0.32 (−3.3) | −0.10 (−1.3) |
| Note: t-statistics are in parentheses. | |||||
The interesting result here is that the growth of openness is strongly significant for the developing countries, and inclusion of this variable has the effect of making the initial openness parameter statistically significant too, even when the tigers are excluded from the sample. On the other hand, the growth of openness is insignificant within the sample of developed countries. This reflects the common finding that static efficiency effects of trade liberalisation are negligible for countries with well developed markets and where initial trade barriers were relatively low.
6.5 Summary of Results
A cautious conclusion from these mixed results is possible. There is consistent evidence that high outward orientation at the beginning of a decade does increase growth prospects. Estimates of this effect are biased upwards in OLS models which do not take account of country-specific factors, but the effect is still statistically significant when we use panel data and allow for fixed or random country effects.
Approximately half of the boost to growth works through increased investment, presumably reflecting increased profitability; the other half comes from a direct increase in productivity growth, perhaps reflecting dynamic gains from specialisation or from technology transfer. There is some suggestion (from the LSDV estimates rather than the GLS estimates) that the growth dividend is stronger for the less developed economies, supporting the hypothesis that it is technology transfer from more advanced countries that is particularly important.
A trade sceptic could point to the LSDV results to claim that there is no growth dividend from trade for the more developed economies. But this is to ignore the strong cross-section evidence and rely solely on the absence of a strong correlation between changes in openness over one decade and changes in growth rates over the subsequent decade. If we accept the GLS results, utilising aggregate cross-section information as well as variations over time, then the growth effect in the developed economies is significant and very similar to that found amongst the less developed economies.
Controlling for these dynamic effects of trade openness, purely static effects appear to be significant for the less developed economies but insignificant for the more developed.
A conservative estimate of the trade parameter, δ2, in the reduced form growth regression is 0.010. To appreciate its magnitude, a hypothetical experiment is useful. Australia's trade openness (the sum of exports and imports over GDP) averaged 32 per cent over the last three decades. For countries of similar population size, average openness is 47 per cent. If Australia had achieved this level of openness, the predicted addition to annual growth is 0.01 x ln(47/32) = 0.004. That is to say, annual growth of per capita GDP might have been nearly 2.4 per cent rather than the historical 2.0 per cent. If this higher openness and growth had been achieved over the past thirty years, then GDP might have risen to a level 12 per cent higher than its current value.
7. Concluding Comments
The overall impression from a brief survey of the existing econometric literature, and from the further statistical analysis reported in the previous section, is that there are indeed significant gains to rates of economic growth from further opening up of inward-oriented economies. This evidence supports the conclusions of the new models of economic growth which suggest that world growth should be enhanced by the increased specialisation which trade makes possible in knowledge-producing and growth-enhancing activities, whether in customised research and development activities or in learning by doing.
These potential gains are not, however, of the order of magnitude suggested by some commentators who point to annual growth rates in the NICs of 8 per cent or more and naively suggest that such rapid development should be possible for an already developed economy. At most, the gains that might be expected for a country like Australia are of the order of one half of a percentage point per year.
It is also worth noting that our simplistic derivation of trade orientation may be misleading for a country like Australia which possesses substantial mineral wealth. For example, if we were to export our oil for refining and re-import it, our measured trade intensity would be significantly higher.
Moreover, the wide variance in growth rates illustrated in Figure 2 should serve as a warning that there is no simple mechanical translation from trade to growth. There are plenty of countries with a far greater outward orientation than Australia and slower or equivalent rates of economic growth, notably high-trading EC economies such as the UK, Belgium and the Netherlands amongst the developed economies.
There are also plenty of examples of less developed countries that have grown quickly despite, or maybe because of, temporary trade restrictions. Many commentators have suggested that the fast growing East Asian economies have relied on protection at least in the early stages of industrialisation. The econometric evidence does not rule out infant industry arguments, although it does suggest that long-term protection is less likely to be successful.
Nor, it should be emphasised, does either the new theory or the econometric analysis contradict the traditional result that optimal tariffs are not necessarily zero when the terms of trade can be altered.
The new growth theories point out that the growth-enhancing effect of trade is an aggregate effect; we expect it to hold on average, as confirmed by the econometric results, but not in every case. In particular, trade can reduce growth for countries that have comparative advantage in industries with low-growth potential. Lower growth does not, however, necessarily imply lower economic welfare. Specialisation through trade may move the terms of trade in favour of the low-tech country which is enabled to import cheaper high-tech goods. The new theories support the traditional analysis of comparative advantage and the beneficial impact of trade liberalisation in a world of complete and competitive markets.
Trade is not, however, necessarily welfare enhancing in the absence of competitive markets. If there are substantial market failures in the accumulation of knowledge and skills and new goods, then trade is a double-edged sword. On the one hand, trade acts as a conduit for new ideas, stimulating growth and enhancing welfare. On the other hand, trade liberalisation and consequent specialisation in low-tech activities may relegate a country that is historically disadvantaged in the accumulation of skills and knowledge to fall further and further behind.
The pessimistic view of trade liberalisation for Australia is that it might lead us to inefficient specialisation in natural resource based activities with few incentives for enhancing skills and knowledge. For example, the current recovery in the world economy is already having the effect of improving short-term prospects for the terms of trade and raising the real exchange rate. It is possible that such movements may squeeze out the recent expansion in exports of high value-added manufacturing and lower our prospects for long-run growth and welfare by compounding failures to develop our skill and knowledge base.
These are, however, second-best welfare arguments. It is not obvious that we should be using trade policy to rectify failures in the markets for the development of skill and knowledge and new goods. Rather, if we address these problems directly, both the new theory and the econometric evidence suggest that trade liberalisation is likely to enhance both growth and welfare.
Appendix
| Estimation method | OLS | LSDV (fixed effects) |
GLS (random effects) |
|---|---|---|---|
| Sample countries | all | all | all |
| n | 222 | 222 | 222 |
| Regression coefficients (t-statistics): | |||
| Openness | 0.018 (5.6) |
0.036 (4.5) |
0.019 (5.2) |
| Population growth | −0.46 (−2.8) |
−0.41 (−1.2) |
−0.52 (−2.8) |
| Initial GDP | −0.009 (−4.4) |
−0.042 (−4.8) |
−0.010 (−4.3) |
| Decade dummies | yes | yes | yes |
| Country effects | — | fixed | random |
| Summary statistics: | |||
|
0.377 | 0.563 | 0.390 |
| s.e. | 0.020 | 0.017 | e(i,t): 0.017 u(i): 0.010 |
| Specification tests: | |||
| Exogeneity of openness | t = 3.8** | t = 1.7 | t = 3.4** |
| LSDV vs OLS | ** | ||
| LSDV vs GLS | — | ||
| Note: The exogeneity of the openness variable is tested by regressing
it on the exogenous variables including the (log) trade share and population
at the beginning of the decade and augmenting the reported regression
with the residuals from the instrumenting regression. Specification tests: ** indicate, for example, that the null hypothesis of the OLS model is rejected at the 1% level against the LSDV model. |
|||
Footnotes
Figures are from Industry Commission Annual Report 1992–93. [1]
ABS constant 1989/90 price data cited by the Industry Commission. [2]
The partial equilibrium reasoning here is adapted from Romer's (1994a) exposition where the good Z under analysis is an intermediate input into the production of a consumer good, so the derived demand represents the marginal productivity of Z and the marginal cost represents the opportunity cost, both measured in terms of the consumption good. [3]
The recent increase of both imports and exports of cars and their components is probably a good example of intra-industry trade facilitated by trade liberalisation and flexibility. [4]
This technological transfer takes place not only through trade, but also through foreign direct investment (FDI). Some of these links between FDI and technological transfer and productivity are discussed in the papers by Ergas and Wright and Howe in this Volume. [5]
There are also demand-side models of economic growth, e.g., some of the work of Thirlwall (1979) as cited by Kaldor (1981) where growth is constrained by a requirement to achieve balance on the current account. If income elasticities of demand dominate price elasticities, or prices are rigid, then domestic growth is constrained to the (exogenous) rate of growth of export demand divided by the income elasticity of demand for imports. Such models ignore or discount capital flows, price responses and resource allocation. I do not consider them here in any detail. [6]
There have been a number of recent symposiums in this burgeoning field, published in Journal of Political Economy (1990), Quarterly Journal of Economics (1991), Journal of Economic Theory (1992), Oxford Review of Economic Policy (1992), Journal of Monetary Economics (1993). Some of the most important theoretical contributions have come from Romer (1987, 1990), Lucas (1988), Jones and Manuelli (1990) and Grossman and Helpman (1990, 1991a, 1991b, 1993). Readable summaries are found in Sheehan (1992) and Romer (1994b). [7]
The interaction among trade, technology, factor accumulation and growth are usually discussed at the macroeconomic level. The paper by Ergas and Wright in this Volume examines the evidence that these interactions exist at the firm level. [8]
See Grossman and Helpman (1990, 1991a, 1991b, 1993). [9]
References
Agarwala, R. (1983), ‘Price Distortions and Growth in Developing Countries’, World Bank Staff Working Paper No. 575.
Backus, D.K., P.J. Kehoe and T.J. Kehoe (1992), ‘In Search of Scale Effects in Trade and Growth’, Journal of Economic Theory, 58(2), pp. 377–409.
Baldwin, R.E. (1992a), ‘Measurable Dynamic Gains From Trade’, Journal of Political Economy, 100(1), pp. 162–174.
Baldwin, R.E. (1992b), ‘Are Economists' Traditional Trade Policy Views Still Valid’, Journal of Economic Literature, 30(2), pp. 804–829.
Brander, J.A. and S. Dowrick (1994), ‘The Role of Fertility and Population in Economic Growth: Empirical Results From Aggregate Cross-National Data’, Journal of Population Economics, 7(1), pp. 1–25.
Coe, D.T. and E. Helpman (1993), ‘International R&D Spillovers’, IMF Working Paper WP/93/84.
Corden, W.M. (1984), ‘The Normative Theory of International Trade’, in R.W. Jones and P.B. Kenen (eds), Handbook of International Economics, Vol. 1, North-Holland, Amsterdam, pp. 63–130.
Corden, W.M. (1985), Protection, Growth, and Trade, Basil Blackwell, Oxford.
Crafts, N.F.R. (1973), ‘Trade as a Handmaiden of Growth: An Alternative View’, Economic Journal, 83(331), pp. 875–889.
Dollar, D. (1992), ‘Outward-Oriented Developing Economies Really Do Grow More Rapidly: Evidence from 95 LDCs 1976–85’, Economic Development and Cultural Change, 40(3), pp. 523–544.
Dowrick, S. and D.T. Nguyen (1989), ‘OECD Economic Growth in the Post-War Period: Catch-up and Convergence’, American Economic Review, 79(5), pp. 1010–1030.
Edwards, S. (1992), ‘Trade Orientation, Distortions and Growth in Developing Countries’, Journal of Development Economics, 39(1), pp. 31–57.
Evans, H.D. (1989), Comparative Advantage and Growth, Harvester Wheatsheaf, New York.
Grossman, G.M. and E. Helpman (1990), ‘Trade, Innovation and Growth’, American Economic Review, 80(2), pp. 86–91.
Grossman, G.M. and E. Helpman (1991a), ‘Trade, Knowledge Spillovers and Growth’, European Economic Review, 35(2/3), pp. 517–526.
Grossman, G.M. and E. Helpman (1991b), Innovation and Growth in the Global Economy, MIT Press, Cambridge, Massachusetts.
Grossman, G. M. and E. Helpman (1993), ‘Endogenous Innovation in the Theory of Growth’, NBER Working Paper No. 4527.
Hammond, P.J. and A. Rodriguez-Clare (1993), ‘On Endogenizing Long-Run Growth’, Scandinavian Journal of Economics, 95(4), pp. 391–425.
Harris, R.G. (1994), Measuring the Dynamic Gains from Economic Integration: An Application to the Economic Integration of North and South America, seminar paper, Australian National University.
Harris, R.G. and D. Cox (1985), ‘Trade Liberalization and Industrial Organisation: Some Estimates for Canada’, Journal of Political Economy, 93(1), pp. 115–145.
Helliwell, J.F. (1992), ‘Trade and Technical Progress’, NBER Working Paper No. 4226.
Jones, L.E. and R. Manuelli (1990), ‘A Convex Model of Equilibrium Growth: Theory and Policy Implications’, Journal of Political Economy, 98(5), pp. 1008–1038.
Journal of Economic Theory (1992), ‘Economic Growth: Theory and Computations’, 58(2), pp. 117–452.
Journal of Monetary Economics (1993), ‘National Policies and Economic Growth: A World Bank Conference’, 32(3), pp. 359–575.
Journal of Political Economy (1990), ‘The Problem of Development’, 98(5), pp. S1-S193.
Kaldor, N. (1981), ‘The Role of Increasing Returns, Technical Progress and Cumulative Causation in the Theory of International Trade and Economic Growth’, Economie Appliquee, 34(4), pp. 593–617.
Kravis, I.B. (1970), ‘Trade as a Handmaiden of Growth: Similarities Between the Nineteenth and Twentieth Centuries’, Economic Journal, 80(320), pp. 850–872.
Krugman, P. (1990), Rethinking International Trade, MIT Press, Cambridge, Massachusetts.
Lal, D. (1993), Does Openness Matter? How to Appraise the Evidence, seminar paper, Australian National University.
Lee, J.W. (1993), ‘International Trade, Distortions, and Long-Run Economic Growth’, IMF Staff Papers, 40(2), pp. 299–328.
Levine, R. and D. Renelt, (1992), ‘A Sensitivity Analysis of Cross-Country Growth Regressions’, American Economic Review, 82(4), pp. 942–963.
Lewis, W. A. (1980), ‘The Slowing Down of the Engine of Growth’, The Nobel Lecture, American Economic Review, 70(4), pp. 555–564.
Lucas, R.E., Jnr. (1988), ‘On the Mechanics of Economic Development’, Journal of Monetary Economics, 22(1), pp. 3–42.
Martin, W. and K. Yanagishima (1993), Concerted Trade Liberalization and Economic Development in the Asia-Pacific Region, paper presented at the Asia-Pacific Economic Modelling Conference – 93, Australian National University, Canberra.
Oxford Review of Economic Policy (1992), ‘New Approaches to Economic Growth’, 8(4), pp. 1–69.
Pitchford (1960), ‘Growth and the Elasticity of Factor Substitution’, Economic Record, 36, December, pp. 491–504.
Quarterly Journal of Economics (1991), 106(2), pp. 327–667.
Rivera-Batiz, L.A. and P.M. Romer (1991), ‘Economic Integration and Endogenous Growth’, Quarterly Journal of Economics, 106(2), pp. 531–555.
Rivera-Batiz, L.A. and D. Xie (1992), ‘GATT, Trade, and Growth’, American Economic Review, 82(2), pp. 422–427.
Romer, P.M. (1987), ‘Growth Based on Increasing Returns to Specialisation’, American Economic Review, 77(2), pp. 56–62.
Romer, P.M. (1990), ‘Endogenous Technological Change’, Journal of Political Economy, 98(2), pp. S71-S102.
Romer, P.M. (1993), ‘Implementing a National Technology Strategy with Self-Organizing Industry Investment Boards’, Brookings Papers on Economic Activity, 2, pp. 345–399.
Romer, P.M. (1994a), ‘New Goods, Old Theory, and the Welfare Costs of Trade Restrictions’, Journal of Development Economics, 43(1), pp. 5–38.
Romer, P.M. (1994b), ‘The Origins of Endogenous Growth’, Journal of Economic Perspectives, 8(1), pp. 3–22.
Schumpeter, J. (1934), The Theory of Economic Development, Harvard University Press, Cambridge, Massachusetts.
Sheehan, P.J. (1992), Economic Theory and Economic Strategy: the New Growth Models, paper presented at the 21st Conference of Economists, University of Melbourne, July.
Sheehy, R.L. (1990), ‘Exports and Growth – A Flawed Framework’, Journal of Development Studies, 27(1), pp. 111–116.
Singer, H.W. and P. Gray (1988), ‘Trade Policy and Growth of Developing Countries: Some New Data’, World Development, 16(3), pp. 395–403.
Summers, R. and A. Heston (1991), ‘The Penn World Table (Mark 5): An Expanded Set of International Comparisons, 1950–88’, Quarterly Journal of Economics, 106(2), pp. 327–368.
Thirlwall, A. P. (1979), ‘The Balance of Payments Constraint as an Explanation of International Growth Rate Differences’, Banca Nazionale del Lavoro Quarterly Review, 32(128), pp. 45–53.
Tyers, R. (1993), ‘Trade Reform and Manufacturing Pricing Behaviour in Four Archetype Western Pacific Economies’, Australian National University, Canberra, mimeo.
World Bank (1987), World Development Report 1987, Oxford University Press, New York.
World Bank (1993), The East Asian Miracle: Economic Growth and Public Policy, Oxford University Press, New York.
Young, A. (1991), ‘Learning by Doing and the Dynamic Effects of International Trade’, Quarterly Journal of Economics, 106 (2), pp. 369–405.