RBA Annual Conference – 2006 Optimal Private Responses to Demographic Trends: Savings, Bequests and International Mobility Henning Bohn[1]
Abstract
This paper examines the implications of population ageing in an environment of increasingly mobile capital and labour. I first present three benchmark models for world savings, capital-output ratios and returns to capital and then examine their relevance for the world economy and their policy implications.
The mechanics of capital deepening triggered by declining birth rates are presented in a Solow-Swan model with exogenous saving. The role of retirement savings is examined in a stylised overlapping-generations model with life-cycle savers. A dynastic model with altruism towards children highlights the interaction of savings with bequests and spending on children.
All three models are calibrated to the world economy with particular attention to the G-20. The models yield different conclusions largely due to their different assumptions about bequests. While the Solow-Swan and life-cycle models suggest rising capital-labour ratios, rising capital-output ratios and a secular decline in returns to capital, the dynastic model predicts declining saving rates, a declining share of bequests in aggregate wealth and a stationary world return to capital.
A substantial share of world capital is due to bequests rather than life-cycle savings. This raises doubts about the life-cycle model as a tool for demographic projections. At the same time, the projected decline in bequests also raises questions about bequests reaching a lower bound where life-cycle reasoning would become applicable. I argue that constraints on bequests are likely to be ‘soft’ (non-binding) for as long as retirees can successfully lobby for growing public transfers (serving as negative bequests). Increasing capital and labour mobility are relevant in this context because increasing cross-country tax competition would impose increasingly stringent bounds on transfers and hence on aggregate bequests. While developed countries may be close to such bounds, bequests and dynastic reasoning remain important for savings in developing countries and hence for world-wide demographic projections.
1. Introduction
Birth rates are declining and survival rates are increasing around the world. How will individuals respond to these trends? What are the optimal responses? What are the implications for the world economy?
This paper examines the implications of population ageing from a global perspective. I focus specifically on savings, bequests and policy expectations in an environment of increasingly mobile capital and labour. The saving responses to demographic change are central to macroeconomic analysis. Savings provide funding for capital investment and determine the future capital stock. The size of the capital stock relative to the labour force – the capital-labour ratio – determines per-capita incomes, wage rates, returns to capital and other macroeconomic variables.
Bequests matter because they are a key source of funds for savings. Bequest motives and the empirical magnitude of bequests are still the subject of controversy. As I will show, different assumptions about bequests yield very different answers about the optimal and likely private responses to demographic changes.
Expectations about economic policy deserve attention because a lack of policy credibility has destructive effects on the world economy. The spatial allocation of capital is distorted and inefficient if investors have to worry about unexpected taxes, expropriation and other capital levies. As workers become increasingly mobile, taxes on wages and on consumption will do similar damage to the global allocation of labour.
The role of savings is well-recognised in the economic literature on demographic change. Most researchers employ models with overlapping generations of life-cycle savers. The models range from stylised 2–3 period representations of the life-cycle that build on Samuelson's (1958) and Diamond's (1965) work, to detailed multi-period models that build on Auerbach and Kotlikoff's (1987) 65-period model. Noteworthy examples include Börsch-Supan, Ludwig and Winter (2002), Brooks (2003), IMF (2004), Börsch-Supan (2005), Fehr, Jokisch and Kotlikoff (2005, this volume), Attanasio, Kitao and Violante (2006), Batini, Callen and McKibbin (2006) and Bryant (this volume). Models that provide more detailed demographic and geographic coverage tend to require more specific assumptions about individual behaviour. To focus on the key conceptual issues, I model the life-cycle relatively compactly as a succession of 20-year periods – representing childhood, young and middle-aged working periods, and retirement.
A largely separate literature examines demographic change in specific countries, often treating them as closed economies. Examples include De Nardi, Imrohoroglu and Sargent (1999) for the United States, and Braun, Ikeda and Joines (2004) for Japan. In addition, there is a huge literature on long-run economic growth that compares growth performances across countries, some adopting Solow's (1956) and Swan's (1956) exogenous saving assumption, others assuming optimising infinitely-lived dynasties. Most of the literature ignores bequests; a notable exception is the dynastic approach for the US in Elmendorf and Sheiner (2000).
This paper examines optimal responses to demographic change across a range of modelling approaches. One objective is to identify critical issues and assumptions that explain why predicted responses in the literature differ substantially across models. Although I display projected values for savings, returns and other variables, they are shown to illustrate the issues and should not be interpreted as forecasts.
Economic theory offers three basic perspectives on saving and demographic change: growth models in the Solow-Swan tradition help to understand the purely mechanical ramifications of demographic change; overlapping generations models with life-cycle savers help to highlight the role of saving for retirement; and dynastic models with altruism towards children highlight the role of bequests, education and family relations.
According to the Solow-Swan model, the capital-labour ratio should increase and the return to capital fall as the birth rate declines. Life-cycle models yield similar predictions, although there are a multitude of conflicting effects that may raise or reduce the saving rate. Dynastic models, in contrast, imply an unambiguously declining saving rate, a stationary return to capital and a stationary capital-labour ratio.
The intuition for the results of the dynastic model is as follows. Optimal bequests decline as the population ages. Because bequests are bounded below (non-negative in simple models), declining bequests suggest a possible regime shift in saving behaviour. Dynastic reasoning is arguably most relevant in economies with substantial bequests, for example agrarian and industrial economies where land and business assets are mostly inherited rather than purchased. Life-cycle reasoning is more relevant when rising life expectancy requires more funds for retirement and as human capital (education spending) becomes more important. Life-cycle modelling is arguably appropriate for developed economies, at least looking forward, but probably not for less-developed countries.
Questions about retirement savings naturally involve the public sector. In life-cycle models, public pensions crowd out private saving and reduce the capital stock. In dynastic models, public pensions tend to raise bequests and relax bequest constraints. The latter gives public policy an important role in the transition from dynastic to life-cycle saving. Optimal private responses to population ageing are likely to include political efforts to increase public pensions.
The interaction between mobility and policy is important both for the allocation of capital and labour and as a constraint on public transfers. Internationally mobile capital equalises returns on capital across countries. Even if governments tried to constrain mobility, there are enough channels for factor price equalisation that the macroeconomic effects of demographic change are best examined at a global level. Policy-induced frictions (taxes, regulations, risk premiums) are crucial, however, for the spatial distribution of production and hence for the fortunes of specific countries.
An emerging issue in this context is labour mobility. Because international capital mobility does not prevent governments from taxing labour, it does not seriously threaten transfer systems financed by payroll taxes. This is different in a world with mobile capital and mobile labour. Because production has roughly constant returns to scale in capital and labour, the spatial allocation of production becomes essentially indeterminate. Investment decisions are then extremely sensitive to taxes and to expectations about future taxes. Decisions about where to work become similarly sensitive to redistributional wage taxes. This matters for saving and bequests because constrained taxes make it impossible for the old to avoid bequest constraints by expanding retiree transfers.
Integrated world capital and labour markets also have implications for financial markets. Taxes and public transfer systems can be interpreted as devices that help share risk (see Bohn 2001, 2003, 2006). With increased mobility, risk-sharing through ex post taxation becomes increasingly difficult. A better policy is to take out insurance in financial markets before disturbances hit, for example through state-contingent debt (Bohn 2002). Monetary policy and nominal debt may have a role in this context because they provide a flexible tool for letting the real value of debt respond to shocks.
This paper is organised as follows. Sections 2–4 examine responses to population ageing in the three benchmark models. Section 5 compares results across models and comments on the role of public institutions. Section 6 examines the interaction between global mobility and country-level policies. Section 7 summarises and concludes.
2. Solow-Swan – A Benchmark without Optimisation
Optimal responses to demographic change should be distinguished from purely mechanical responses. To provide a benchmark and macroeconomic context, this section examines population ageing in a Solow-Swan-type model. The model is not optimising and simply assumes that individuals save a fixed fraction of income.
Central to the model is the neoclassical production function. Output is produced using capital and labour. The factors of production earn incomes according to their marginal contributions to output. Individuals save a fixed fraction of their income, which determines the supply of funds to the world capital market. Firms demand funds to finance new capital investments. They promise savers a return equal to the marginal product of capital minus the depreciation rate.[2]
For now, I abstract from public sector issues and from frictions that might prevent an equalisation of factor returns across countries. Public sector variables are subsumed into the private sector: aggregate consumption includes tax-financed public goods; aggregate investment includes public infrastructure; and capital includes government-owned capital. Public sector decisions are interpreted as if they are determined by savers who are also voters and thus own and control their governments. Sufficient conditions for factor price equalisation are either capital mobility, labour mobility or both.
The Solow-Swan model provides a simple argument for how the demographic transition affects the world economy. Smaller working-age cohorts reduce the supply of labour relative to capital. The capital-labour ratio increases. A higher capital-labour ratio reduces the marginal product of capital while raising the marginal product of labour. Thus, the wage increases and the return to capital declines.
The application of this simple argument requires some care. Most importantly, one must account for international differences and changes in productivity. For each country, the effective labour force is the actual labour force weighted by the country's total factor productivity (TFP). Following the Penn World Tables (Heston, Summers and Aten 2002), productivity is measured relative to the US and adjusted for differences in purchasing power. World output is thus determined by world capital and by the effective labour force (scaled to US productivity).
To focus on the G-20, my calculations explicitly account for the 19 individual members of the G-20. Other countries are aggregated into a single Rest of the World (ROW) category. Baseline assumptions are 1.5 per cent annual US productivity growth and a gradual TFP convergence to US levels, consistent with convergence observed from 1980–2000. (An algebraic exposition and more details are provided in Appendix A; sensitivity analysis is provided below.)
Figure 1 shows projected growth rates of the world population, separated by age cohorts. The figure highlights three key features of the demographic transition. First, the rate of population growth is declining sharply. Second, the timing of the decline differs between age groups – it occurs first in young cohorts, then in older ones. Third, retirement-age cohorts will keep growing, due to increasing longevity.
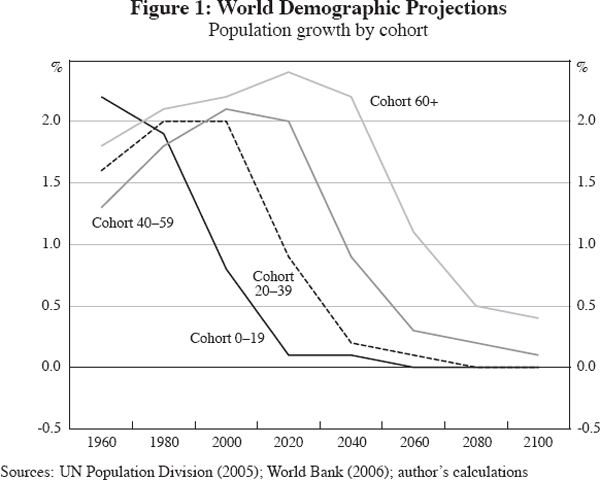
Figure 2 shows projected growth rates of the world's working-age population and three scenarios for the world's effective labour force – the baseline projection plus two alternative scenarios. The first alternative assumes fast convergence of world productivity to US levels as suggested by Lucas (2000). The second alternative assumes no convergence, that is, constant productivities relative to the US; because poorer countries tend to have faster population growth, average world productivity would decline relative to the US.
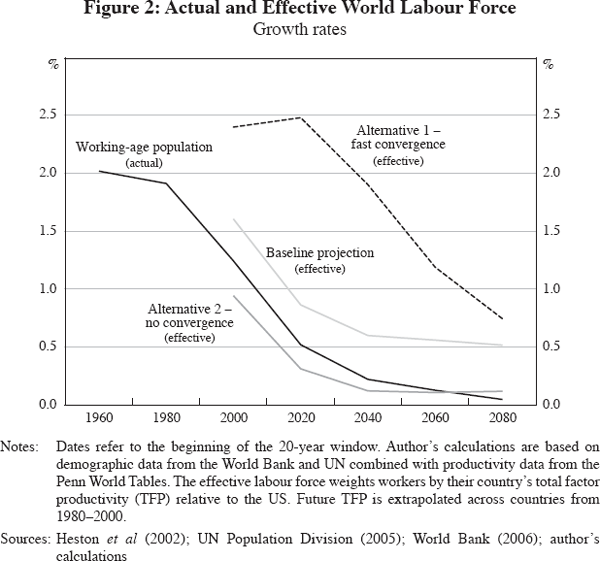
The alternative scenarios highlight the unavoidable fact that macroeconomic projections are conditional on productivity growth. If productivity growth were to accelerate sharply, the effective labour force could display accelerating growth despite the demographic transition. However, Figure 2 suggests that a substantial increase in productivity growth – of around one per cent per year persisting indefinitely – would be required to swamp the projected decline in population growth. Models are best compared for a common growth scenario; the figures below are conditional on the baseline growth assumptions.
Figure 3 shows the implications of declining labour force growth for the world capital-output ratio and for the world return to capital. Both panels display a baseline projection and two alternative demographic scenarios, one with a 0.5 per cent higher birth rate, the other with a 0.5 per cent lower birth rate. Although the economic intuition is about capital versus labour, I display the capital-output ratio for convenience. The capital-labour and capital-output ratios are one-for-one transformations of each other. The capital-output ratio is unit-free (dollars divided by dollars) and easier to display than the capital-labour ratio (which is ‘dollars per efficiency units of labour’).
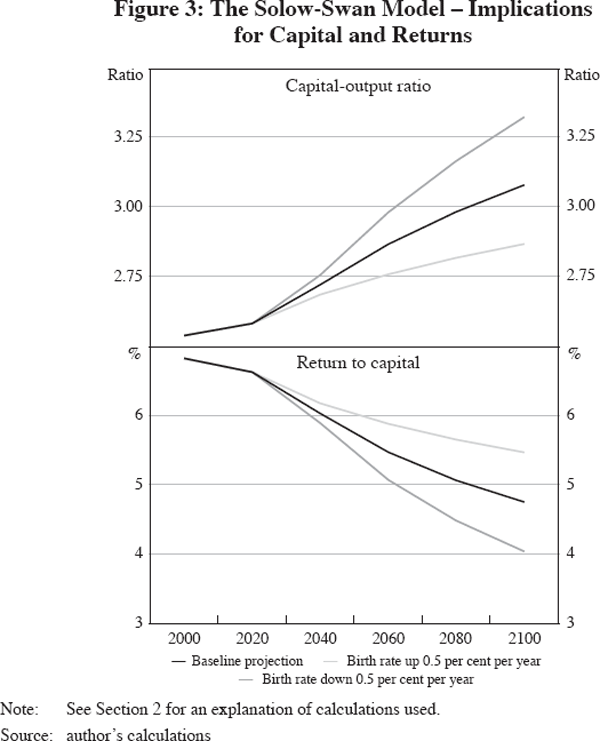
Figure 3 (top panel) demonstrates that declining population growth implies higher capital-output and capital-labour ratios – the phenomenon of capital deepening. Higher capital-labour and capital-output ratios always imply higher wages and lower returns to capital. Returns are displayed in the lower panel. Capital deepening is magnified or reduced if the rate of population growth declines by more or less than the baseline.
In optimising models, comments on longevity, growth in health spending and declining youth dependency would be appropriate at this point. But because the saving rate is assumed to be constant, these factors are irrelevant in the Solow-Swan model.
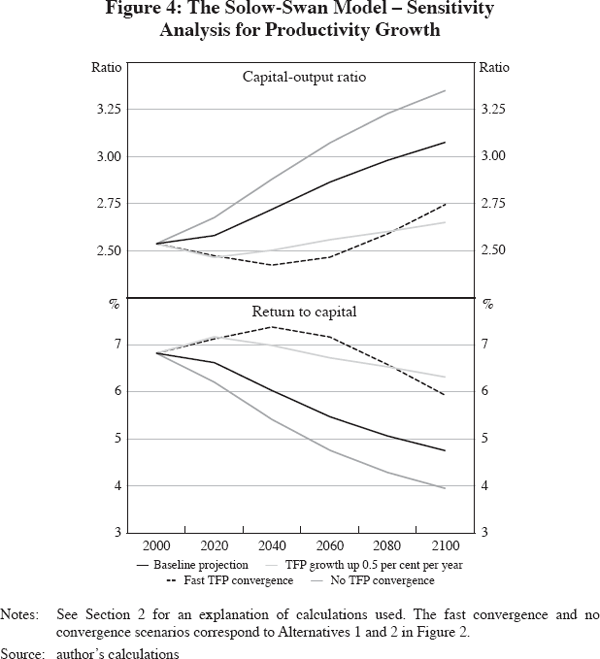
As an illustration of how sensitive macroeconomic projections are to productivity growth, Figure 4 displays the baseline projections together with three alternative scenarios according to different TFP growth assumptions: fast convergence of world TFP to US levels (the Lucas 2000 case), no TFP convergence (slower growth), and a scenario with permanently higher US and world TFP growth. With a fixed saving rate, slower productivity growth has the same implications as a lower birth rate – capital deepening increases and the return to capital declines more sharply. Faster productivity growth has the opposite effects and may raise returns despite the reduced population growth.
The Solow-Swan model sets the stage for examining optimal saving behaviour.
3. Optimal Saving in the Life-cycle Model
The dominant framework for research on demographic change is a life-cycle model for individual saving combined with neoclassical production. Life-cycle optimisation assumes that individuals maximise preferences defined over their own consumption. Economic activity is determined by a succession of overlapping generations. The logic of capital deepening remains valid, but the saving rate may vary over time.
Any life-cycle model must address three key questions of model design: how to deal with the uncertain timing of death, how to support children and how to determine the age at which individuals start to save for retirement. Uncertain mortality raises the spectre of involuntary, ‘accidental’ bequests. Children's consumption does not mesh well with the premise of selfish individual optimisation. Children can only be included with altruistic add-ons, and they are often ignored. (Models commonly assume that life starts at age 20.) Finally, empirical evidence suggests that young households do not save much for retirement until about age 40 (Poterba 2001, 2004). Plausible explanations include child-rearing expenses, purchases of durable goods and an upward-sloping age-earnings profile. One must infer that aggregate saving depends importantly on the population share of the middle-aged working cohort.
In the literature, accidental bequests are sometimes avoided by the unrealistic assumption of perfect annuity markets. Bequests are empirically significant, however, and they have a major impact on saving incentives and on the resources available to savers.[3]
My version of the life-cycle model accounts for bequests by constraining retirees to leave an exogenous fraction of their resources – the bequest share – to the next cohort. The life-cycle is divided into four stages of 20 years: childhood (ages 0–19), young working life (ages 20–39), middle-aged working life (ages 40–59) and retirement (ages 60+). I deal with childhood by assuming that parents care about children's consumption while they are in the household. And I impose a link between age and saving by assuming that young workers are liquidity-constrained and spend their wage income on their own and their children's consumption. The assumption of liquidity-constrained young follows Constantinides, Donaldson and Mehra (2002).
The middle-aged workers are the key cohort for the macroeconomic dynamics. They divide their wage income and incoming bequests from their parents between consumption and capital accumulation. Retirees would like to consume all their wealth – principal and total returns – but are constrained to consume no more than 1 minus the bequest share.
The bequest share is primarily meant to capture accidental bequests but it can be interpreted more broadly. For example, individuals may have preferences over wealth in addition to consumption, perhaps as a reduced form of preferences for the power and status associated with wealth. If preferences are homothetic over consumption and wealth, a constant bequest share would be optimal.[4] Because the public sector is not modelled separately, bequests also include the uncompensated transfer of public assets to the next generation, notably infrastructure and positive or negative fiscal transfers.
Bequest shares may depend on institutional factors that could change over time. Public policy determines the reliability of retirees' access to public transfers and the extent to which infrastructure investments are debt-financed. Accidental bequests are presumably related to market structures that determine the ability of individuals to annuitise assets. Accidental bequests may also depend on social institutions that determine the need for self-insurance, including against health risks.
The life-cycle model identifies several determinants of optimal saving and it explains their role in the context of the population ageing:
- Increasing longevity – an obvious motive for increased saving. More savings implies a higher capital-labour ratio, that is, more capital deepening.
- Increasing medical needs: Spending on health care is increasing around the world, a trend apparently motivated by rapid improvements in medical technology. Because medical needs increase with age, this can be interpreted as a shift in preferences towards old-age consumption. The optimal response is to save more.
- An increasing share of retirees: Declining population growth implies a growing share of retirees in the population. Their attempts to consume accumulated wealth should trigger dissaving. Empirical evidence suggests, however, that dissaving by retirees is less than simple life-cycle reasoning would indicate (Poterba 2001, 2004), again suggesting a role for bequests. A greater ratio of retirees to bequest-receiving younger cohorts implies greater bequests per recipient. Because the recipients are savers, the effect of retiree dissavings is reduced.
- Shifts in the age distribution of wage income: Declining population growth also implies that middle-aged workers receive a greater share of aggregate wage incomes. The effect is to increase the aggregate saving rate.
- Effects of a declining return to capital: On aggregate, the return to savings is the return to world capital. Provided capital deepening takes place (as suggested by the arguments above) the return to capital will decline. This has conflicting substitution and income effects. While saving becomes less rewarding at the margin, a given wealth provides less retirement income.
The relative magnitude of the substitution and income effects is determined by the elasticity of intertemporal substitution (EIS). Empirical estimates favour a low EIS and suggest that income effects dominate (Hall 1988, Ogaki and Reinhart 1998). Demographic changes that trigger capital deepening will therefore tend to increase the saving rate. This reinforces capital deepening and magnifies the decline in returns.
Figures 5 and 6 illustrate the impact of demographic changes in the stylised life-cycle model. For the calibration, I distinguish four world regions: (1) the US; (2) seven other high-income G-20 countries;[5] (3) eleven less-developed G-20 countries (the other individual members); and (4) the ROW.[6] Regions 2 and 3 are distinguished by high versus low per-capita income and quite different demographics. The US is modelled separately because of its size and unusual demographics – a rich country with a poor-country birth rate. In the G-20 regions, population dynamics are built up from country-level data. Initial capital stocks are determined by equating 1980 values to the steady-state. Capital in 2000 is computed from 1980 values and world investment rates for 1980–2000. World wealth (ownership of capital) in 2000 is attributed to regions according to 1980 capital stocks and regional saving rates for 1980–2000. I assume an EIS equal to 0.5 and a 1 per cent annual rate of time preference.
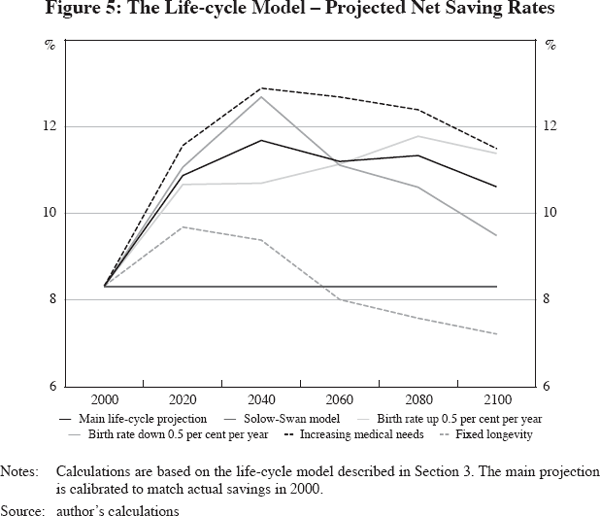
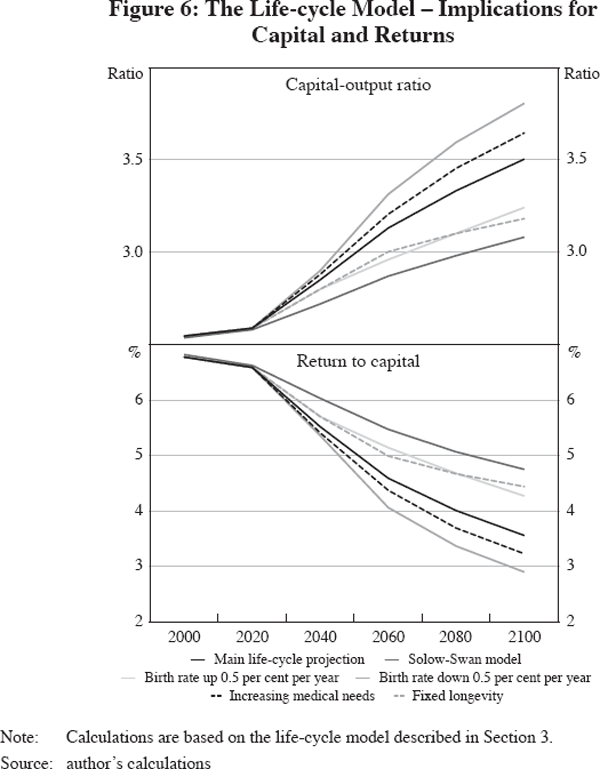
The bequest shares are calibrated so that each region's saving rate in 2000 matches actual saving rates. The calibrated bequest shares are 24 per cent for the US, 43 per cent for the high-income G-20 countries, 57 per cent for the less-developed G-20 and 30 per cent for the ROW. While one might quibble with these assumptions about bequests, an interpretation of bequests as exogenous is unavoidable if one wants to interpret the world as populated by life-cycle savers. The US value is broadly consistent with empirical evidence on bequests (Kopczuk and Lupton 2005). Higher bequest shares elsewhere are consistent with the notion that accidental bequests are higher when financial markets are less developed and if retirees are forced to hold substantial wealth for self-insurance purposes. (High bequest shares are of course consistent with altruism; this is pursued in the next section.)
Figure 5 presents the model's implications for saving rates under a number of assumptions about future demographic trends and consumption preferences. The main projection shows a substantial increase in net saving rates. The alternatives with higher and lower birth rates show that birth rates matter relatively little in the short run, but they influence the saving rate in the longer run, consistent with their impact on the population share of retirees. The fixed-longevity alternative highlights the key role of longevity in this model. If longevity were to remain fixed at year-2000 values, the projected increase in the saving rate would largely vanish. A final alternative projection illustrates the role of medical expenses, specifically a doubling of retiree medical consumption over 2020–2080; in this scenario, the saving rate increases more than in the main projection. Overall, saving rates increase in response to population ageing.
Figure 6 displays the implied capital-output ratios and returns to capital. For both variables, the projected higher saving rates reinforce the capital-deepening effects predicted by the Solow-Swan model. The return to capital declines sharply in all scenarios – in popular terminology, the model suggests a major global savings glut.
The prediction of a higher saving rate in response to population ageing is not a universal feature of life-cycle models. The IMF (2004), for example, projects European and Japanese saving rates to decline by 12 percentage points of GDP, with no substantial increases elsewhere. The IMF model assumes zero bequests and an expansion of retiree transfers as a share of GDP to finance unchanged benefits. Both assumptions clearly depress saving rates. Note that these mixed findings in the literature are limited to the saving rate. That is, rising capital-labour ratios and declining returns on capital are robust findings in life-cycle models of world population ageing.[7]
Finally, note that youth dependency would matter in a life-cycle model without liquidity constraints. If young families can borrow, a smaller number of children will shift optimal spending into older ages and reduce young-age borrowing. The trend towards more education spending per child goes in the other direction, however. The net effect of less spending on youth would be to further increase the aggregate saving rates. Hence youth dependency considerations are likely to strengthen the projected increase in the saving rate and the decline in returns.
4. Optimal Savings and Bequests in the Dynastic Model
The dynastic model assumes that individuals value their children's utility. Because these children care about their own children – the initial generation's grandchildren – individuals care about the welfare of all future generations.
The dynastic model is interesting because it endogenises bequests and suggests very forward-looking behaviour. Future demographic developments that impact the well-being of future generations have an impact on optimal current saving and bequests. Optimal individual behaviour with altruism can also be interpreted as maximising a social welfare function. This makes the dynastic model of independent interest for policy analysis. Elmendorf and Sheiner (2000) use the dynastic model to examine the US demographic transition; this section applies similar reasoning to the world economy.
The endogeneity of bequests has striking consequences for the return to capital in the very long run. Individuals reduce bequests whenever the return falls below the discount rate on their children's utility. The resulting fall in the capital-labour ratio counteracts the initial disturbance and raises the return to capital. This endogenous return-stabilising mechanism keeps the return to capital stationary regardless of demographic changes. In response to population ageing, unchanged savings and bequests would imply lower returns. Hence the dynastic model necessarily implies a decline in savings and bequests.
The dynastic model does not rule out temporary changes in the return to capital. Such changes may occur as income and consumption needs vary during a demographic transition. This is best examined quantitatively.
Figures 7 and 8 display the model's implications for optimal world saving, capital-output ratios and the returns to capital. The model's structure is comparable to the life-cycle model but with altruism. I assume a discount rate on children's consumption consistent with a 6 per cent steady-state return to capital. (See Appendix A for more details.)
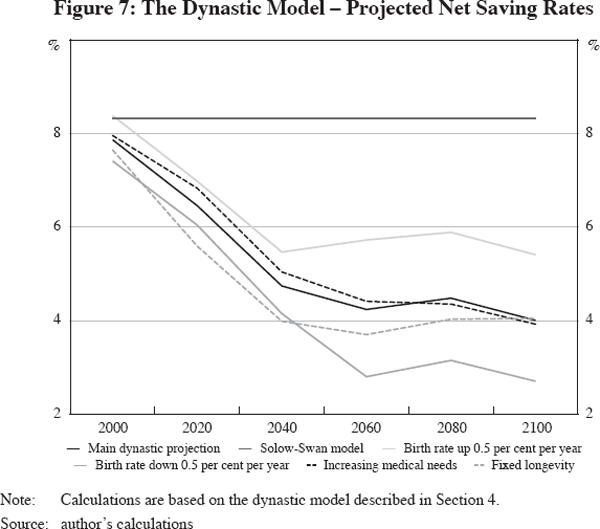
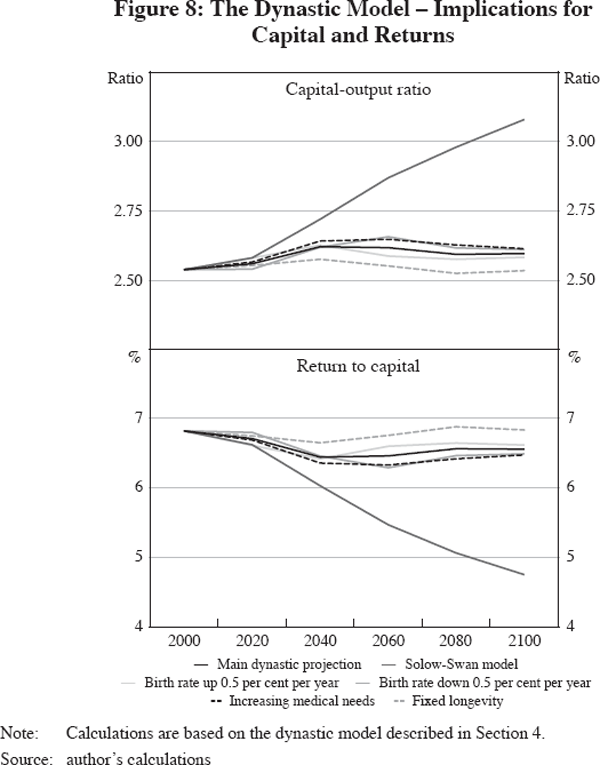
The optimal saving rates in Figure 7 show a substantial and persistent decline in the main projection and in all the alternatives. In this model, saving rates for 2000 are optimised and not calibrated to match actual saving rates, but they match quite well. The capital-output ratios in Figure 8 (top panel) increase slightly and then decline. The returns to capital in Figure 8 (lower panel) mirror the capital-output ratios, declining first and then increasing.
Three features of the calibrated findings deserve comment. First, a central finding is that in the dynastic model returns to capital are fairly stable over time and across scenarios. This stands in contrast to the secular declines projected in the Solow-Swan and life-cycle models. In the dynastic model, population ageing does not imply capital deepening. The economic intuition regarding this result is that fewer births implies a reduced weight on future generations in the dynastic preferences. There is no need to endow them with more capital than current cohorts. The saving rate declines sharply. The length of retirement and the level of old-age medical expenses have very little impact. At the margin, higher retirement and medical spending are financed by reductions in bequests.
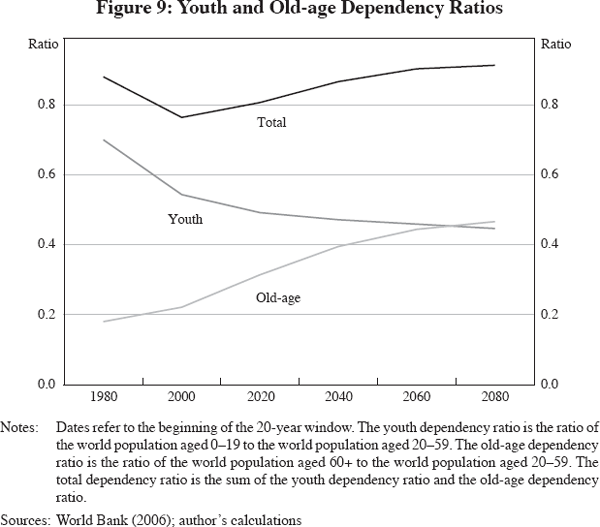
Second, projected returns show a temporary decline around 2040. Figure 9 provides the economic intuition. During the demographic transition, youth dependency declines with the birth rate, whereas old-age dependency rises with longevity. Until about 2020, birth rates decline more than longevity rises. The ratio of the non-working-age population to the labour force – the total dependency ratio – declines temporarily. This means that per-capita income is high relative to per-capita demand for consumption. The optimal private response is to accumulate more capital. This raises the capital-output ratio and it reduces the return to capital into 2040, as shown in Figure 8. The slight dip in returns provides the correct incentives for individuals to shift consumption into this period.
Third, projected returns remain above the 6 per cent steady-state value towards the end of the projection period, seemingly contradicting convergence to a steady-state. The intuition is that the dynastic model's optimal forward-looking behaviour is sensitive to variations in the effective labour force far into the future. The main projection assumes a slow convergence of world productivity to the US level. Slow convergence implies a prolonged period of productivity growth above the steady-state growth rate and hence returns to capital above the steady-state level.
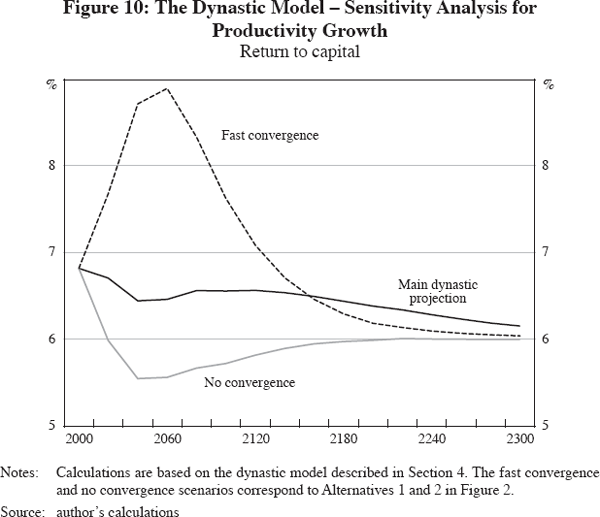
Figure 10 displays returns to capital over a longer horizon and for alternative growth scenarios. This is to clarify the relationship between productivity convergence and convergence of returns and as a reminder that demographic findings are conditional on growth. The scenario with fast cross-country convergence in productivity implies higher growth and higher returns to capital in the transition than the main scenario. As productivity convergence nears completion, world productivity growth converges down to the US rate (1.5 per cent) and the return to capital converges to the 6 per cent steady-state level. In the main projection, productivity convergence is slower. This explains why productivity growth and the return to capital remain slightly above the steady-state values for several hundred years. In the scenario without productivity convergence, growth never rises above the US level and the return to capital approaches the steady-state from below.[8]
Note that returns would also be higher (or lower) if the labour force were to grow faster (or more slowly) for other reasons. The labour force would expand, for example, if retirement were delayed – say, due to improving old-age health – or if female labour force participation increased. On the other hand, if innovation was linked to youth, an ageing population would reduce the effective labour supply. Labour supply would also decline if households decided to substitute leisure for consumption (for example, if leisure is a superior good in the long run). One may suspect, however, that these factors are swamped by uncertainty about future productivity and birth rates. This motivates my focus on saving and bequests as the main endogenous variables and on growth comparisons for sensitivity analysis.
Returning to the main projection, the dynastic model yields a detailed account of optimal consumption and optimal intergenerational transfers. This is shown in Figure 11 and the top panel of Figure 12. The allocation of consumption in Figure 11 documents an increase in optimal retiree consumption at the expense of childhood consumption, reflecting the shift in population shares.
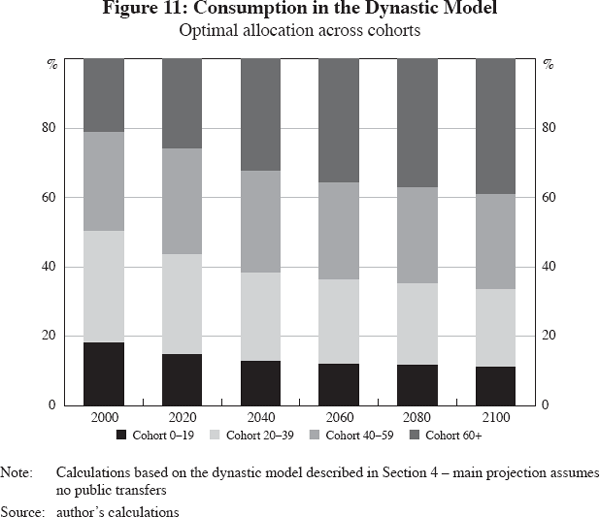
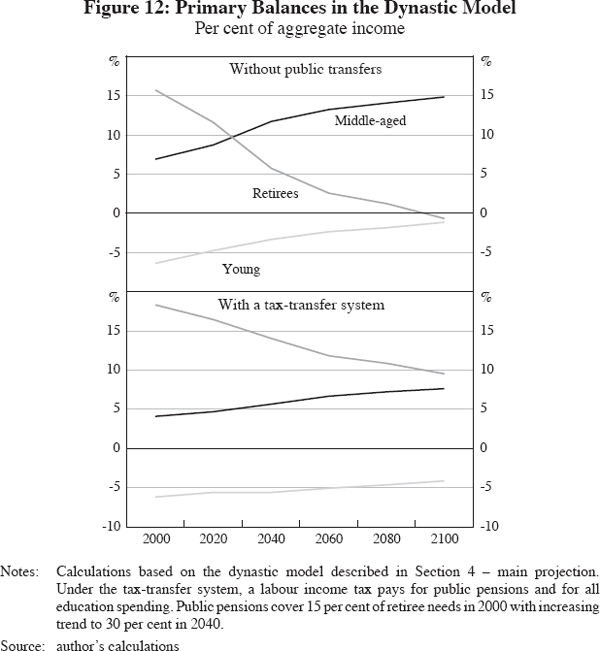
Figure 12 displays ‘primary balances’ of the respective cohorts, the gaps between own factor incomes and own consumption. Childhood consumption is included in the household consumption in young working-age (20–39). Capital income is attributed to retirees (60+). The sum adds up to the gross investment rate. The primary balance in old age is also the amount optimally bequeathed, gifted, or otherwise transferred to subsequent cohorts. Figure 12 (top panel) yields two key insights. First, optimal bequests are currently positive and quite high. Second, optimal bequests are projected to decline sharply during the demographic transition.
The sharp decline in bequests raises questions about a lower bound. Individual bequests in a literal sense must be non-negative. Bequests at the macroeconomic level are more complicated. If annuity markets are imperfect – say, due to adverse selection – accidental bequests must be strictly positive. Negative bequests may be feasible through public debt that exceeds the value of public capital. Either way, the key point is that a lower bound on aggregate bequests is likely to exist. I will call an economy bequest-constrained, if bequests are at the lower bound.[9]
Figure 12 (top panel) suggests that the world economy will eventually become bequest-constrained. At that time, dynastic reasoning would become irrelevant; a regime shift from a dynastic to life-cycle setting with exogenous bequests would take place. The key questions are then: is this likely to happen, and when?
5. Will Population Ageing Trigger a Regime Shift?
The answer is unfortunately not straightforward.
A major complication is the endogeneity of public institutions. A generation of retirees can avoid bequest constraints if it manages to create public institutions such as pensions, public debt and pay-as-you-go financed health benefits. The common effect of such institutions is to expand the resources controlled by retirees and hence to relax the bequest constraint. Political support for retiree transfers does not necessarily decline as the population ages; the share of old voters is increasing. Future generations that will have to pay for intergenerational transfers are not there to vote against them.[10]
To illustrate the impact of public transfers, Figure 12 (lower panel) shows primary balances adjusted for a stylised tax-transfer system. The calibration assumes that education is publicly funded and that public transfers cover 15 per cent of retiree spending in 2000, rising to 30 per cent by 2040, all financed through payroll taxes. Comparing the two panels of Figure 12, one finds that transfers substantially increase retirees' primary balances. The point is that, regardless of an economy's ‘natural’ lower bound on bequests, retirees can avoid bequest constraints by sufficiently expanding government transfers.
Rising retiree transfers would, however, create increased political risk. Hence, one may wonder if transfers are somehow bounded and a shift from a dynastic regime to a bequest-constrained regime will eventually take place. While this is difficult to resolve in theory, there are observable indicators that might help in practice.
To identify regimes, recall that the dynastic model applies when retirees have a surplus of resources to bequeath. Factors that might favour a dynastic equilibrium therefore include: (i) a low life expectancy in retirement; (ii) a resource-based economy where fixed assets (for example land, oil reserves) are often bequeathed; and (iii) stable public institutions that provides retirees with generous transfers and insurance against risks. Another important indicator is a relative stable return to capital.
The life-cycle model applies when old-age resources are sufficiently scarce that retirees would like to dissave more than they can. Factors that tend to favour a bequest-constrained life-cycle equilibrium therefore include: (i) longevity; (ii) an economy centred on human capital, where substantial transfers take place early in life as parents finance their children's education; and (iii) an unstable political system that does not provide retirees with reliable transfers or with social insurance.
Rising longevity clearly favours a transition from a dynastic to a bequest-constrained equilibrium. Economic growth points in the same direction, because economic development typically involves a decline in agrarian and industrial activities based on fixed assets and a transition to a knowledge-based society with more spending on education.
More-developed economies tend to have more stable governments, a more stable tax base and often more generous public pension and social insurance programs, consistent with a dynastic equilibrium. Public transfers are undermined, however, by the trend towards increased international openness that exposes governments to increasing tax competition (see below). Another important consideration for more-developed economies is the increasing sophistication of financial markets (which allow for annuitisation, thereby avoiding unintended bequests). With regard to annuities, market solutions are unfortunately constrained by adverse selection.
The indicators for the US and Europe are mixed. Prima facie, a significant share of retirees seem to act like life-cycle savers, relying largely on annuitised public pensions and holding little or no wealth for bequests. Others leave bequests, however, and according to US evidence, a majority of people have a bequest motive (Kopczuk and Lupton 2005). More indirect indicators are the historical stability of equity returns, the pervasive lack of interest in private annuities and reverse mortgages, and the ongoing pension reform debate.
Returns to capital have been remarkably stable over the past 200 years, despite substantial demographic changes. The stability of returns is well-recognised in growth theory and has been much studied in finance (see Siegel 1994, for example). The historical stability of returns is consistent with the dynastic model and difficult to reconcile with the drifting returns commonly found in life-cycle models.
Lack of interest in private annuities and reverse mortgages also fits the dynastic model. Life-cycle savers should annuitise all their financial assets. Even if annuities are actuarially unfair, life-cycle savers should prefer unfair payouts to leaving bequests. Similarly, life-cycle savers should take out reverse mortgages on their homes even if such mortgages are actuarially unfair.
The growth in public pensions in recent decades and the reform debate suggest that the dynastic model may be on the verge of becoming less relevant in many developed economies, at least looking forward. Recent pension reforms in Europe suggest that there is not much scope for further growth in the coverage or generosity of these systems. In the US, where public pensions are smaller, the recent expansion of Medicare (Part D) suggests that politicians still see room for growth. Yet the sustainability of social security and Medicare is widely questioned. In a dynastic setting, public pensions should be politically less interesting because ‘excess’ pensions would be returned to children as gifts or bequests – that is, Ricardian neutrality applies. However, major disputes about pensions suggest that they do matter.
In combination, these observations are consistent with the hypothesis that US and European retirees are on the edge of being bequest-constrained, but not yet seriously constrained – that bequests and the shadow value of bequest constraints are both near zero. One may argue that this knife-edge economic scenario represents a stable situation from a political-economy perspective – an equilibrium with ‘soft’ bequest constraints. The US and Europe may have been in this equilibrium for some time, perhaps decades.[11] This assessment is consistent with the growth in public pensions throughout the 20th century. Similar considerations may apply to Australia, Canada, Japan and other developed countries.
Less-developed countries, in contrast, appear to be far from a life-cycle savings regime. Public pensions and other transfer systems are more rudimentary. Traded equities are much smaller relative to GDP than in developed countries. Most national wealth is concentrated in family-based firms where ownership tends to be inherited and not purchased. This suggests a prevalence of wealth accumulation through bequests.
To conclude, it seems reasonable to use life-cycle reasoning for the US, Europe and some other developed economies, at least looking forward, but not for the entire world.
Note that life-cycle models can be useful even if bequest constraints are soft. They correctly describe individual behaviour, provided bequests and other intergenerational transfers are correctly calibrated. Dynastic and life-cycle models should then yield similar results. One must be careful, however, to reconcile potentially conflicting predictions, notably about bequests and about returns to capital.
Figure 13 illustrates how life-cycle projections can be modified if one alters assumptions about bequests as suggested by the dynastic model. The figure displays projections from the life-cycle model under the assumption that retirees will find ways to avoid unintentional bequests. Specifically, I assume that by 2040, bequest shares in all countries decline to 50 per cent of the current US level. For comparison, the figure also shows the basic Solow-Swan, life-cycle and dynastic projections. The life-cycle projections with declining bequests are much closer to the dynastic scenario than to the basic life-cycle scenario. Returns to capital remain stable until bequests reach a fixed (lower bound) level.
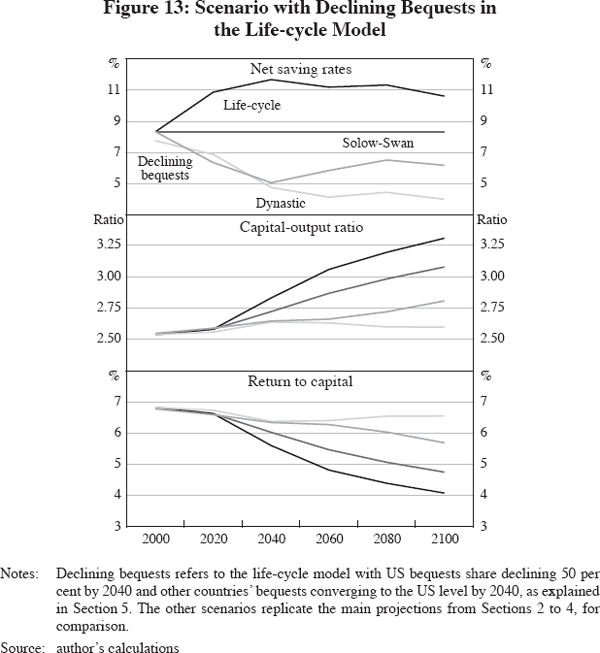
In summary, life-cycle predictions for the world economy should be interpreted with caution if large parts of the world are not – at least not yet – bequest-constrained. A major decline in the return to capital seems unlikely until bequest constraints start binding and until individuals have economised on accidental bequests.
6. Capital and Labour Mobility, Platform Competition and Risk-sharing
This section examines a set of interrelated issues regarding factor mobility, economic policy and financial markets.
The standard approach in multi-country models with capital mobility is to assume largely immobile labour. Because labour is immobile, capital must move internationally to equip labour with the efficient stock of capital. This approach has led analysts to focus on capital flows and on the implications of capital income taxes. Source-based capital income taxes – taxes on dividends, interest and capital gains – clearly distort the spatial allocation of capital. Expectations of future taxes (or more broadly, concerns about expropriation, regulation and other return-reducing measures) are also distortionary because capital investment is driven by expected returns. A perfectly efficient allocation of capital would require perfectly credible government promises not to tax returns.
Labour has become increasingly mobile around the world. While some countries have long welcomed immigrants – notably Australia, Canada and the US – declining transport costs are enabling an increasing number of people to move abroad in search of employment opportunities, with or without permission. This is important for two reasons.
First, labour mobility is a substitute for capital mobility for questions of production efficiency. If capital were immobile, capital-labour ratios could still be equalised across countries by mobile workers. A world with perfectly mobile labour would have the same world capital-labour ratio as a world with mobile capital. The returns to capital and the returns to labour (per efficiency unit) are equalised in either case. Note that workers have no incentive to move if capital is allocated efficiently. Migration is thus an indicator of inefficiency in the allocation of capital. Plausible sources of such inefficiencies are capital income taxes and concerns about capital levies in the future.
Second, labour mobility combined with capital mobility has drastic implications for fiscal policy that deserve more attention. In models with at least one immobile factor of production, the location of the fixed factor(s) determines the geography of production. But what if all factors of production become mobile? What determines where production takes place and where factor incomes can be taxed?
To a first approximation, the cross-country allocation of production becomes indeterminate without fixed factors. Given first-order indeterminacy, location decisions are determined by factors and considerations that would otherwise be considered secondary and perhaps ignored, for example geographical features such as harbours, coastlines, or soil quality. Relative to the remaining ‘natural’ fixed factors, public policy – taxation and the provision of public infrastructure – becomes vastly more important. It has first-order effects on the location of capital and labour.
A numerical example helps to illustrate the ramifications of mobility.
Example: Consider an economy that takes world factor prices as exogenous. Output is produced from capital and labour at constant returns to scale, but with a small congestion effect – say, an externality due to a fixed land area. For the illustration, let TFP depend on population density with elasticity ε, a small negative number. Domestic supplies of capital and labour may respond to returns and wages, though this will be inessential. To be specific consider ε = −1 per cent and ε = −2 per cent (for comparison), let domestic capital supply have an elasticity of 0.5 with respect to capital income and let labour supply have an elasticity of 0.5 with respect to wages.[12]
Table 1 displays elasticities of capital and labour in domestic production with respect to capital and labour income taxes under three alternative assumptions about mobility. Tax responses are expressed as elasticities with respect to (1–τ), where τ is the tax rate (on either capital or labour income). A positive value means that a tax reduction (a higher ‘1–τ’) attracts capital and/or labour. The implied capital-labour ratio and output responses are also provided.
| Mobility of capital: Mobility of labour: |
Fixed Fixed |
Mobile Fixed |
Mobile Mobile |
|||||||
|---|---|---|---|---|---|---|---|---|---|---|
| Externality: | 1% | 2% | 1% | 2% | 1% | 2% | ||||
| Elasticities with respect to (1–τ) | ||||||||||
| Capital stock | ||||||||||
| Capital tax | 0.38 | 0.38 | 1.64 | 1.64 | 44.30 | 22.90 | ||||
| Labour tax | 0.12 | 0.12 | 0.50 | 0.50 | 100.00 | 50.00 | ||||
| Labour force | ||||||||||
| Capital tax | 0.05 | 0.05 | 0.21 | 0.21 | 42.90 | 21.30 | ||||
| Labour tax | 0.45 | 0.45 | 0.50 | 0.50 | 100.00 | 50.00 | ||||
| Capital-labour ratio | ||||||||||
| Capital tax | 0.33 | 0.33 | 1.43 | 1.43 | 1.43 | 1.43 | ||||
| Labour tax | −0.33 | −0.33 | 0.00 | 0.00 | 0.00 | 0.00 | ||||
| Output | ||||||||||
| Capital tax | 0.15 | 0.15 | 0.64 | 0.64 | 42.70 | 21.60 | ||||
| Labour tax | 0.35 | 0.34 | 0.49 | 0.49 | 98.60 | 49.30 | ||||
|
Note: Values >1 are highlighted in bold. Source: author's calculations |
||||||||||
If the economy is closed, all the tax elasticities are less than 0.5, that is, less than the local factor supply elasticities (data columns 1 and 2). Capital and labour respond negatively to both taxes because they are complements in production. The congestion effect is essentially irrelevant, clearly secondary.
If capital is mobile but labour is fixed (columns 3 and 4), capital, output and the capital-labour ratio respond much more strongly to capital income taxes – confirming conventional wisdom – whereas labour income taxes have a similar impact as in the closed economy. The capital and the capital-labour ratio respond elastically to capital income taxes regardless of local capital and labour supplies.[13] Congestion effects are still secondary.
Now consider mobile capital and mobile labour (columns 5 and 6). Capital, labour and output all display huge responses to both capital and labour taxes. The responses are governed almost entirely by the congestion effect and not by the fundamentals of production and factor supplies.[14] In equilibrium, reduced taxes trigger an inflow of capital and labour until congestion has increased enough to offset the competitive advantage of lower taxes. A tax increase would trigger capital and labour outflows until congestion has decreased enough to offset the competitive disadvantage.
The example demonstrates that moving from one to two mobile factors implies a quantum leap in the responsiveness of capital, labour and domestic output to changes in tax rates. Traditional discretionary income taxation would become almost impossible. Consumption taxes would not help either, because workers could simply emigrate in response to high consumption taxes and capital would follow them.
This problem has similarities to the problem of tax competition between local authorities within a country. The literature on fiscal federalism has long recognised that mobile factors are best taxed at a ‘federal’ level. The difference here is not only that there is no world tax authority, but that national sovereignty precludes binding commitments. Whereas local authorities within a country can sign enforceable agreements to limit tax competition and/or to share their common tax base, such collusion is difficult across sovereign nations. As in any cartel, countries would have strong incentives to renege on agreements to limit tax competition.
Note that optimal location decisions are determined not only by taxes, but by taxes in relation to amenities such as infrastructure – again similar to local tax competition. International mobility does not restrict taxes used for productive purposes. It mainly restricts redistributional taxes. Governments that provide public services efficiently are moreover ‘rewarded’ with capital and labour inflows. Hence the issue is broader than tax competition. In essence, countries compete to serve as alternative ‘platforms’ for combining capital and labour.
Returning to population ageing, the main implication of platform competition is that countries cannot credibly promise to tax future generations for the benefit of retirees. An inherited burden of promised retirement benefits must fall on either labour or capital. Taxes on labour would trigger an exit of productive workers and their capital, leaving behind retirees and less productive workers. With regard to capital, a mere suspicion that capital might be taxed to bail out public pension will do damage. Either way, inherited fiscal obligations are a handicap in a cross-country competition for mobile factors because they raise questions about future taxes.
Policy expectations may also matter for labour if migration decisions are driven by expectations about future incomes – say, by young workers deciding where to settle down. Migration will then be influenced by fiscal burdens as signals about future taxes. Forward-looking migration will also depend on workers' expectations about the spatial allocation of capital. This is because capital and labour are complements in production. Countries that are more successful in attracting capital will offer higher wages. Migration between Mexico and the US is suggestive of this linkage. Contrary to widespread expectations that the North American Free Trade Agreement would create jobs in Mexico, the US continues to attract both capital and labour; for attracting capital, it helps to be known as the bastion of capitalism.
In summary, increasing capital and labour mobility provides an argument why transfers to retirees cannot continue to grow. If tax competition increases sharply, retiree benefits may even have to decline, at least in some countries. As retirees must save more for their own retirement, more of them will become bequest-constrained.
On financial markets, more severe bequest constraints will create a growing demand for annuity-type investment products. Eventually, when savers have exploited all means to avoid accidental bequests, world savings will be determined by life-cycle considerations.
Mobility has implications not only for inherited fiscal burdens, but also for the ability of governments to deal with macroeconomic and demographic shocks. Currently, governments can deal with disturbances on an ex post basis, often by bailing out the victims at the expense of taxpayers. This applies not only to natural disasters such as hurricanes, but also to costly macroeconomic disturbances, such as banking crises and cyclical unemployment and to demographic disturbances, such as the pension cost of increased longevity.
Ex post settlements will cease to work if mobile factors can exit if a government tries to charge them for a bail-out. Savers may even demand a risk premium in advance.
A more efficient way to deal with aggregate disturbances is to take out insurance ex ante. Increasing international integration should allow nations to lay off country-specific risks on world financial markets, just like individuals carry insurance for microeconomic risks. Such insurance would require risk premiums only to the extent that a country-specific risk is correlated with global changes. Insurance-type contracts for aggregate risks will become increasingly valuable as tax competition grows and hence a likely area for growth in financial markets. Existing examples are disaster bonds and forward contracts for natural resources. Bohn (2002) outlines how governments can use state-contingent bonds to hedge against a range of macroeconomic and demographic risks.
Monetary policy has a significant role in this context. On the downside, money creation has long been used as a shock absorber, an instrument of last resort for governments facing fiscal problems. Despite the current trend towards low inflation and central bank independence, money creation would probably be used again if governments ran out of other options. Insurance against aggregate shocks is thus a contribution to monetary stability.
On the upside, monetary policy can be welfare-improving in a setting with generally stable prices and nominal government debt. Provided general price stability is ensured – say, through a credible target for medium-term inflation – monetary policy can provide insurance against aggregate shocks by letting inflation vary in response. For example, if it were understood that inflation will be 1 per cent above normal in the year after a major disaster, a nominal bond would be equivalent to a disaster bond. Note that insurance is obtained through bond values, not through seignorage, so this is not about monetisation.
Insurance through nominal bonds and a responsive monetary policy is particularly valuable against shocks that are difficult to define in advance. Disaster bonds, for example, must include a precise definition of what constitutes a disaster. Monetary authorities have a long tradition of serving as lender of last resort, particularly in responding to unanticipated, emergency-type situations. They are generally well-positioned to manage insurance through nominal bonds in a flexible manner. It is a matter of political judgment if monetary policy in a particular country is sufficiently credible to play this role.
7. Summary and Conclusions
This paper examines population ageing in an integrated world economy. The focus is on how individuals can be expected to respond. I compare responses in three standard economic models – the Solow-Swan model with fixed savings, a life-cycle model with optimal savings, and a dynastic model with optimal savings and optimal bequests. The public sector is treated as endogenous, reflecting savers' preferences as expressed through voting.
The models yield different conclusions about the impact of population ageing on future saving rates, capital accumulation and interest rates because of their different assumptions about bequests. While the Solow-Swan and life-cycle models suggest rising capital-labour ratios, rising capital-output ratios and declining returns to capital, the dynastic model predicts declining saving rates and bequests and a more stable world return to capital.
I argue that the future of bequests depends crucially on the future of public transfer systems – particularly pensions and retiree health care. Prospects for transfers in turn depend on the strength of future cross-country tax competition, not only for capital but also for labour.
It appears that a substantial share of the world capital stock is due to bequests rather than life-cycle savings. This raises questions about the life-cycle model as a tool for economic analysis. While retirees in developed countries may be close to a bequest constraint that makes life-cycle reasoning applicable, dynastic reasoning seems appropriate for developing countries. Even for developed countries, one may argue that bequest constraints have historically been rather ‘soft’ and not critical for the return to capital.
As desired bequests decline, financial markets should experience sharply growing demand for annuity- and insurance-type products that economise on bequests. As tax competition increases with more capital and labour mobility, governments have increasing incentives to hedge against disturbances ex ante and to avoid the damaging alternative of ex post taxation. Monetary policy has a role in this context if fiscal authorities issue nominal bonds. Provided a credible commitment to low average inflation is maintained, an elastic response of inflation to macroeconomic shocks can provide a flexible form of insurance against a variety of disturbances.
Looking forward, dynastic reasoning suggests that the world return to capital will remain higher than life-cycle models of population ageing would imply. Returns may even rise, especially if productivity growth in developing countries raises the demand for capital. The decline in returns predicted by life-cycle models should become relevant only after individuals run out of options for minimising their bequests.
Appendix A
This appendix explains the macroeconomic framework for the calibrations. Output Ymt for country m in period t is written as function of capital Kmt, labour Lmt and productivity Amt:

assuming a Cobb-Douglas functional form. The productivity index Amt (TFP) can be expressed as relative productivity Âmt times the productivity of a reference-country productivity (here the US): Amt = Âmt · AUS,t. Competitive wages and interest rates are obtained as marginal products

where δ is a depreciation rate. The calibrations assume a 30 per cent capital share and 5 per cent annual depreciation.
Assuming capital is mobile and untaxed, returns are equalised across countries: rmt = rt. The return equation shows
that capital-labour ratios kmt =
Kmt /(AmtLmt) are also
equalised:
kmt = kt. Wages are proportional
to TFP and each country's capital stock is proportional to the effective
labour force. The world capital-labour ratio is easy to compute from the
world capital stock Kt = ∑mKmt
and the world effective labour force  . Note that
  This implies that
  .
.
All other variables follow from kt; notably returns to capital  wages
wages  ; per-capita incomes
  ;
and world output
  .
.
The capital-labour ratio has an awkward dimensionality, dollars per effective labour
unit as measured by a productivity index. The capital-output ratio, in contrast,
is unit-free and can be expressed as a monotone transformation  . For this reason, my figures show capital-output
ratios and not capital-labour ratios.
For the projections, the capital-output ratio in each country is initialised in 1980 from Solow-Swan's steady-state condition Kmt/Ymt ≈ sm/(gm+δ), where sm is the gross savings rate and gm the GDP growth rate. For comparability with life-cycle projections, time is divided into 20-year intervals. Because depreciation is difficult to time-aggregate, my figures report results for net rather than gross savings.
Historical productivity is exactly identified in the data from output, labour forces and capital stocks. Going forward, the main projection assumes 1.5 per cent annual US productivity growth. For countries with growing relative productivity over 1980–2000, the baseline projection assumes that Âmt converges to 1 exponentially, starting at the 1980–2000 convergence rate; otherwise Âmt is held constant at the 2000 level. Alternative 1 assumes faster convergence, specifically the Lucas (2000) assumption that relative productivity growth in non-US economies will grow at a 2.5 per cent per annum. Alternative 2 (no convergence) holds Âmt constant at 2000 levels for all countries.
For the optimising models, I assume preferences over consumption of the form  .
.
where ci,t is the consumption at age i in period t, πi,t are survival probabilities, ωi are time-preference factors and u(c) = c1–γ/(1 − γ) has a constant elasticity of substitution EIS=1/γ. Indexing by country is suppressed here to avoid clutter. Age i = 0 is childhood, i = 1,2 are working ages, i = 3 is retirement. Children's consumption is determined by their age–1 parents.
In the life-cycle model of Section 3, adults have preferences over their own consumption and over the consumption of children only while they remain in the parent's household: Vt = Ut + β · n0,t · u(c0,t), where n0,t is the number of children per adult. In the dynastic model of Section 4, adults have ‘Ricardian’ preferences Vt = Ut + β · n0,tVt+1 over their own consumption and over their children's utility.
Let Ni,t be the size of cohort i at time t. Population dynamics are determined by the survival probabilities and by the number of children per young adult (n0,t); given a birth cohort N0,t at time t, the same cohort in later periods has size Ni+1,t+1 = Ni,t · πi,t, for i = 1,2,3. The next cohort has size

at birth. The growth rate between successive cohorts is therefore nt+1 = n0,t+1π1,t+1. A country's effective labour force is defined by Lt = N1,t + E · N2,t, where E is the productivity of middle-aged relative to young workers (E = 1.25 in the calibrations). Increased longevity is calibrated as an increase in π3,t over time. A decline in birth rates is calibrated as a decrease in nt over time.
In the life-cycle model, I assume that young households are liquidity-constrained.
They maximise Vt over their own and their children's consumption,
given their own wage. Middle-aged households maximise Vt
over current and retirement consumption, given their wage and incoming bequests.
Retirement consumption is subject to an ‘accidental bequests’
constraint: a share qt+1 of resources in retirement
cannot be consumed before death. The key budget constraints are c2,t
+ at = Ewt + Qt
and  , where a = assets, w = wage,
and Q = bequests received. The bequest constraint is binding in
equilibrium and implies
  .
.
In the dynastic model, each cohort operates under the budget constraint that the present value of income plus bequests received equals the present value of consumption plus transfers to children (in childhood or as bequests), assuming no binding constraint on bequests.
The main projections assume a 1 per cent annual rate of time preference on own consumption. ω0 is calibrated so that children's raw per-capita consumption is half of their parents'. In addition, children consume education. The cost is based on Barro and Lee's (2001) schooling data valued at 40 per cent of per-capita consumption per student. This raises the effective value of ω0 to about 0.63. To obtain a 6 per cent steady-state return to capital in the dynastic model, I assume β = 0.54 per 20-year generational time-unit. The preference assumptions yield a dynastic age-consumption profile similar to Elmendorf-Sheiner (2000). For the alternative scenario with higher preferences for medical spending, ω3 is increased by 15 per cent.
Footnotes
Department of Economics, UCSB, Santa Barbara, CA 93106. E-mail: bohn@econ.ucsb.edu. Home page: http://econ.ucsb.edu/~bohn. I would like to thank the lead discussant, Mariano Kulish, and the other conference participants for their insightful comments. The paper was previously circulated under the title ‘Optimal Private Responses to Demographic Trends: What Can Theory Tell Us?’. [1]
Though the return to capital is linked to various interest rates, I refer to returns because the term interest rate is commonly associated with safety, which would be misleading here. Although I will not explicitly model risk, one should keep in mind that, on aggregate, savings are invested in capital assets with uncertain returns. [2]
Bequest motives and the quantitative role of bequests are the subject of an extensive debate. See Kopczuk and Lupton (2005) for a recent review and discussion of bequest motives. While bequest motives are still controversial, it seems clear that bequests account for a substantial fraction of aggregate wealth. Kotlikoff and Summers (1981) suggest values as high as 46 per cent for the US. [3]
A ‘warm glow’ type of altruism could also be modelled through bequest shares. Suppose individuals had homothetic preferences over their own consumption and per-recipient bequests. For constant longevity and a constant number of descendents, a constant bequest share would again be optimal. If longevity increases and the number of descendents decreases, however, the optimal bequest share would decline over time. To avoid clutter, I do not model ‘warm glow’ altruism separately; the implications for savings go in the same direction as the dynastic model discussed in Section 4. [4]
Australia, Canada, France, Germany, Italy, Japan and the United Kingdom. [5]
The disaggregation is mainly for better comparability with the multi-country literature. The model would yield similar qualitative insights if one treated the world as a single region. [6]
Coverage of developing countries matters in this context. Declining capital-labour ratios are sometimes found in life-cycle models of developed countries, notably when one assumes rapid (and potentially unsustainable) rises in public transfers to retirees. When developing countries are included, however, declines in the capital-labour ratio turn into increases, for example when moving from developed countries in Fehr et al (2005) to developed countries plus China in Fehr et al (this volume). [7]
The below-normal growth in the ‘no convergence’ case is due to a composition effect. TFP relative to the US productivity remains constant. The labour force grows faster in relatively poor countries. This reduces the growth in average world productivity until the demographic transition is complete. [8]
The definition clearly disregards heterogeneity across consumers, that is the possibility that some dynasties are constrained and others are not. This is to maintain a focus on macroeconomic issues. [9]
Bohn (2005) examines voting on US Social Security and Medicare in some detail. Both provide net benefits for a majority of older voters. Benefits are negative at young ages, but affect only a minority of voters. Analogous considerations should apply elsewhere. Boldrin and Montes (2005) provide a similar, though more benign, perspective of retiree transfers. They note that education is commonly provided publicly and suggest that public pensions can be interpreted as a repayment of implicit loans for education. It is not clear why Boldrin and Montes limit their interpretation to spending on education. Total parental support for children, for consumption and education, vastly exceeds any reasonable measure of net transfers to retirees, now and in the foreseeable future. In the spirit of Boldrin and Montes, one may therefore interpret all retiree transfers as partial repayment of childhood support. [10]
The argument is that no voter is interested in expanding transfers beyond the point where Ricardian neutrality applies, given the inefficiencies of a too-big government. Voters have a clear incentive, on the other hand, to create pension entitlements and public debt if necessary to avoid ‘hard’ bequest constraints in old age. A gradual expansion of pensions just enough to avoid hard constraints is a plausible outcome. [11]
Additional technical assumptions are that production is Cobb-Douglas with a capital share of 0.30, depreciation is 5 per cent and the world capital-labour ratio is 2.5. [12]
The elasticity of the capital-labour ratio is always 1/(1–capital share); it depends only on the capital share. [13]
The labour response to a labour tax is simply |1/ε| (100 for ε = −1 per cent, 50 for ε = −2 per cent). The labour response to a capital tax is |1/ε| times (capital share)/(1–capital share) ≅ 0.43. Because the capital-labour ratio remains unchanged, output responses equal the labour responses minus the congestion effect. [14]
References
Attanasio OP, S Kitao and GL Violante (2006), ‘Quantifying the Effects of the Demographic Transition in Developing Economies’, Advances in Macroeconomics, 6(1), Article 2. Available at <http://www.bepress.com/bejm/advances/vol6/iss1/art2>.
Auerbach AJ and LJ Kotlikoff (1987), Dynamic Fiscal Policy, Cambridge University Press, Cambridge.
Barro RJ and J-W Lee (2001), ‘International Data on Educational Attainment: Updates and Implications’, Oxford Economic Papers, 53(3), pp 541–563.
Batini N, T Callen and W McKibbin (2006), ‘The Global Impact of Demographic Change’, IMF Working Paper No WP/06/9.
Bohn H (2001), ‘Social Security and Demographic Uncertainty: The Risk-Sharing Properties of Alternative Policies’, in JY Campbell and M Feldstein (eds), Risk Aspects of Investment-Based Social Security Reform, University of Chicago Press, Chicago, pp 203–241.
Bohn H (2002), ‘Retirement Savings in an Ageing Society: A Case for Innovative Government Debt Management’, in AJ Auerbach and H Herrmann (eds), Ageing, Financial Markets and Monetary Policy, Springer, Heidelberg, pp 139–181.
Bohn H (2003), ‘Intergenerational Risk Sharing and Fiscal Policy’, UCSB Department of Economics Working Paper. Available at <http://econ.ucsb.edu/%7Ebohn/papers/igrisk.pdf>.
Bohn H (2005), ‘Will Social Security and Medicare Remain Viable as the U.S. Population is Aging? An Update’, in R Brooks and A Razin (eds), Social Security Reform: Financial and Political Issues in International Perspective, Cambridge University Press, Cambridge, pp 44–72.
Bohn H (2006), ‘Who Bears What Risk? An Intergenerational Perspective’, in D Blitzstein, OS Mitchell and SP Utkus (eds), Restructuring Retirement Risks, Oxford University Press, Oxford, pp 10–36.
Boldrin M and A Montes (2005), ‘The Intergenerational State: Education and Pensions’, Review of Economic Studies, 72(3), pp 651–664.
Börsch-Supan A (2005), ‘Aging, Pension Reform, and Capital Flows: A Multi-Country Simulation Model’, NBER Working Paper No 11850.
Börsch-Supan A, A Ludwig, and J Winter (2002), ‘Ageing and International Capital Flows’, in AJ Auerbach and H Herrmann (eds), Ageing, Financial Markets and Monetary Policy, Springer, Heidelberg, pp 55–83.
Braun RA, D Ikeda and D Joines (2004), ‘Savings and Interest Rates in Japan: Why They Have Fallen and Why They Will Remain Low’, University of Southern California Working Paper.
Brooks R (2003), ‘Population Aging and Global Capital Flows in a Parallel Universe’, IMF Staff Papers, 50(2), pp 200–221.
Constantinides GM, JB Donaldson and R Mehra (2002), ‘Junior Can't Borrow: A New Perspective on the Equity Premium Puzzle’, Quarterly Journal of Economics, 117(1), pp 269–296.
De Nardi M, S Imrohoroglu and TJ Sargent (1999), ‘Projected U.S. Demographics and Social Security’, Review of Economic Dynamics, 2(3), pp 575–615.
Diamond PA (1965), ‘National Debt in a Neoclassical Growth Model’, American Economic Review, 55(5), pp 1126–1150.
Elmendorf DW and LM Sheiner (2000), ‘Should America Save for its Old Age? Fiscal Policy, Population Aging, and National Saving’, Journal of Economic Perspectives, 14(3), pp 57–74.
Fehr H, S Jokisch and LJ Kotlikoff (2005), ‘The Developed World's Demographic Transition – The Roles of Capital Flows, Immigration, and Policy’, in R Brooks and A Razin (eds), Social Security Reform: Financial and Political Issues in International Perspective, Cambridge University Press, Cambridge, pp 11–43.
Hall RE (1988), ‘Intertemporal Substitution in Consumption’, Journal of Political Economy, 96(2), pp 339–357.
Heston A, R Summers and B Aten (2002), ‘Penn World Table Version 6.1’, Center for International Comparisons at the University of Pennsylvania (CICUP), October.
IMF (International Monetary Fund) (2004), World Economic Outlook: The Global Demographic Transition, IMF, Washington DC.
Kopczuk W and JP Lupton (2005), ‘To Leave or Not To Leave: The Distribution of Bequest Motives’, NBER Working Paper No 11767.
Kotlikoff LJ and L Summers (1981), ‘The Role of Intergenerational Transfers in Aggregate Capital Accumulation’, Journal of Political Economy, 89(4), pp 706–732.
Lucas RE Jr (2000), ‘Some Macroeconomics for the 21st Century’, Journal of Economic Perspectives, 14(1), pp 159–168.
Ogaki M and CM Reinhart (1998), ‘Measuring Intertemporal Substitution: The Role of Durable Goods’, Journal of Political Economy, 106 (5), pp 1078–1098.
Poterba JM (2001), ‘Demographic Structure and Asset Returns’, Review of Economics and Statistics, 83(4), pp 565–584.
Poterba JM (2004), ‘The Impact of Population Aging on Financial Markets’, NBER Working Paper No 10851.
Samuelson PA (1958), ‘An Exact Consumption-Loan Model of Interest with or without the Social Contrivance of Money’, Journal of Political Economy, 66(6), pp 467–482.
Siegel JJ (1994), Stocks for the Long Run, 1st edn, Irwin Professional Publishing, Burr Ridge.
Solow RM (1956), ‘A Contribution to the Theory of Economic Growth’, Quarterly Journal of Economics, 70, pp 65–94.
Swan TW (1956), ‘Economic Growth and Capital Accumulation’, Economic Record, 32, pp 334–361.
UN Population Division (2005), World Population Prospects: The 2004 Revision, United Nations, New York. Available at <http://esa.un.org/unpp/>.
World Bank (2006), ‘Health, Nutrition & Population: Data & Statistics’. Available at <http://web.worldbank.org/>.