RBA Annual Conference – 2013 The Impact of Unconventional Monetary Policy on the Overnight Interbank Market Morten L Bech and Cyril Monnet[*]
1. Introduction
The modus operandi of central banks in terms of implementing monetary policy has changed materially over the last six years since the start of the global financial crisis. Prior to the crisis, many central banks implemented monetary policy by specifying a target for the rate on unsecured loans of overnight funds between banks. The target rate in turn influenced other interest rates and hence financing conditions in the wider economy. The stance of monetary policy was loosened (tightened) by lowering (increasing) the target for the overnight rate. Central banks guided the overnight rate through a combination of open market operations and standing facilities where banks could either deposit or borrow funds (against collateral).
However, in response to the financial crisis and the ensuing economic downturn, central banks adapted monetary policy in unconventional ways.[1] Central banks provided liquidity backstops to many parts of the financial system and cut policy rates aggressively to their effective lower bounds. Some central banks now even provide explicit guidance on how long policy rates will stay low. Moreover, several major central banks embarked on large-scale asset purchase programs or very long-term refinancing operations with a view to reducing either term premia or liquidity risk. Both types of measures significantly expanded central bank balance sheets.[2] Furthermore, many central banks loosened the collateral requirements in their funding operations while others began subsidising the funding costs of financial firms with a view to boosting credit availability to the real economy.
Yet, the current state of affairs is temporary and central banks will – sooner or later – exit from their current extraordinarily accommodative polices.[3] But where will they exit to in terms of monetary policy implementation (Cœuré 2013b)?
The unsecured money market showed an unexpected degree of fragility during the financial crisis. Lending at longer tenors all but disappeared and the reference rate setting process was shown to be faulty. The large amount of reserves pumped into the banking system by unconventional policies has further affected stressed market dynamics. To the extent that resilience has not improved and that the stressed conditions are not self-reversing, the unsecured overnight money market might not be the best choice as the first link in the chain of monetary policy transmission going forward. Moreover, the forthcoming implementation of global liquidity regulation also poses challenges for operational frameworks across jurisdictions (see Bech and Keister (2013)).
In other words, monetary policy implementation is at a crossroad and central banks are prudently exploring alternatives. For example, as noted by Stark (2011), a consequence of the financial crisis may be a move from unsecured to secured transactions in the interbank money market and this may trigger a similar move by central banks in terms of policy target.[4] In a similar vein, several members of the Federal Open Market Committee (FOMC) have raised the possibility that the federal funds rate might not, in the future, be the best indicator of the general level of short-term interest rates. They have also supported further staff study of potential alternative approaches to implementing monetary policy in the longer term and of possible new tools to improve control over short-term interest rates (FOMC 2013).
However, a challenge for devising alternative approaches is that the standard economic models for studying monetary policy implementation and the interbank market have some limitations. In particular, models of banks' reserve management in the tradition of Poole (1968), for example Woodford (2001), Bindseil (2004), Whitesell (2006) and Ennis and Keister (2008), focus solely on price (i.e. overnight rate) dynamics. Consequently, these models have little to say about quantity and liquidity dynamics, whose importance are now evident. Fortunately, a burgeoning amount of research is improving our understanding of the interbank money market, for example Afonso and Lagos (2012) and Bech and Monnet (2013). As interbank trading is explicitly included in these models, it is possible to discuss issues such as market structure, volume and liquidity. Moreover, as banks trade at different rates, these models also provide insights on intraday interest rate volatility.
In this paper, we start by documenting four stylised facts with respect to the impact of unconventional monetary policies on the price and quantity dynamics of the overnight money market. We look at six markets in developed economies. We show that the surge in excess reserves has driven overnight rates to the rate at which the central bank remunerates reserves. Furthermore, we illustrate how the expansion of excess reserves decreases market volume and reduces the volatility of the overnight rate. In addition, we provide prima facie evidence that counterparty risk affects the pricing of unsecured overnight loans between banks even when the market is flush with liquidity.
With the stylised facts in hand, we review the models in Poole (1968), Afonso and Lagos (2012) and Bech and Monnet (2013) within a common framework and compare how the predictions of the models stack up against the stylised facts. Based on the models, we find that the observed dynamics in the overnight money market are in line with what we would expect as a consequence of the observed market stresses and unconventional policies. Taken at face value, this suggests that once the unconventional policies and market stresses are reversed the unsecured overnight money market may, in fact, re-emerge and central banks will be able to resume their conventional modus operandi. There are a number of caveats to this assertion and we discuss them in the conclusion.
2. Stylised Facts
In this section, we document four stylised facts in terms of price and quantity dynamics in the overnight interbank market during the recent period of unconventional monetary policy. We focus on six markets in the developed world. The markets are the federal funds market for the US dollar, the Eonia market for the euro, the call loan market for the yen, the SONIA market for pound sterling and the overnight markets for Canadian and Australian dollars.[5]
The six panels of Figure 1 show the average overnight rate in each market – along with the prevailing rates at which banks could deposit or borrow funds from the central bank.
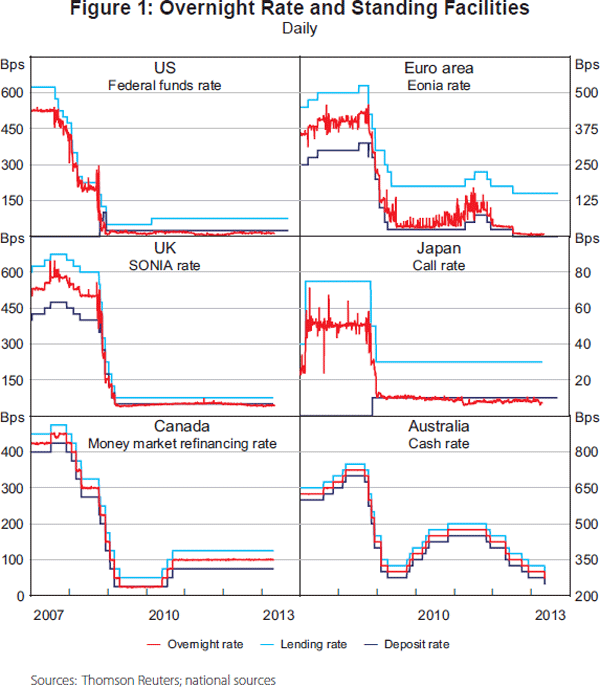
The substantial cuts in policy rates that followed the onset of the financial crisis are evident across all markets and six years later overnight rates remain significantly below those of mid 2007. With the exception of Australia, overnight rates in all markets have flirted with the zero lower bound.
In our sample, the Federal Reserve, the European Central Bank (ECB), the Bank of England, the Bank of Japan and the Bank of Canada have all implemented some form of unconventional policy measures and have seen a substantial increase in excess reserves as a result of liquidity backstops, asset purchases or very long-term refinancing operations (see Figure 2). In contrast, the Reserve Bank of Australia (RBA) has by and large relied on conventional policy measures. While the unconventional measures implemented differ across central banks and are likely to affect the overnight interbank market through different channels, we focus here solely on the increase in excess reserves. We conjecture that this is the most important channel. We see Australia as our ‘control market’ and the remainder as our ‘treatment group’.
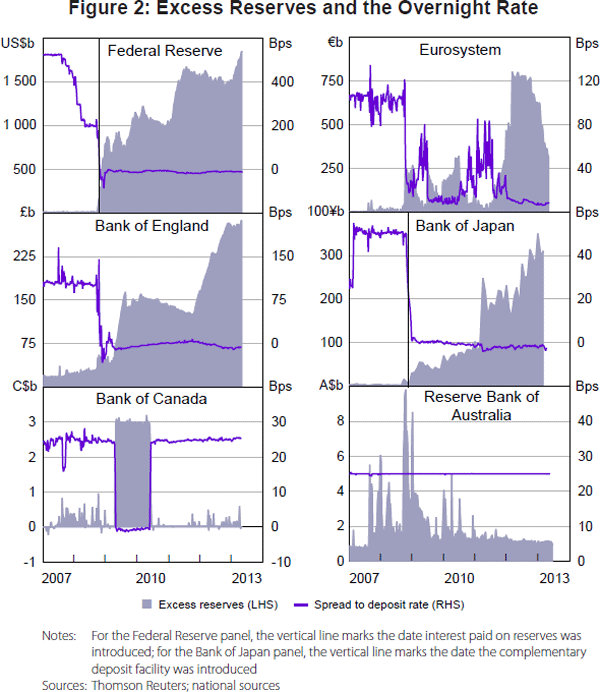
The stylised facts are that a massive increase in the amount of excess reserves in the banking system: (1) drives the overnight rate to the floor of the corridor; (2) reduces the volatility of the overnight rate; and (3) decreases market volume. In addition, we present prima facie evidence of a fourth stylised fact that counterparty risk affects the pricing of unsecured overnight loans between banks.
2.1 Stylised fact 1: Overnight rate at the floor of the corridor
Since late 2008, all six central banks have remunerated excess reserves and hence have been operating using a so-called corridor system.[6] As noted by Woodford (2001, p 38), in a corridor system:[7]
the demand for [overnight funds is] a function of the location of the overnight rate relative to the lending rate and deposit rate, but independent of the absolute level of any of these interest rates.
Hence, in addition to the amount of excess reserves, the panels of Figure 2 also plot the spread between the overnight rate and the central bank deposit rate. Within our treatment group this spread narrows as the amount of excess reserves increases. In particular, the spreads were compressed towards zero in jurisdictions where the amount of excess reserves surged. That is, the substantial increase in excess reserves drove overnight interbank rates towards the rate at which the central bank remunerates reserves, namely the floor of the corridor. Hence, these central banks abandoned their usual practice of keeping the overnight rate close to the midpoint of the corridor spanned by the standing facility rates. In contrast, Australia saw much smaller shifts in excess reserves and the RBA has been able to keep the cash rate at the centre of the 50 basis point wide corridor.
In some markets, the average overnight rate has moved below the deposit rate, that is, there is a negative spread to the deposit rate. This somewhat surprising outcome is due to a combination of market segmentation and limits to arbitrage. As discussed in Bech and Klee (2011), if not all market participants have access to the central bank deposit facility then the overnight market can bifurcate. If limits to arbitrage are severe enough, the disadvantaged participants may sell at lower rates. Hence, if their market share is sufficiently large, as a matter of simple arithmetic, the average overnight rate can print below the central bank deposit rate.
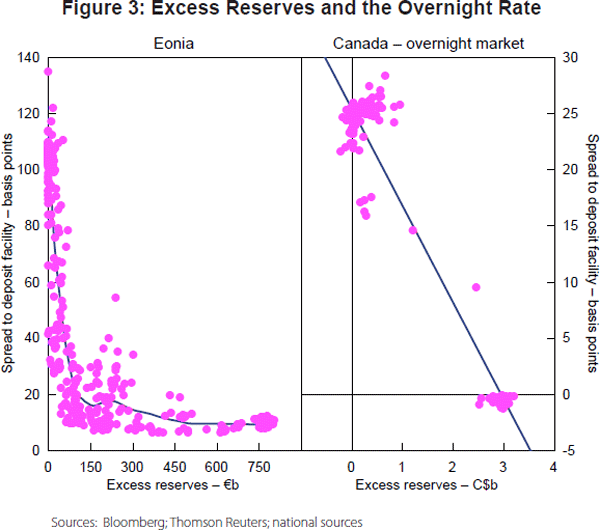
To highlight the inverse relationship between excess reserves and the overnight rate further, Figure 3 shows two scatter plots of excess reserves and the spread to the deposit facility rate for the Eonia and the Canadian overnight market (see also Zhang (2012)).
2.2 Stylised fact 2: Overnight rate volatility has decreased
In addition to pushing overnight rates to the floor of the corridor, the massive expansion of excess reserves has also tended to reduce the volatility of overnight rates. The panels in Figure 4 plot the amount of excess reserves together with the 28-day rolling standard deviation of the spread between the overnight rate and the central bank deposit rate.
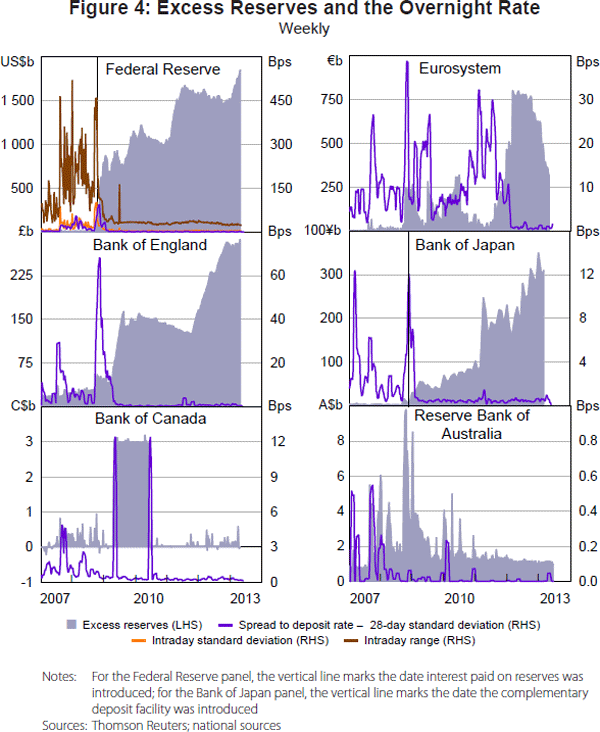
The panel for the Federal Reserve includes two measures of the intraday dispersion of transaction rates. Every day a number of brokers in the federal funds market submit to the Federal Reserve Bank of New York (FRBNY) the amount of the transactions they have brokered at different rates. Based on these data, the FRBNY determines not only the average federal funds rate plotted in Figure 4 but also the standard deviation of rates and the low and high rates of the day.
The panels in Figure 4 suggest that for central banks in the treatment group, overnight rate volatility decreased as central bank balance sheets expanded, while volatility in the Australian overnight market has remained fairly constant.
2.3 Stylised fact 3: The market volume has fallen
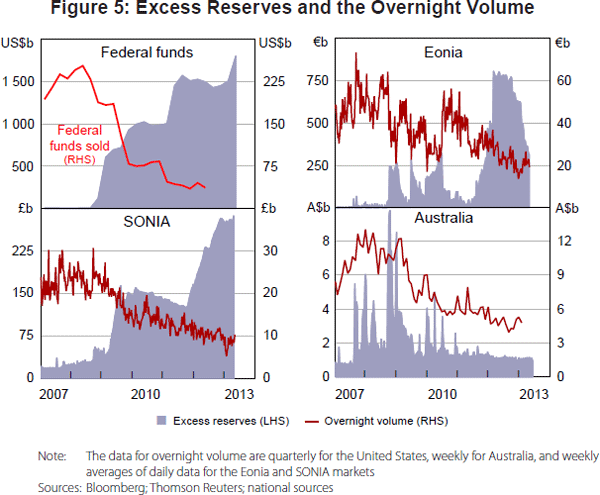
Figure 5 plots interbank market volume together with the amount of excess reserves for a number of markets. Unfortunately, volume information is not as readily available as information on the overnight rate. In fact, daily data are only publicly available for two of the six markets we consider here (Eonia and SONIA). To get a clearer picture of the impact of unconventional policies on market volume, we also look at quarterly market volume for the federal funds market and weekly information for the Australian overnight market.[8] The volume has fallen across all markets. For the Eonia and the federal funds market, the movement in volume broadly correlates with the movement in excess reserves. For the SONIA market the relationship in less pronounced but volumes have fallen significantly. For the Australian dollar market volume has fallen despite excess reserves being fairly constant over the period.
2.4 Stylised fact 4: Credit risk pushes up the overnight rate
The widening of interest rate spreads during the recent financial crisis represented both deteriorating liquidity and greater credit risk. Debelle (2008) describes the situation in the Australian money market at the outset of the financial turmoil as follows:
Beginning in August 2007, as banks became less certain of their own funding requirements and less confident of the credit profile of their counterparties, the interbank borrowing markets became quite tight. Banks were more inclined to hold onto cash, both because of an increased unwillingness to lend it, but also reflecting a concern about their ability to obtain funding themselves from the market in the future should they require it. This was most evident in term markets, where borrowing rates increased sharply. However, for similar reasons, there was an increased precautionary demand for [reserve] balances, reinforced by the fact that [reserves] are a risk-free asset. The effect was the demand curve for [reserves] shifted out.
A burgeoning literature seeks to disentangle the two effects, for example Michaud and Upper (2008), Taylor and Williams (2008, 2009), McAndrews, Sakar and Wang (2008), Christensen, Lopez and Rudebusch (2009), Heider, Hoerova and Holthausen (2009), Schwarz (2010) and Angelini, Nobili and Picillo (2011). However, with the banking system flush with excess reserves, liquidity hoarding is now likely to be less of an issue in the (overnight) interbank market but credit risk might still matter. Unfortunately, good measures of the impact of credit risk on overnight rates are hard to find.
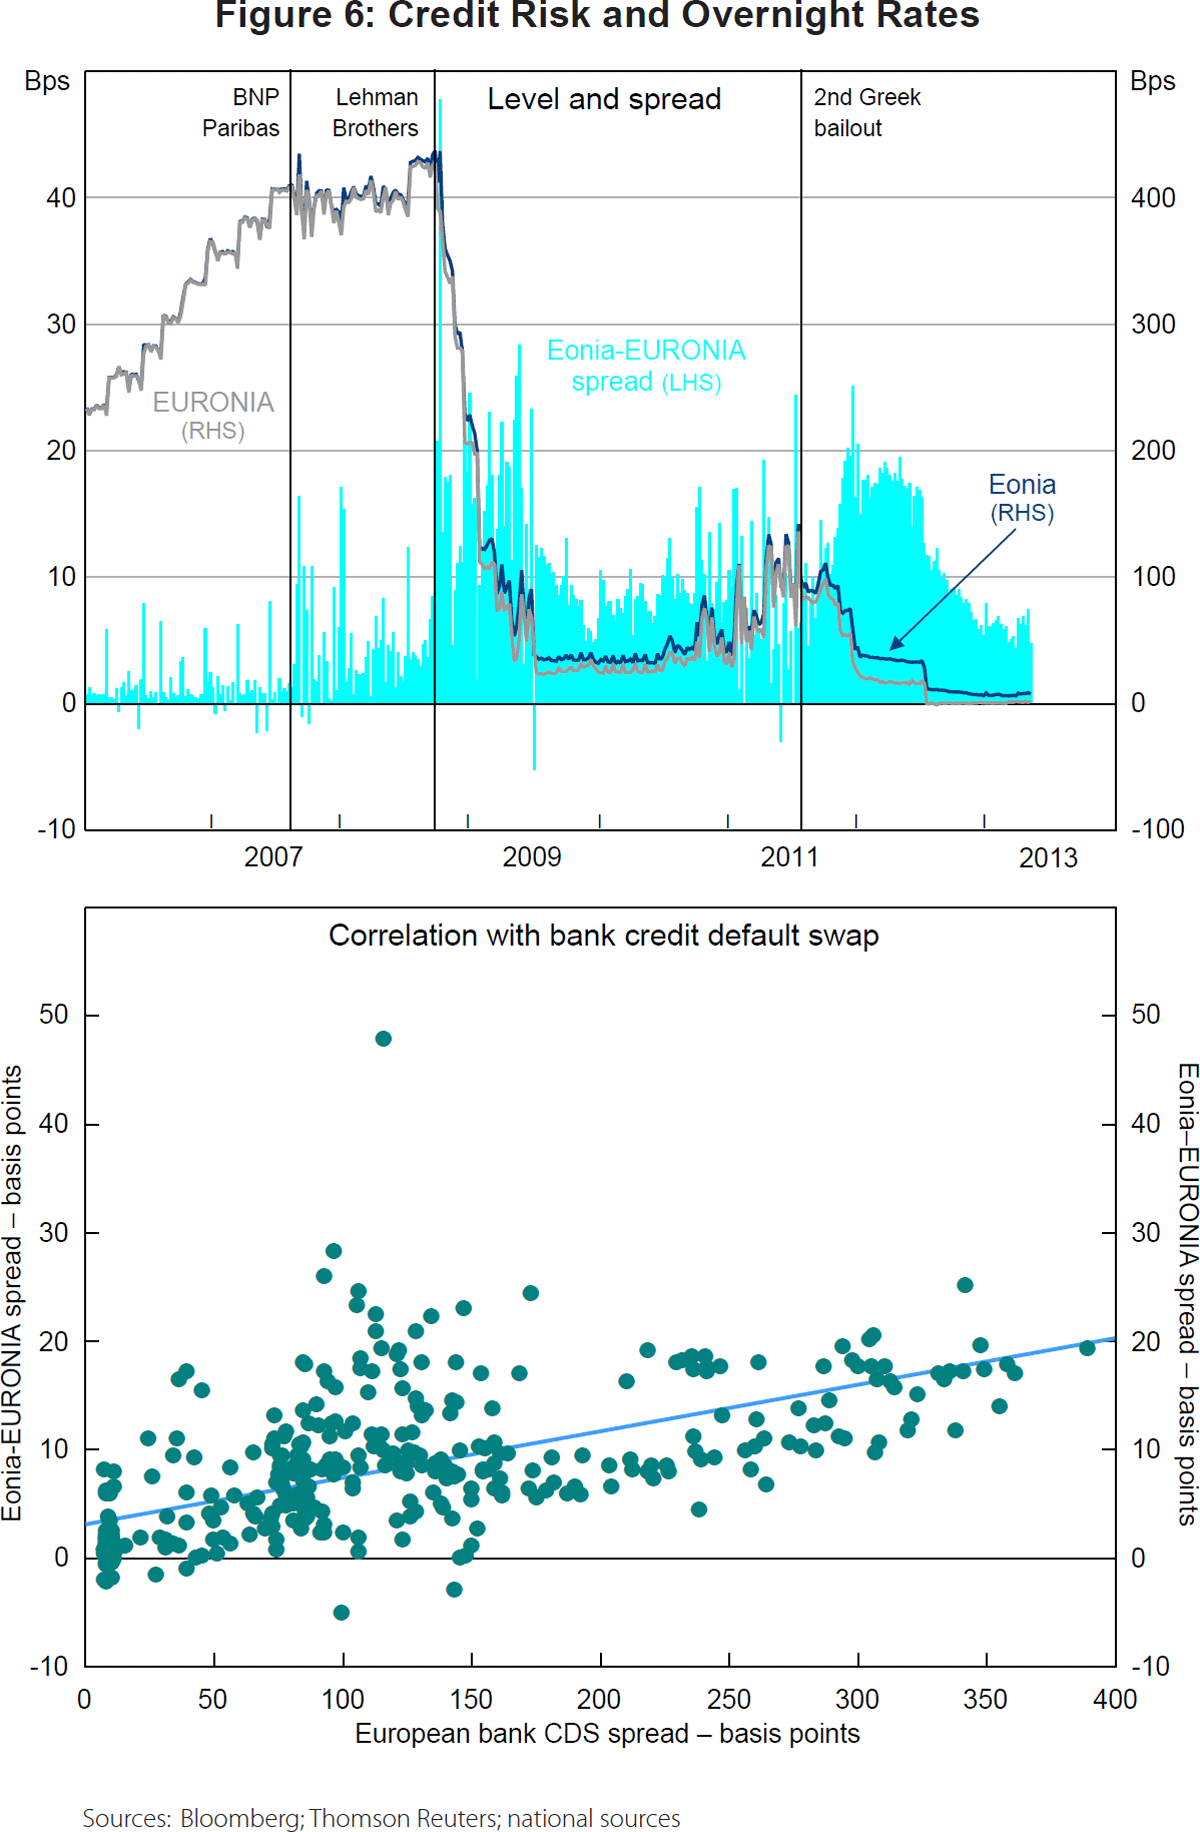
One example – used by market analysts – is the spread between the Eonia and EURONIA rates (see, for example, Marraffino and Fransolet (2012)). The Eonia rate is a weighted average of all overnight unsecured lending transactions in the interbank market, undertaken by a panel of banks in the European Union and European Free Trade Association countries. In contrast, the EURONIA rate is the weighted average of all unsecured euro overnight cash transactions brokered in London by contributing members of the Wholesale Markets Brokers' Association. The number of participants is smaller in the EURONIA market and they are generally regarded as having been – on average – of higher creditworthiness than the participants in the Eonia market. Consequently, the spread between the two rates is thought to reflect primarily differences in credit risk.
The top panel of Figure 6 plots the Eonia and the EURONIA rates as well as the spread between them since 2006. Prior to the financial crisis, the difference was, on average, a couple of basis points. However, the spread moved up in August 2007 and climbed further in the aftermath of the Lehman Brothers bankruptcy in September 2008. It has remained elevated ever since and has generally followed the ebbs and flows of the perceived health of the European banks. The bottom panel in Figure 6 illustrates this point. It shows a scatter plot of a credit default swap index for European banks and the spread between Eonia and EURONIA rates. There is a clear positive correlation.
3. Three Models of the Interbank Market
In this section, we review three models that all seek to explain essential elements of the overnight interbank market and monetary policy implementation. The first one is the standard model of monetary policy implementation in a corridor system, based on the seminal contribution of Poole (1968). Examples include Woodford (2001), Whitesell (2006) and Ennis and Keister (2008). The second model is the recent application of search theory to the interbank market in Afonso and Lagos (2012). The final contribution is the directed search model with credit risk presented in Bech and Monnet (2013). We recast the different models within a common framework to highlight both commonalities and differences and we compare the predictions of each model in light of the stylised facts presented above.
3.1 The basic set-up
All three models fit within the following basic set-up. There is a measure one of
risk-neutral banks, indexed by i, each of which aims to maximise expected profits by adjusting reserve
holdings, Ri. The banks enter the day with the same reserve
holdings Ri = R0 and are required to
hold
 ≥ 0 units of reserves at the end
of the
day[9]
We say that the banking system is
in a (structural) liquidity surplus if R0 >
 and in a (structural) liquidity deficit
if
R0 <
 . Liquidity conditions are
neutral or balanced if R0 =
 .
.
During the day the reserve positions of banks change as a result of payments executed
and received on behalf of customers. The interbank payment system operates
two sessions. The first session is for customer payments whereas the last session
is reserved for settlement of interbank overnight
loans.[10]
The net inflow of reserves in the first session is given by υi.
The value of υi
is independent across banks and is drawn from a common symmetric distribution F
defined over
 . Hence, once the interbank payment
system closes for customer payments the reserve position of bank i
is:

Thereafter, the interbank market opens. Here, banks trade overnight loans with each other to get closer to their desired end-of-day reserve position. Let Δi denote the (net) amount borrowed by bank i. If Δi < 0 then bank i is a (net) lender. The reserve position of bank i after the interbank market closes is:

If a bank is short of reserves at the close of business (Ri <
 ) then it borrows the shortfall from
the central bank
(against collateral), paying the penalty rate, rp.
On the other hand, if a bank is long (Ri >
 ) then it deposits the surplus with
the central bank, earning the rate, rd. Required reserves
are remunerated at the same rate. The time line in Figure 7 summarises the
basic set-up and the reserve position of bank i over the course of
the day.

As a benchmark for the analysis that follows, assume that the interbank market is perfectly competitive. That is, banks are price takers and they can trade any amount at the overnight rate, rΔ. In equilibrium, banks will equate the marginal benefit of an extra dollar of reserves with the marginal cost of obtaining the dollar via an overnight loan, rΔ.
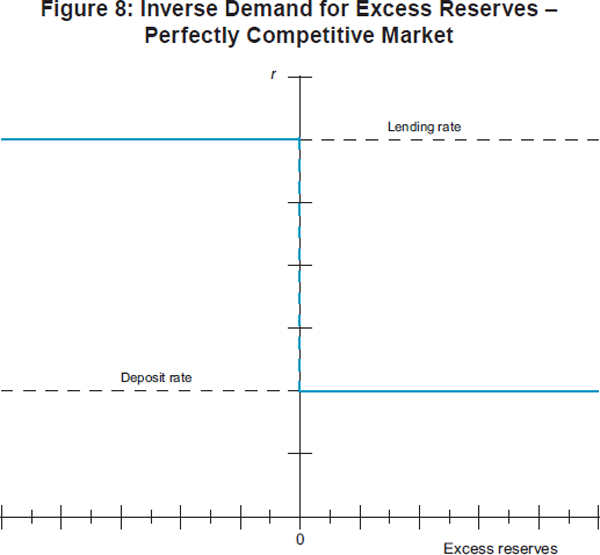
If there is a system liquidity deficit, then the overnight rate – in equilibrium – is equal to the central bank deposit rate (rd), whereas it is equal to the central bank lending rate (rp) if there is a system liquidity surplus (see Figure 8). If liquidity conditions are balanced, the overnight rate is indeterminate – any rate between rd and rp is consistent with equilibrium (see, for example, Clinton (1997) and Borio and Disyatat (2010)).
The three models we review here all start from the premise that the interbank market is imperfect. They differ, however, in terms of how they model the structure of the interbank market and the imperfections that prevent banks from perfectly targeting their end-of-day reserve balances.
The models in the tradition of Poole (1968) maintain the assumption that banks are price takers but deviate from perfect competition by introducing an aftermarket shock to reserve balances. Afonso and Lagos (2012) assume that the interbank market is an over-the-counter (OTC) market and that banks trade over multiple rounds with randomly selected counterparts. In Bech and Monnet (2013) the market structure is also OTC but banks use directed search to find counterparts in a way that resembles a brokered market. In addition, banks can default. We now describe the interbank market in each of the models.
3.2 Interbank market in Poole (1968)
In the Poole (1968) model, the interbank market is competitive. Banks are price takers
and can trade any amount,
 , at the interbank rate, rΔ,
which clears the market. However, in order to capture market imperfections,
the model introduces an additional shock to reserve holdings after trading
halts in the interbank market. That is, each bank receives an aftermarket shock,
εi ~ Gε, to its
reserve balance. This can, for example, be due to end-of-day settlements of
auxiliary payment and security settlement systems. Hence, the total impact
on the reserve holdings of a bank is
 . The key assumption in Poole's
model is that while banks can trade the early payment shock in the market,
they cannot trade based on their late shock or insure against it before it
hits. We summarise the Poole model via the time line in Figure 9.

Banks seek to maximise their profit and there is no credit risk. Bank i chooses
 so as to equate the marginal cost with
the expected marginal benefits, or:

In words, the value of an incremental increase in borrowing in the interbank market is the cost of paying back this loan, −rΔ. Also, the marginal value of a bank's account balance is the expected gain from having a positive account balance at the end of the day. If the late payment shock is not severe, the extra balance will be accounted for as excess reserves and will earn the interest rate rd. Finally, if the late payment shock is severe enough, the incremental balance is used instead of having recourse to the discount window. This saves the bank rd. We can rearrange Equation (3) to obtain the demand of bank i in the overnight market:

Given policy rates rd and rp, and aggregate balances R0,
an equilibrium is an overnight rate
rΔ such that  solves Equation (4)
for all i and the market clears, that is,
 . Therefore, the equilibrium overnight
rate satisfies:

That is,
 is a weighted average of the policy
rates rd and
rp, where the weights depend on the aggregate balances.
Therefore the interbank market rate is necessarily within the corridor defined
by rd and rp, and it responds one for
one with a shift in the corridor. Using the expression for the equilibrium
overnight rate,
 , we obtain the quantity traded by each
bank:

Hence, the aggregate volume is given by
 . We illustrate the model in the example
below.
3.2.1 Numerical example
Let rd=2%, rp=4%,
 =0, andεi~N(0,
σε) then Equation (3) becomes

where Φ is the cumulative standard normal distribution function. We plot Equation
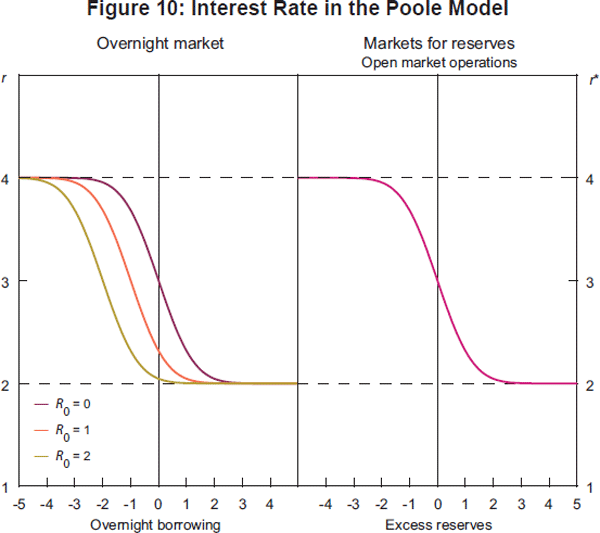
(7) in the left-hand panel of Figure 10 for three different levels of reserves
R0 = {0, 1, 2} and σε =
1. Intuitively, the inverse demand curve is decreasing and moves to the left
as the amount of reserves increases. Since the market has to clear, the equilibrium
interest rate is determined by setting
 = 0 for each possible value of R0
and finding the corresponding value of
 on the vertical axis. This relationship
can be written as

and is depicted in the right-hand panel of Figure 10.
If υi follows a normal distribution, then |υi| follows a half-normal distribution. Hence, the aggregate expected volume is given by:

3.2.2 The Poole model and the stylised facts
It is easy to see that the Poole model matches the first stylised fact that the overnight rate drops to the floor of the corridor as excess reserves rise. However, it does not match the stylised fact that market volume decreases as well. Aggregate market volume is only a function of the volatility of the early payment shock and hence does not depend on the amount of reserves in the banking system. Moreover, as the interbank market is perfectly competitive, all banks trade at the same rate and thus the model does not generate any dispersion of rates.[11] Finally, the Poole model does not account for counterparty risk.
3.3 Interbank market in Afonso and Lagos (2012)
Afonso and Lagos (2012) present a continuous time model to explain the intraday pattern of reserve holdings in the federal funds market. Among other things, Afonso and Lagos are interested in matching the stylised fact that the distribution of reserve holdings across banks tends to narrow through the day (see Ashcraft and Duffie (2007)). A fonso and Lagos introduce two novelties relative to the Poole model. First, banks trade in an OTC market and, second, banks bargain over terms when they trade. In the model, the OTC market consists of several rounds of random bilateral meetings and the negotiation process is Nash bargaining with equal bargaining power.
The Afonso and Lagos set-up is somewhat intricate; in part, this is to match certain institutional features specific to the federal funds market. Here, we abstract from some of these features and present a bare-bones version which focuses on predictions vis-à-vis the stylised facts presented above. We summarise our simplified version of the Afonso and Lagos (2012) model in the time line in Figure 11.

In contrast to the Poole model, the interbank market now consists of n bilateral trading rounds. Banks meet each other at random and they trade as follows. Bank i enters round h = {1,…, n} with balances of Ri,h−1. It is randomly matched with bank j that is holding balances of Rj,h−1. The bargaining process is such that banks choose the loan size to maximise the joint surplus from trade and they use the interest rate to split this surplus between them.[12] It turns out – as a result of this trading protocol – that banks equate their reserve holdings when they trade. That is, bank i trades

with bank j in round h. A positive value implies that bank i borrows from bank j and a negative value implies that bank i lends to bank j.
In Appendix B, we show that the reserve holdings of bank i at the end of a trading round h is its initial holdings (R0) plus the average of its own payment shock and those of all the banks that it has traded with, as well as all the banks that they have traded with, and so on up. We let s∈Sh denote this set of banks that bank i by round h has traded directly or indirectly with. We have:

Consequently, banks slowly trade away the payment shock that they received at the
start of the day. As payment shocks average to zero, the reserve holdings of
banks slowly converge back to R0 as h increases. The aggregate interbank market
volume (Q) is the sum of all trades over all trading rounds, that
is,  .
.
Determining the rates at which banks trade in a given round is complicated by the fact that a bank not only considers the value of reserves in terms of meeting its reserve requirement but also the option value of trading them in subsequent rounds. However, the probability of meeting a bank with a specific level of reserves evolves with each trading round as the distribution of reserves shifts according to Equation (9), so the willingness to trade at a specific rate changes as the terminal trading round gets closer. To highlight these dynamics, we turn to an example with two trading rounds.
3.3.1 Example with two rounds
We solve for the equilibrium rates using backward induction. In the last round, bank
i and bank j equate their reserve holdings by trading the
amount
 . Hence, the end-of-trading balance
is
 . The banks trade at the rates that
equate their surplus from trade. The surplus from trade for bank i
is

where II{·} is the indicator function which takes a value of one when the expression {·} is true and zero otherwise. The first two terms in Equation (12) are the pay-off from trading and the last term is the pay-off from not trading. The pay-off from trading is the value of bank i's excess reserve holdings (which can be negative) minus the costs or earnings from the overnight loan. Setting Si,2 = Sj,2 and solving for r2(Ri,1,Rj,1) yields:

If both banks fulfil their reserve requirement then they trade at the deposit rate, while if they are both short they trade at the central bank lending facility rate. Otherwise, they trade at a weighted average of the two standing facility rates where the weights reflect the respective reserve holdings relative to the reserve requirement.
Given the rates in the last round, we can now determine the pay-off in the last round for bank i if it meets bank j :

The first term in Equation (14) is the interest paid on required reserves. The second term is the interest on excess reserves and the last term is the interest on the amount that bank i borrows from or lends to bank j, as given by Equation (13).
Equipped with the pay-off in the last round, we can find the optimal behaviour of banks in the first round. The surplus from trade if bank i meets bank k in the first round is

where
 and G(Rj,1) is
the distribution of reserves across banks at the start of the second round
of trading in the interbank market. The first two terms in Equation (15) are
the expected pay-off from trading with bank k, while the latter is
the pay-off from not trading. Equating the surplus of bank i and bank
k (Si,1 = Sk,1) and solving
for r(Ri,0, Rk,0) yields

where we use the facts that: the pay-off in the last round in Equation (16) is the same for banks i and k because they enter the second round with the same amount of reserves (Ri,1 = Rk,1); and Δik,1 = − Δki,1. Substituting Equations (13) and (15) into Equation (16) and specifying a distribution for the payment shock yields an integral that can be solved – at least using numerical methods. We turn to this next in the following example.
3.3.2 Numerical example
Assume that υi follows a normal distribution. From Equation (8) we have that
 and from
Equation (9) we have that
 . Hence, by the formula for the half
normal distribution, the expected trade size is:

The expected volume is

which increases in the volatility of the payment shock, συ, and in the number of trading rounds, n. But as the average trade size falls in each round, volume converges as n grows large:

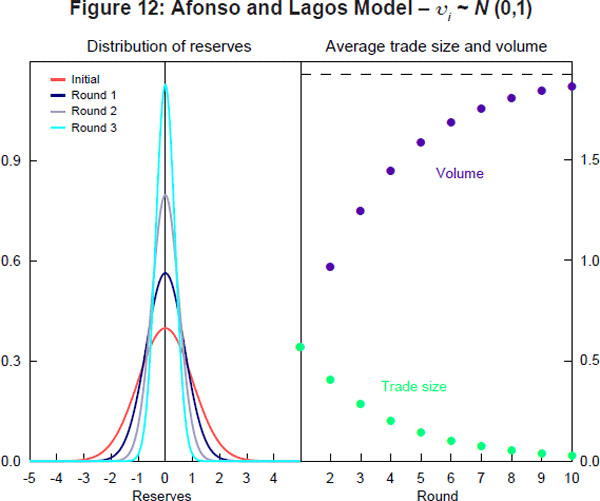
The left-hand panel of Figure 12 plots the initial distribution of reserves as well as distributions for the first three trading rounds assuming that R0 = 0 and standard normal payment shocks. The distribution of reserves narrows as more trading takes place. The right-hand panel of Figure 12 shows the average trade size and the market volume for the first 10 rounds of trading. Unsurprisingly, market volume increases with the number of rounds, but it converges to the limit given in Equation (19).
Unfortunately, there is no closed form solution for the rates at which banks trade in the first round in Equation (14) – even in this two trading round example. Hence, we simulate the model. As in the Poole example above, we set rd = 2% and rp = 4% and we assume that the payment shock is standard normal (see Appendix B). The results for 5,000 trades in each round are shown in Figure 13.
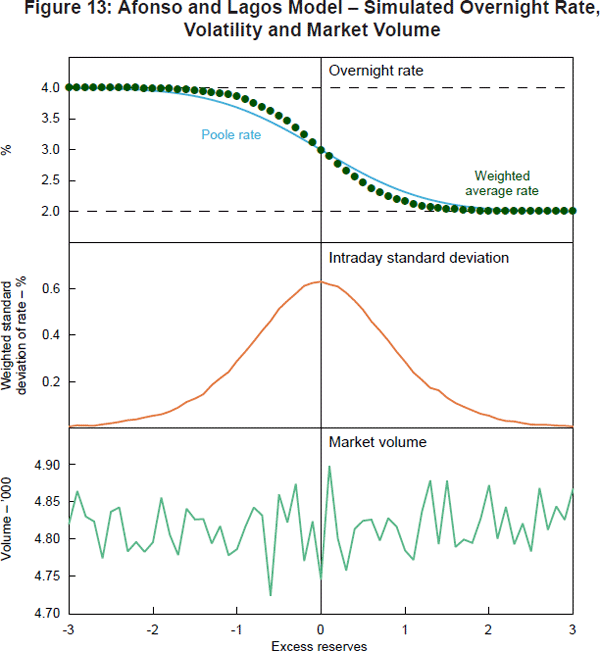
The top panel shows the overnight rate as a function of excess reserves. The weighted average rate has a similar shape to the overnight rate in the Poole model. The middle panel shows the dispersion of rates. The (weighted) standard deviation of rates has a bell curve shape centred on zero excess reserves, with volatility dropping to zero when there are large deficits or surpluses of excess reserves. The bottom panel shows the market volume as a function of excess reserves. Here, there is no discernible pattern. In fact, from the formula for the expected trade size in Equation (15), we would expect market volumes to fluctuate around

which is indeed the case.
3.3.3 The Afonso and Lagos model and the stylised facts
Like the Poole model, the Afonso and Lagos model fits the first stylised fact because the weighted average rate tends to the deposit rate as the supply of reserves increases. In addition, and in contrast to the Poole model, the Afonso and Lagos framework generates individual trades that occur at different rates. Hence, it is possible to compute the standard deviation of rates. Consistent with the second stylised fact, volatility is predicted to fall when there are a lot of excess reserves in the banking system. However, the Afonso and Lagos model does not match the third stylised fact that market volume decreases as well. As shown above, the aggregate market volume is a function of the volatility of the payment shock and the number of trading rounds but does not depend on the amount of excess reserves. Finally, Afonso and Lagos (2012) does not model default risk.
3.4 Interbank market in Bech and Monnet (2013)
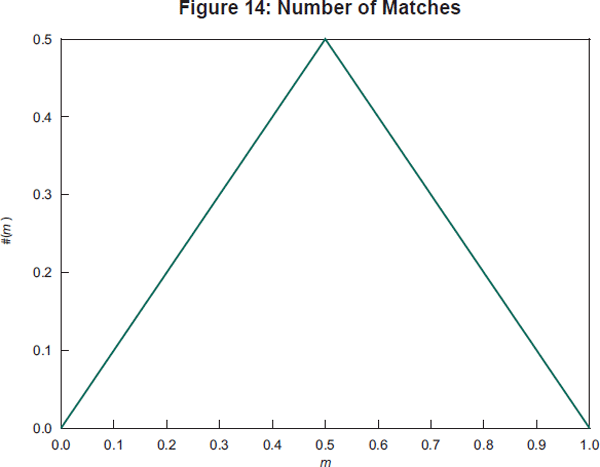
In Bech and Monnet (2013), the interbank market is modelled as a three-step process. In the first step, banks decide whether they wish to borrow or lend based on their stock of reserves. Let m denote the measure of borrowers and hence 1 – m is the measure of lenders. Once this ‘either a borrower or lender be’ decision is made, banks turn to a broker in the second step. The broker seeks to match the bank with another that wants to be on the other side of the trade. However, some banks will not be matched if there are more borrowers than lenders or vice versa.[13] The number (or measure) of matches is #(m) = min{m, 1 − m} as shown in Figure 14.
If a borrower is matched with a lender, the two banks, in step three, bargain over
the amount of reserves to be traded Δij and the price
 . Like Afonso and Lagos (2012), Nash
bargaining describes the outcome of the interbank negotiations and banks have
equal bargaining power. The time line below (Figure 15) summarises the
steps of the Bech and Monnet (2013) model.

The key to determining the equilibrium is the decision of each bank to become either
a borrower or a lender. Bech and Monnet (2013) show that a bank chooses to
become a lender in the interbank market if it has more reserves than required
(Ri >
 ) and chooses to become a borrower if
it has less than required (Ri <
 ). In equilibrium, banks equate their
reserve holdings when they trade

where, without loss of generality, we assume that Ri < Rj so that bank i is always the borrower (b) and bank j is always the lender (l). In Appendix C, we show that the equilibrium rate on the loan is given by:

3.4.1 Counterparty risk
Bech and Monnet (2013) also introduce the possibility of default into the decision process of banks to capture the fact that counterparty risk can play an important role even for overnight lending, as highlighted by the financial crisis. Assume that a bank default has an exogenous given probability of δ ∈ [0, 1). If a borrower defaults, the lender gets nothing, but if a lender defaults the borrower still has to pay in full the other creditors of the lender. It turns out that the decision of a bank to become a borrower or a lender is unchanged and the rates at which banks trade in equilibrium are given by

where Rb <
 < Ri and rδ
(Rb, Ri,
 ) is the loan rate without credit risk
in Equation (19). In words, the possibility of default introduces a risk premium
that reflects the potential principal loss and is proportional to the overnight
rate without credit risk. Importantly, when the probability of default is sufficiently
high, it is possible that the rate at which a lender is willing to lend is
larger than the rate the central bank charges for its lending facility. In
such circumstances banks will not trade and borrowers will turn to the central
bank instead. In fact, it is possible that the interbank market disappears.
Assuming that there is trade we can – as before – simulate the
model.
3.4.2 Numerical example
Again, we set rd = 2% and rp = 4% and assume that the payment shock is standard normal. Figure 16 shows the overnight rate, the standard deviation of rates and the market volume as a function of the amount of excess reserves for three different levels of the probability of default, δ ∈ {0%, 0.5%, 1%}. The figure is based on 200,000 draws for each level of excess reserves (see Appendix C for further details).
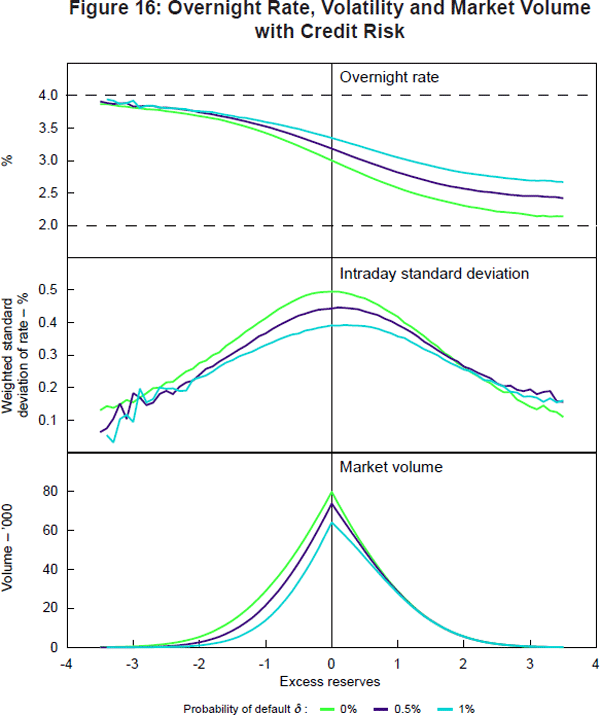
We begin with the case of no counterparty risk (the green line). The weighted average rate has a similar shape to the overnight rate in the Poole and Afonso and Lagos models. The middle panel shows the dispersion of rates. The weighted standard deviation of rates has a bell curve shape centred on zero excess reserves with volatility dropping towards zero in case of large deficits or surpluses of excess reserves. The bottom panel shows market volume as a function of excess reserves. Volume peaks when there are zero excess reserves in the system and it drops to zero when liquidity conditions become unbalanced in either direction.
Increasing counterparty risk (purple and blue lines) increases the average overnight rate for a given level of excess reserves. In other words, the effective width of the corridor narrows when uncertainty with respect to the reliability of counterparties rises. In contrast, volatility and market volume decrease with higher default risk unless excess reserves are plentiful.
3.4.3 The Bech and Monnet model and the stylised facts
Like the two other models, the Bech and Monnet model fits the first stylised fact well. Moreover, as with the Afonso and Lagos framework, it generates individual trades that occur at different rates and is consistent with the second stylised fact that volatility falls when there are a lot of excess reserves. Furthermore, the model also fits with the third stylised fact that market volume decreases as excess reserves increase. In addition, it models counterparty risk, showing that higher default risk pushes up the overnight rate. This is in line with the experience in Australia, as well as the comparison between the Eonia and EURONIA markets. Unlike the Afonso and Lagos model, however, it does not provide any predictions with respect to the intraday pattern of trading or reserve holdings. This requires multiple rounds of trading.
4. Conclusion
In this paper, we establish what we think are four stylised facts around the price and quantity dynamics of the overnight interbank market during a period of unconventional monetary policies. The stylised facts are that a substantial increase in the amount of excess reserves in the banking system: (1) drives the overnight rate to the floor of the corridor; (2) reduces the volatility of the overnight rate; and (3) decreases market volume. A fourth stylised fact is that counterparty risk pushes up the overnight rate. In light of these stylised facts, we review three models of the interbank market and monetary policy implementation and test whether the predictions of these models are consistent with the facts. The models are: the standard model of monetary policy implementation in a corridor system, based on the seminal contribution of Poole (1968); the recent application of search theory to the interbank market of Afonso and Lagos (2012); and the directed search model with counterparty risk in Bech and Monnet (2013). Table 1 summarises the results for these three models.
| Poole (1968) | Afonso and Lagos (2012) | Bech and Monnet (2013) | |
|---|---|---|---|
| A surge in excess reserves: | |||
| (1) drives the o/n rate to the floor of corridor | ✓ | ✓ | ✓ |
| (2) reduces the volatility of overnight rate | na | ✓ | ✓ |
| (3) decreases market volume | na | na | ✓ |
| Counterparty risk pushes up the o/n rate | na | na | ✓ |
In sum, the models can explain either a subset or all of the stylised facts. In other words, the observed dynamics in the overnight money market are in line with what we would expect as a consequence of the observed market stresses and unconventional policies. Taken at face value this suggests that while it is true that activity in the interbank market in certain jurisdictions has almost ceased (see, for example, Jeffrey (2012)) it may re-emerge once the unconventional policies and market stresses are reversed. If so, central banks will be able to resume their usual modus operandi. Unsurprisingly, a number of caveats apply to this assertion. First, as noted in BIS (2010, pp 42–43), prolonged periods of low policy rates and market volumes can erode key market structures and relationships that are not easily rebuilt. For example, the tightening of Japan's monetary policy in 2006 was complicated by the fact that the money market desks had been significantly reduced at commercial banks. Second, the assessment of counterparty risk within the banking system might have changed fundamentally, which could lead to turnover being permanently lower. Third, the new liquidity regulations that are part of Basel III might change the underlying economics of overnight loan transactions (see, for example, Bonner and Eijffinger (2012) and Bech and Keister (2013)).
Appendix A: Definition and Computation of Overnight Rates
This appendix provides details on the definition and computation of the overnight money market rates discussed in the main text. Unless otherwise noted, the information was collected from central bank and industry association websites.
Federal (fed) funds rate
A federal (fed) funds transaction is an unsecured loan of US dollars to a depository institution from a lender (or seller) that is a depository institution, foreign bank, government-sponsored enterprise or other eligible entity. Fed funds transactions are excluded from reservable liabilities. Participants can arrange fed funds transactions directly with each other (bilaterally), or through the brokers. Because there is no central repository of fed funds transactions, there is no central collection of the rates at which they occurred. However, for decades fed funds brokers have voluntarily submitted aggregated data on the fed funds transactions they have brokered to the Federal Reserve Bank of New York (FRBNY). The FRBNY uses these data to calculate the effective federal funds rate and related summary statistics. Various academic studies and discussions with market participants provide confidence that the effective federal funds rate is broadly representative of the entire universe of fed funds trades.
Eonia®
Eonia® (Euro Overnight Index Average) is the effective overnight reference rate for the euro. It is computed as a weighted average of all overnight unsecured lending transactions in the interbank market, undertaken in the European Union and European Free Trade Association countries. Eonia® is computed with the help of the European Central Bank. The banks contributing to Eonia® are the same banks as the Panel Banks quoting for Euribor®.
EURONIA
Introduced in January 1999, EURONIA is the Euro Overnight Index Average. This index tracks actual market overnight funding rates. EURONIA is the weighted average rate to four decimal places of all unsecured euro overnight cash transactions brokered in London by contributing Wholesale Markets Brokers' Association members between midnight and 16:00 with all counterparties and no minimum deal size. The index is the weighted average overnight deposit rate for each business day. Each rate in the average is weighted by the principal amount of deposits that were taken on that day.
SONIA
Introduced in March 1997, SONIA is the Sterling Overnight Index Average. The index tracks actual market overnight funding rates. SONIA is the weighted average rate to four decimal places of all unsecured sterling overnight cash transactions brokered in London by contributing Wholesale Markets Brokers' Association members between midnight and 16:15 with all counterparties and a minimum deal size of £25 million. The SONIA is published by 17:00 on the day of calculation. The index is a weighted average overnight deposit rate for each business day. Each rate in the average is weighted by the principal amount of deposits that were taken on that day.
Call rate (Japan)
The uncollateralised call rate is the interest rate for uncollateralised transactions in the call market, where financial institutions lend and borrow short-term funds. The rate at which funds are received and paid on a contract day, and at which reverse transactions are conducted on the business day following the contract day, are included in the uncollateralised overnight call rate.
Overnight money market financing rate (Canada)
The overnight money market financing rate is an estimate compiled at the end of the day by the Bank of Canada through a survey of major participants in the overnight market (Reid 2007). This estimate comprises the weighted average repo funding cost of major money market dealers, including special purchase and resale agreements (SPRAs)[14] with the Bank of Canada and trades that are conducted directly between dealers. It provides a somewhat broader measure than the Canadian Overnight Repo Rate Average (CORRA).[15]
Cash rate (Australia)
The Reserve Bank of Australia collects data on the amount and weighted average rate at which banks transact in the domestic interbank market for overnight unsecured funds. These data are used to calculate the Bank's measure of the Interbank Overnight Cash Rate (IBOC), which is the Reserve Bank Board's operational target for monetary policy. This measure is published each day that the Reserve Bank Information and Transfer System (RITS) is open for interbank settlement. All banks that settle payments across their own Exchange Settlement account participate in the survey (around 50 in number).
Appendix B: The Afonso and Lagos (2012) Model
In this appendix, we derive the equations describing the evolution of reserve balances in Afonso and Lagos (2012) and provide details on our simulation exercise.
Evolution of reserve balances
From Section 3, we have that the reserve holdings of bank i at the beginning on the interbank market are:

From Equation (8) we have that at the end of the first round, bank i's reserve holdings are:

At the end of the second round they are:

At the end of the third round they are:

Hence, by induction we have Equation (11).
Simulation
In the simulation of the two round example of the Afonso and Lagos (2012) model,
we set r d = 2% and
r p = 4% and we assume that the payment shock
is standard normal. We vary the initial level of reserves from −3 to
3 in steps of 0.1. In the first round, we draw 10,000 payment shocks and
randomly match banks into 5,000 trades. For each triple of R0,
υi
and υk, we compute Δik,1
and r1(Ri,0,
Rk,0). The latter is determined by computing
the integral in Equation (16) using the fact that
 . For the second round we draw 10,000
shocks from
 to mirror the average of two payment
shocks. We compute Δij,2 and r2(Ri,1,
Rj,1).
The latter comes directly from Equation (13). For each initial level of reserves R0 ∈ {−3, −2.9,…, 2.9, 3}, we then compute the market volume, weighted average overnight rate and weighted standard deviation based on the 10,000 trades conducted over the two rounds.
Appendix C: The Bech and Monnet (2013) Model
In this appendix, we derive the equilibrium overnight interest rate in the case of no credit risk.
Equilibrium rate
There are two potential cases: first that
 ,
and second that
 . In the first case we have by Equation
(21) that
 and hence the surplus of the borrower from trading (compared with no trade) is:

Similarly the surplus of the lender is:

Equating
 and
and
 yields
 , which implies that:

In the latter case, the borrower surplus is:

The lender surplus is:

Equating
 and
and
 yields
 which implies that

the same as in the first case.
Simulation
Figure C1 shows histograms of trade sizes from two simulation runs of our model without credit risk. In the left-hand panel, the amount of excess reserves is zero whereas excess reserves are positive in the right-hand panel.
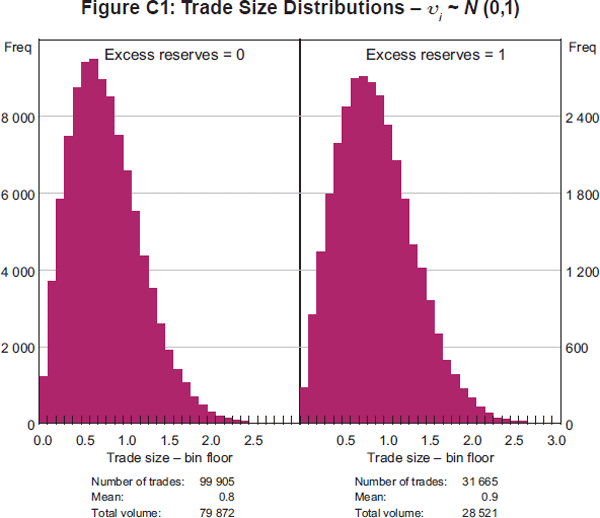
With zero excess reserves, half of the banks are borrowers and the other half are lenders on average. Consequently, the broker is expected to match 100,000 trades. In the actual simulations, the number of matches was 99,905, as reported in the tables below the individual histogram in Figure C1. In contrast, with positive excess reserves, there are more lenders than borrowers and the broker obviously finds fewer matches. With excess reserves of one, there are

lenders for every borrower and the expected number of matches is 31,731. The actual number in the simulation reported here was 31,665.
Footnotes
The views expressed in this paper are those of the authors and do not necessarily reflect those of the Bank for International Settlements. [*]
Attempts at taxonomies are available in Borio and Disyatat (2010) and Stone, Fujita and Ishi (2011). [1]
Since the end of 2007, central bank total assets have doubled to more than US$20 trillion, or just over 30 per cent of global GDP. [2]
The Swedish central bank has already exited from the unconventional policy measures it implemented in response to the financial crisis. [3]
See also discussions in Cœuré (2013a, 2013b). [4]
More information on the details of the different rates and markets are available in Appendix A. [5]
The Federal Reserve began to pay interest on depository institutions' required and excess reserve balances on 9 October 2008. The Bank of Japan began to pay interest on current account balances and special reserve account balances on 16 November 2008. [6]
Berentsen and Monnet (2008) present a general equilibrium model of a corridor (or channel) system. [7]
The data for the federal funds market are from Kreicher, McCauley and McGuire (2013) and the data for the Australian market were provided by the Reserve Bank of Australia. [8]
We ignore maintenance period dynamics for simplicity. [9]
For example, TARGET2 – the Eurosystem real-time gross settlement (RTGS) system for payments in euros – closes for customer payment at 17:00 whereas interbank transfers can occur until 18:00. In the United States, the Federal Reserve's RTGS Fedwire closes for customer payments at 18:00 (Eastern Standard Time) and 18:30 for so-called Settlement Payment Orders. [10]
One way to produce time variation in the overnight rate is to introduce uncertainty with regard to the supply of reserves. In our context, let R0 = Rcb + u where Rcb is the level of reserves supplied by the central bank, and u is the central bank's forecast error due to autonomous factors. [11]
The interest rate is set so that both banks equate their surplus from trade. [12]
The broker is not able to match banks according to their relative reserve positions. [13]
SPRAs and SRAs are repo-type and reverse repo-type transactions, respectively, in which the Bank of Canada offers to purchase (sell) Government of Canada securities from designated counterparties with an agreement to sell (buy) them back at a predetermined price on the next business day. [14]
The CORRA consists of a weighted average of rates on repo transactions conducted onscreen between 06:00 and 16:00 that are subsequently reported by interdealer brokers. The CORRA is limited to repo transactions that involve general collateral (GC). [15]
References
Afonso G and R Lagos (2012), ‘Trade Dynamics in the Market for Federal Funds’, Federal Reserve Bank of New York Staff Report No 549.
Angelini P, A Nobili and C Picillo (2011), ‘The Interbank Market after August 2007: What Has Changed, and Why?’, Journal of Money, Credit and Banking, 43(5), pp 923–958.
Ashcraft AB and D Duffie (2007), ‘Systemic Illiquidity in the Federal Funds Market’, The American Economic Review, 97(2), pp 221–225.
Bech ML and T Keister (2013), ‘Liquidity Regulation and the Implementation of Monetary Policy’, BIS Working Papers No 432.
Bech ML and E Klee (2011), ‘The Mechanics of a Graceful Exit: Interest on Reserves and Segmentation in the Federal Funds Market’, Journal of Monetary Economics, 58(5), pp 415–431.
Bech ML and C Monnet (2013), ‘Interbank Money Market and Unconventional Monetary Policy’, unpublished manuscript, Bank for International Settlements.
Berentsen A and C Monnet (2008), ‘Monetary Policy in a Channel System’, Journal of Monetary Economics, 55(6), pp 1067–1080.
Bindseil U (2004), Monetary Policy Implementation: Theory, Past, and Present, Oxford University Press, Oxford.
BIS (Bank for International Settlements) (2010), 80th Annual Report, Bank for International Settlements, Basel.
Bonner C and CW Eijffinger (2012), ‘The Impact of the LCR on Interbank Money Markets’, Centre for Economic Policy Research Discussion Papers Series No 9124.
Borio C and P Disyatat (2010), ‘Unconventional Monetary Policies: An Appraisal’, The Manchester School, 78(s1), pp 53–89.
Christensen HE, JA Lopez and GD Rudebusch (2009), ‘Do Central Bank Liquidity Facilities Affect Interbank Lending Rates?’, Federal Reserve Bank of San Francisco Working Paper No 2009-13.
Clinton K (1997), ‘Implementation of Monetary Policy in a Regime with Zero Reserve Requirements’, Bank of Canada Working Paper 97-8.
Cœuré B (2013a), ‘Ensuring the Smooth Functioning of Money Markets’, Keynote speech at Clearstream's 17th Global Securities Financing Summit, Luxembourg, 16–17 January.
Cœuré B (2013b), ‘Where to Exit To? Monetary Policy Implementation After the Crisis’, Speech at International Center for Monetary and Banking Studies ICMB/CEPR 15th Geneva Conference on the World Economy ‘Exit Strategies: Time to Think About Them’, Geneva, 3 May.
Debelle G (2008), ‘Market Operations in the Past Year’, Speech at the 2008 Finance & Treasury Association Congress, Melbourne, 31 October.
Ennis HM and T Keister (2008), ‘Understanding Monetary Policy Implementation’, Federal Reserve Bank of Richmond Economic Quarterly, 94(3), pp 235–263.
FOMC (Federal Open Markets Committee) (2013), ‘Minutes of the Federal Open Market Committee, April 30–May 1, 2013’, Board of Governors of the Federal Reserve System, Washington DC. Available at <http://www.federalreserve.gov/monetarypolicy/fomcminutes20130501.htm>.
Heider F, M Hoerova and C Holthausen (2009), ‘Liquidity Hoarding and Interbank Market Spreads: The Role of Counterparty Risk’, ECB Working Paper No 1126.
Jeffery C (2012), ‘Interbank Market “Almost Dead” in Europe, Says Banque de France's Mongars’, Central Banking.com, 29 March. Available at <www.centralbanking.com/central-banking/news/2164700/interbank-market-almost-dead-europe-banque-france-s-mongars>.
Kreicher L, R McCauley and P McGuire (2013), ‘The 2011 FDIC Assessment on Banks’ Managed Liabilities: Interest Rate and Balance-Sheet Responses', BIS Working Papers No 413.
McAndrews J, A Sakar and Z Wang (2008), ‘The Effect of the Term Auction Facility on the London Inter-Bank Offered Rate’, Federal Reserve Bank of New York Staff Report No 335.
Maraffino G and L Fransolet (2012), ‘ECB: To Exit or Not?’, Barclays Euro Money Market Weekly, 2 April, pp 1–4.
Michaud F-L and C Upper (2008), ‘What Drives Interbank Rates? Evidence from the Libor Panel’, BIS Quarterly Review, March, pp 47–58.
Poole W (1968), ‘Commercial Bank Reserve Management in a Stochastic Model: Implications for Monetary Policy’, The Journal of Finance, 23(5), pp 769–791.
Reid C (2007), ‘The Canadian Overnight Market: Recent Evolution and Structural Changes’, Bank of Canada Review, Spring, pp 15–29.
Schwarz K (2010), ‘Mind the Gap: Disentangling Credit and Liquidity in Risk Spreads’. Available at <SSRN:http://ssrn.com/abstract=1486240>.
Stark J (2011), ‘Welcome Address’, Address at the ECB Workshop ‘The Post-Crisis Design of the Operational Framework for the Implementation of Monetary Policy’, Frankfurt, 10–11 October. Available at <http://www.ecb.europa.eu/events/conferences/shared/pdf/pocrides_opfram/stark.pdf?98ccdfd9632e09d524 d9d9d9969b30ea>.
Stone M, K Fujita and K Ishi (2011), ‘Should Unconventional Balance Sheet Policies be Added to the Central Bank Toolkit? A Review of the Experience So Far’, IMF Working Paper No WP11/145.
Taylor JB and JC Williams (2008), ‘Further Results on a Black Swan in the Money Market’, SIEPR Discussion Paper 07-046.
Taylor JB and JC Williams (2009), ‘A Black Swan in the Money Market’, American Economic Journal: Macroeconomics, 1(1), pp 58–83.
Whitesell W (2006), ‘Interest Rate Corridors and Reserves’, Journal of Monetary Economics, 53(6), pp 1177–1195.
Woodford M (2001), ‘Monetary Policy in the Information Economy’, Paper presented at the Federal Reserve Bank of Kansas City Economic Symposium ‘Economic Policy for the Information Economy’, Jackson Hole, 30 August–1 September.
Zhang N (2012), ‘Estimating the Demand for Settlement Balances in the Canadian Large Value Transfer System’, Bank of Canada Working Paper 2012-15.