RDP 8711: Deviations from Purchasing Power Parity: The Australian Case 2. Deviations from PPP in Australia
September 1987
- Download the Paper 633KB
The purpose of this section is to examine the historical behaviour of the real exchange rate against the U.S. dollar and in trade-weighted terms, from March 1970 to March 1987. This covers the period during which the Sretton Hoods System was abandoned and most countries moved to floating exchange rates. During this period, two basic regimes can be identified for Australia:
- managed exchange rates from 1970 Q1 to 1983 Q4[2]; and
- floating exchange rates from 1984 Q1 to 1987 Q1.
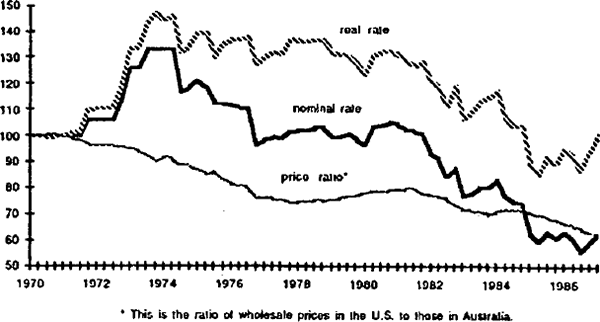
Charts 1 and 2 show Australia's real exchange rate against the U.S. dollar and against a trade-weighted basket of currencies. The real exchange rate is the series compiled by Morgan Guaranty. It consists of the nominal exchange rate adjusted for relative movements of the wholesale manufacturing price index between Australia and the foreign country or countries. Each measure is broken down into its component parts, the nominal exchange rate and the ratio of the two price indices. Table 1 shows the mean and variance of the real exchange rate, the relative price level and the nominal exchange rate.
These charts have a number of interesting features.
First, there is a trend decline in the ratio of world prices to domestic prices reflecting Australia's generally higher inflation rate over most of the period. There is a corresponding trend decline in Australia's nominal exchange rate. But the main source of short-term variation in the real exchange rate derives from movements of the nominal exchange rate, over both the managed and floating rate periods. In both periods, the variance of the real exchange rate and the nominal exchange rate exceeds that for relative price levels.
Second, as one would expect, the variance of the nominal exchange rates is higher in the floating rate period compared to the managed exchange rate era. Given the relative stability of price levels, this also implies that the real exchange rate has been more variable under floating rates.
Third, while the general statistical description applies both to the bilateral and effective exchange rate concepts, an important difference between them emerged mainly during the managed exchange rate period. From about 1980 to the end of 1983, Australia's real exchange rate vis-a-vis the trade-weighted basket rose quite sharply, before declining again in the floating exchange rate period. This pattern is not evident for the real exchange rate vis-a-vis the U.S. dollar. This implies that there were substantial increases in the real exchange rate vis-a-vis major trading partners other than the United States – notably Japan and countries of the EEC.
| 1970(2)–1983(4) | 1984(1)–1987(1) | |
|---|---|---|
| Trade-weighted exchange rate | ||
| Nominal rate: mean variance |
−0.004 0.0010 |
−0.038 0.0046 |
| Real rate: mean variance |
0.001 0.0008 |
−0.021 0.0048 |
| Price ratio: mean variance |
−0.004 0.0002 |
−0.017 0.0002 |
| US$/$A exchange rate | ||
| Nominal rate: mean variance |
−0.004 0.0018 |
−0.017 0.0047 |
| Real rate: mean variance |
0.003 0.0017 |
−0.010 0.0050 |
| Price ratio: mean variance |
−0.007 0.0002 |
−0.009 0.0001 |
|
Note: Mean and variance are calculated for the quarterly percentage rate of change for each variable. |
||


Footnote
To 1974 Q3 the $A was fixed, but periodically adjusted, against the U.S. dollar; from 1974 Q4 to 1976 Q3, the $A was fixed, but periodically adjusted, against a trade-weighted basket of currencies; and from 1976 Q4 to 1983 Q4 the $A was a crawling peg against the U.S. dollar. [2]