RDP 2025-01: Are Investment Tax Breaks Effective? Australian Evidence Appendix D: Additional RDD Figures

Figure D1: Log Residual Investment and Revenue
December quarter 2009
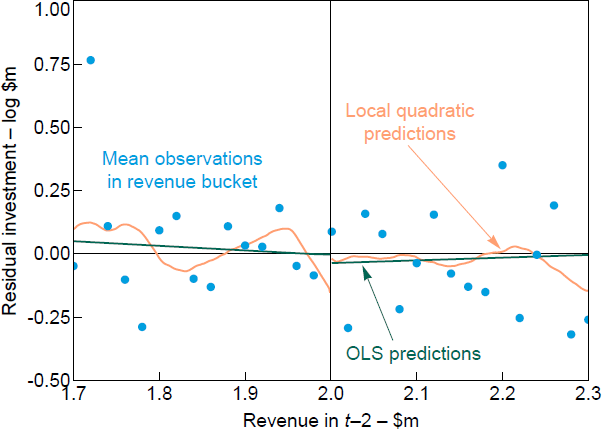
Figure D1: Log Residual Investment and Revenue - scatter plot showing investment for firms either side of the $2 million revenue threshold in December quarter 2009. It shows dots for average investment with sales bucket groups, and linear and local quadratic lines of best fit. Investment tends to be similar above and below the revenue threshold.

Note: Residual from a regression of log investment on industry fixed effects.

Figure D2: Log Residual Investment and Revenue
December quarter 2011
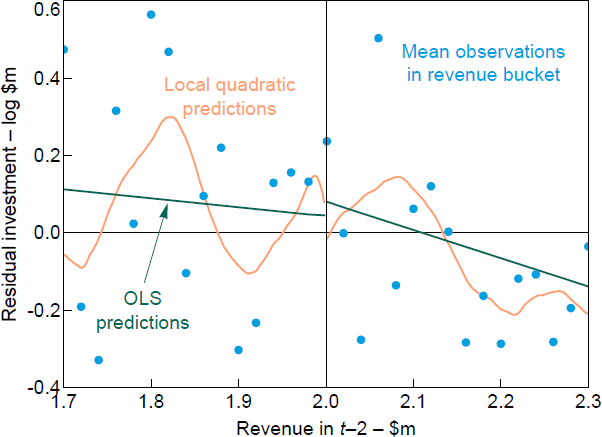
Figure D2: Log Residual Investment and Revenue - scatter plot showing investment for firms either side of the $2 million revenue threshold in December quarter 2011. It shows dots for average investment with sales bucket groups, and linear and local quadratic lines of best fit. Investment tends to be similar just below and above the revenue threshold.

Note: Residual from a regression of log investment on industry fixed effects.

Figure D3: Log Residual Investment and Revenue
June quarter 2016
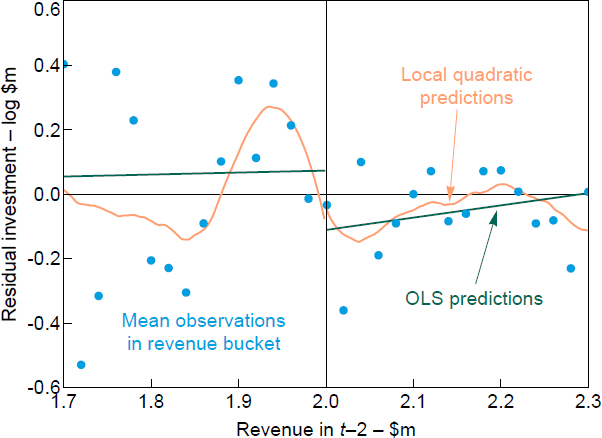
Figure D3: Log Residual Investment and Revenue - scatter plot showing investment for firms either side of the $2 million revenue threshold in June quarter 2016. It shows dots for average investment with sales bucket groups, and linear and local quadratic lines of best fit. Investment tends to be slightly higher just below the revenue threshold.

Note: Residual from a regression of log investment on industry fixed effects.

Figure D4: RDD Treatment Effect
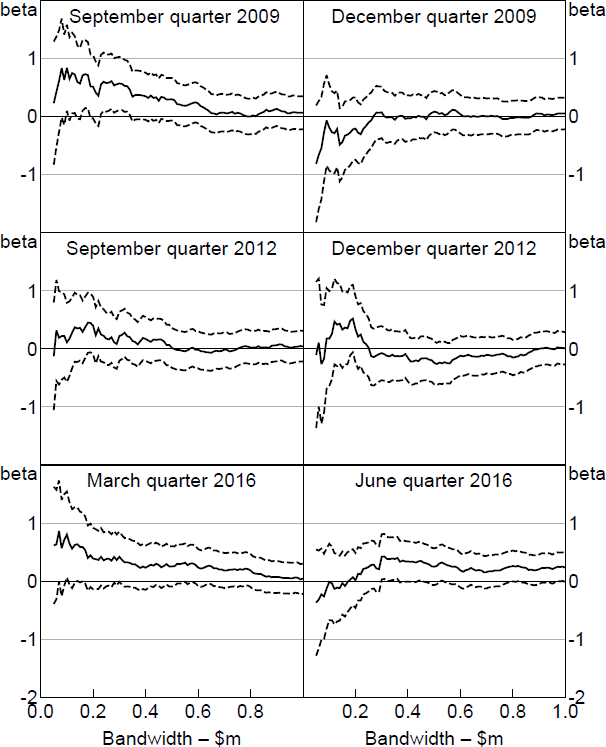
Figure D4: RDD Treatment Effect - six panel chart showing estimated RDD coefficients for the September and December quarters of 2009, September and December quarters of 2012, and the March and June quarters of 2016, over a broad range of potential bandwidths. Solid lines show estimates, dashed lines the 95 per cent confidence intervals. The charts show that the September quarter coefficient is significant for a reasonable range of bandwidths. Other periods are not.

Notes: No covariates, estimated with quadratic. Dashed lines are 95 per cent confidence intervals.