Statement on Monetary Policy – November 2018 3. Domestic Financial Conditions
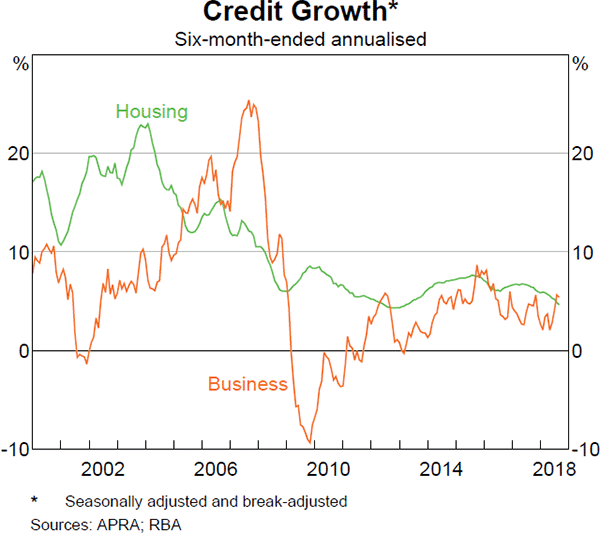
Domestic financial conditions remain accommodative for households and businesses. Financial market prices suggest that the cash rate is expected to remain unchanged over the year ahead. Money market interest rates have been a little higher this year than over 2017 and this has resulted in a small increase in funding costs for banks. Banks have responded by passing on a small increase in interest rates to business and housing loans. Nevertheless, borrowing rates remain low by historical standards. Growth in housing credit has eased, most notably for credit extended to investors. While housing credit conditions are tighter than they have been for some time, growth in the demand for credit has also slowed. Indeed, the average rate on housing loans has declined over much of the past year or so, suggesting that lenders have been competing vigorously for new borrowers who are low risk. Growth in business credit has picked up and is currently above that of housing credit. The notable fall in Australian equity prices recently was in line with developments in global equities markets. The Australian dollar remains within its fairly narrow range of the past couple of years.
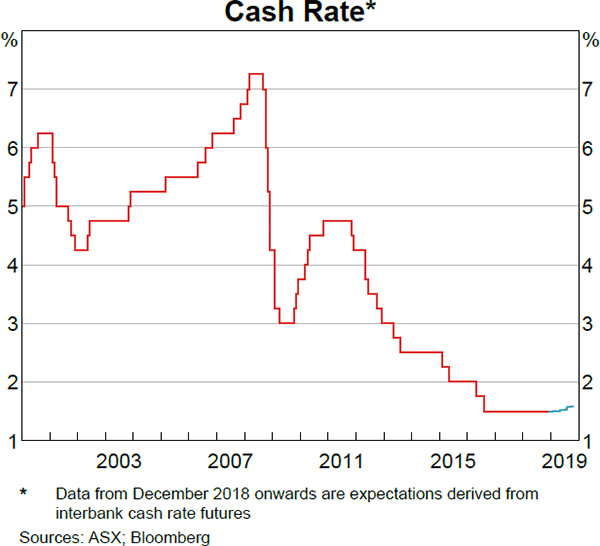
Investors expect the cash rate to remain unchanged over the year ahead
The Reserve Bank has maintained the cash rate target at 1.5 per cent since August 2016. Financial market prices imply that the cash rate is expected to remain unchanged in 2018 and 2019, and increase to 1.75 per cent in 2020 (Graph 3.1).
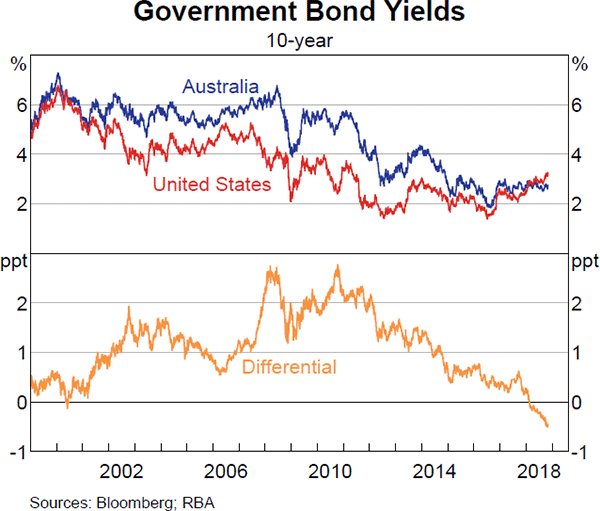
Government bond yields have been little changed
Yields on 10-year Australian Government Securities (AGS) have increased slightly over recent months to be around 2.7 per cent. With US Treasury yields moving higher over this period, the difference between US Treasury and AGS yields has widened further, and is now around 50 basis points (Graph 3.2). In September, Standard and Poor's changed the outlook for Australia's AAA sovereign credit rating from negative to stable in response to the narrowing of the budget deficit. Issuance from the Australian Government and state borrowing authorities has continued to be met by strong demand from the markets. The pace of net issuance by the Australian Government is expected to decline over 2018/19, reflecting the narrowing in the forecast budget deficit. The stock of bonds issued by the state borrowing authorities is expected to be little changed over 2018/19.
Short-term money market rates remain higher than in 2017
Money market rates remain higher than in 2017 despite little change in market expectations for the future path of the cash rate. Spreads on 3-month bank bills relative to overnight indexed swaps (OIS) remained around 20 basis points higher than their average over 2017 (Graph 3.3). In contrast, US dollar money market rates have increased recently. The cost of raising US dollar funding and then converting these funds into Australian dollars in the foreign exchange (FX) swap market has also remained higher than a year earlier. Bank bill and FX swap markets have been less volatile in recent months than they were in the first half of the year. However, repurchase agreement (repo) rates rose sharply at the end of the September quarter before easing subsequently, repeating a pattern seen at the ends of the previous three quarters. In contrast to other money markets, conditions in the overnight interbank markets have remained stable and the cash rate has continued to trade at the Reserve Bank Board's target.
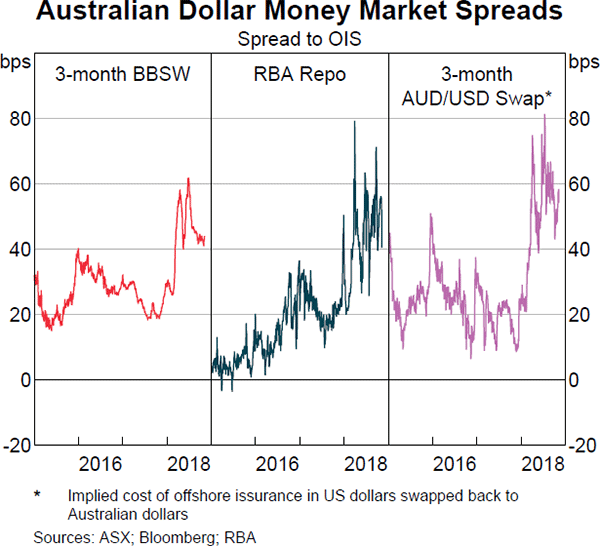
The higher spreads and increased volatility in money markets this year appear to be, at least in part, related to some structural developments in these markets. Banks have become more reluctant to supply liquidity in money markets. This is likely to be partly the consequence of changes in banking regulation following the global financial crisis, along with the greater focus on bank conduct in money markets and changes in the risk appetite of banks. Also, demand to borrow Australian dollars in money markets remains strong.
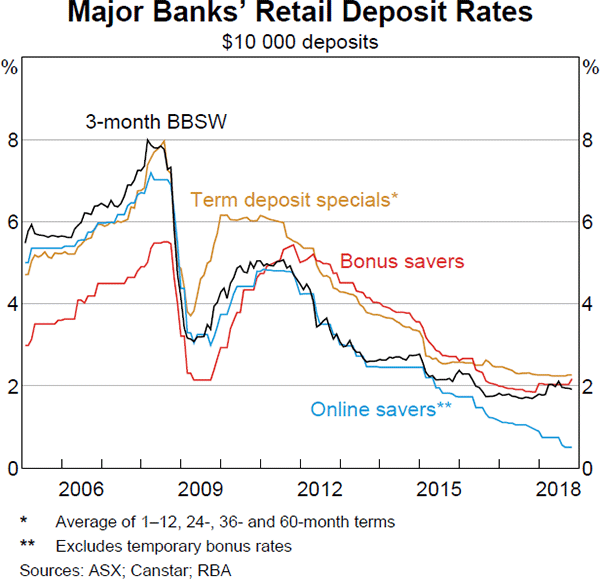
Banks' funding costs are a little higher than in 2017 but remain low
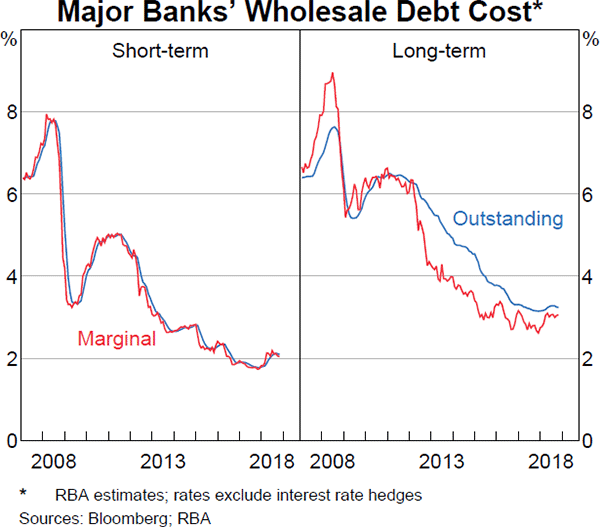
While banks' funding costs are a little higher than they were in 2017, funding costs remain low by historical standards. Banks' funding costs have increased by significantly less than money market rates. This is partly because interest rates on retail deposits – which account for around a third of banks' funding (excluding equity) – have declined since the start of the year. This largely reflects a decline in the interest rates on online saver accounts at the major banks (Graph 3.4).
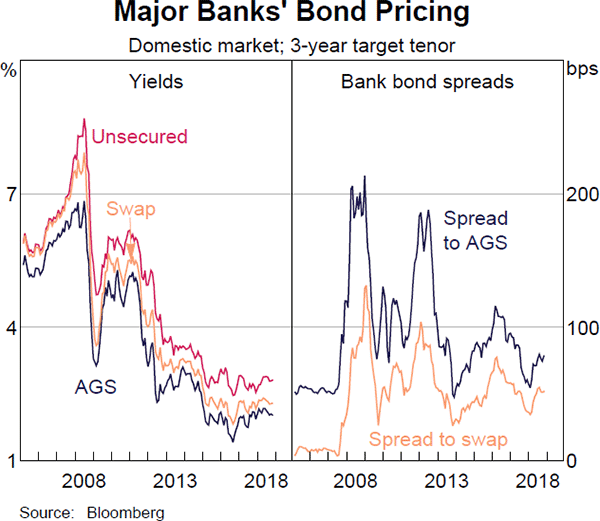
The increase in money market rates earlier this year exerted upward pressure on the cost of banks' wholesale funding, which accounts for around two-thirds of their funding. Australian banks ultimately pay rates that are linked to Bank Bill Swap (BBSW) rates on most of their wholesale debt. In particular, in addition to issuing variable rate Australian-dollar denominated debt, banks swap much of their fixed-rate or foreign-currency denominated debt into Australian-dollar floating-rate exposures by using derivatives. This aligns the nature of the rates for their funding with those of their assets, which consist largely of variable interest rate loans (denominated in Australian dollars). Despite the increase in money market rates earlier in the year, the cost of short-term and long-term wholesale debt for banks generally remains at a low level (Graph 3.5). Rates on wholesale deposits (for example, deposits from large corporations, pension funds and the government) also tend to be closely linked to BBSW rates, so the cost of these deposits has risen a little since 2017. Spreads to benchmark rates for the major banks' bonds are also a bit higher than a year ago (Graph 3.6).
The increase in BBSW rates also directly affected interest rates on some bank assets, such as large business lending rates and yields on banks' liquid asset holdings that reference BBSW rates. This has dampened the impact that higher funding costs have had on banks' net interest margins (NIM).[1] Banks have also decided to pass the funding cost increase on to other borrowers. In particular, most banks have increased their standard variable rates (SVRs) on housing loans in recent months (discussed further below).
Banks and non-bank lenders have maintained good access to wholesale funding markets
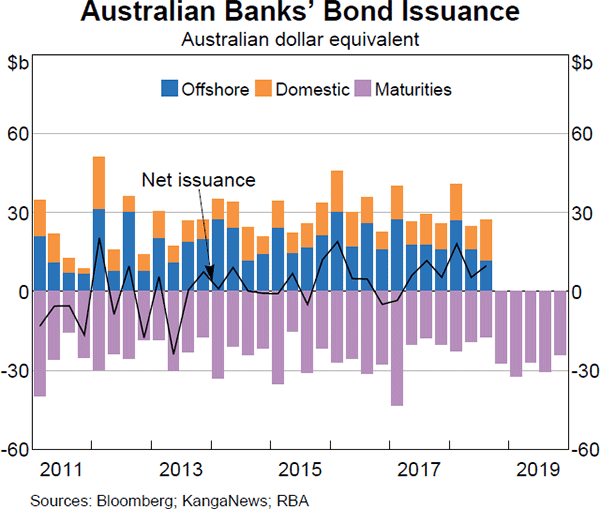
Australian banks have issued bonds at a similar pace to previous years, with around $95 billion raised in the first three quarters of 2018. Net issuance, which takes account of bond maturities, has been well above average over the same period given the relatively limited volume of bonds maturing (Graph 3.7). While most of the banks' long-term wholesale funding has typically been raised in offshore markets, the September quarter was an exception, with a higher proportion of domestic issuance.
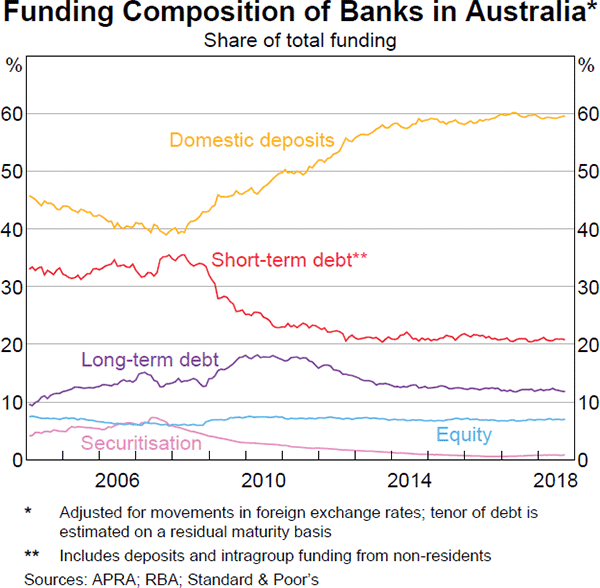
Overall, the composition of banks' funding has been little changed since the beginning of the year and growth in banks' balance sheets remains subdued (Graph 3.8).
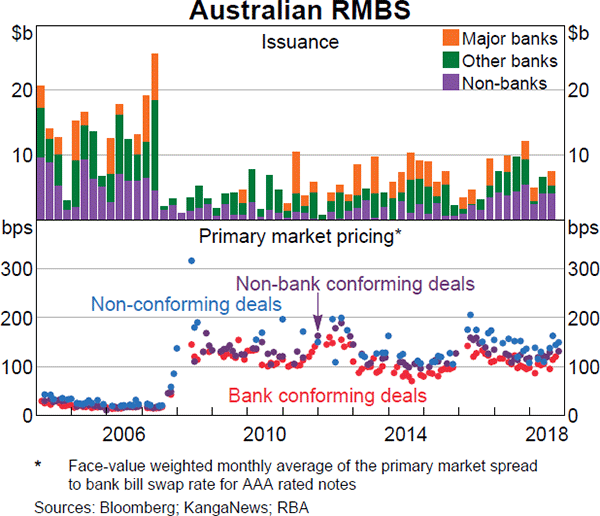
The share of residential mortgage-backed securities (RMBS) issued by non-bank lenders has been relatively high over the past year, with these lenders issuing around $4 billion of RMBS each quarter (Graph 3.9). While issuance for the market as a whole remains lower than in 2017, this has been largely driven by decreased issuance by banks. Prices for new deals – expressed as a spread to BBSW rates – have been higher than the low levels seen at the start of the year.
Most lenders increased their standard variable rates on housing loans …
Most banks have increased their SVRs on housing loans by around 10–15 basis points in recent months (Graph 3.10). These banks generally linked the increases to higher funding costs. Around two-thirds of the entire stock of housing loans is affected by the changes in SVRs at these banks.
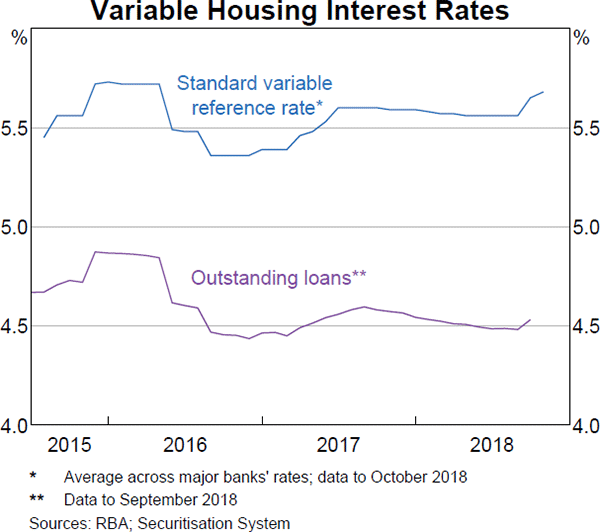
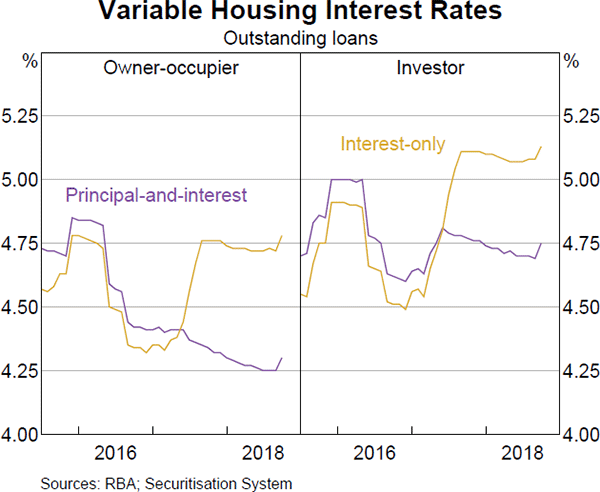
There is preliminary evidence that the increases in SVRs have been flowing through to the actual housing rates paid by households. Data from the Securitisation Dataset suggest that the average outstanding variable rate increased a little in September 2018 (which is the latest data available; Table 3.1).[2] There are several reasons why the measured increase in actual rates so far has been smaller than the announced increase in SVRs by some banks. In part, this reflects the fact that not all lenders increased their SVRs, while some of the SVR increases were not yet effective in September. In addition, interest rates on new loans continue to be significantly lower than interest rates on outstanding loans and some existing borrowers are likely to have refinanced at these lower rates with a different lender or renegotiated the rate of their existing loan with their current lender. By September, variable rates for borrowers making principal-and-interest (P&I) payments were a little below the levels of a year ago, whereas variable rates for interest-only (IO) borrowers were marginally higher than a year ago (Graph 3.11).
| Interest rate Per cent | Change since August 2018 Basis points |
Change since September 2017 Basis points |
|
|---|---|---|---|
| Housing loans(a) | |||
| – Variable principal-and-interest rate | |||
| – Owner-occupier | 4.30 | 5 | −4 |
| – Investor | 4.75 | 6 | −2 |
| – Variable interest-only rate | |||
| – Owner-occupier | 4.78 | 6 | 2 |
| – Investor | 5.13 | 5 | 2 |
| – Fixed rate | |||
| – Owner-occupier | 4.17 | −1 | −13 |
| – Investor | 4.33 | 0 | −8 |
| – Average outstanding rate | 4.50 | 4 | −5 |
| Personal loans | |||
| – Variable rate(b) | 11.49 | 1 | −10 |
|
(a) Average rates from Securitisation Dataset, updated for end September
2018 Sources: ABS; APRA; banks' websites; Securitisation System; RBA |
|||
… but average housing interest rates remain low
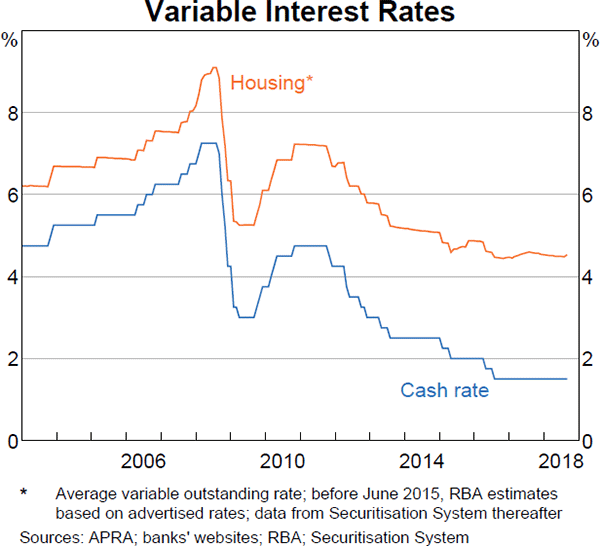
Even taking the recent increases in mortgage rates into account, variable housing interest rates remain at very low levels historically (Graph 3.12).
Advertised fixed rates have declined since the middle of the year across a range of lenders, including some major banks, and are at low levels relative to history. Housing loans with fixed interest rates account for around 20 per cent of outstanding housing credit, and the rates paid on the stock of these loans adjust only gradually.
… and competition for new housing loans remains strong
Interest rates for new loans continue to be significantly lower than for outstanding loans, reflecting continued strong competition for new customers. Several smaller lenders that raised their SVRs in recent months also decreased their advertised variable rates for new loans. Data from the Securitisation Dataset suggest that, on average, rates for new borrowers have decreased over much of the past year, although it is a little too early to assess the impact of the recent increases in standard variable rates on interest rates paid for new loans.
Liaison suggests that competition is particularly strong for borrowers with high-quality credit profiles seeking owner-occupier P&I loans. Competition for investor loans has also increased, particularly among some smaller authorised deposit-taking institutions (ADIs). Overall, the decline in the rates for new loans has been somewhat more pronounced for investors than for owner-occupiers for much of the past year.
Housing credit growth has slowed but business credit growth has picked up
While the growth of housing credit has slowed, the growth of business credit has picked up over the past year and is currently above that of housing credit in six-month annualised terms (Table 3.2; Graph 3.13).
| Three-month ended annualised | Year-ended | ||
|---|---|---|---|
| Jun 2018 | Sep 2018 | Sep 2018 | |
| Total credit | 3.6 | 5.5 | 4.6 |
| – Housing | 4.6 | 4.7 | 5.2 |
| – Owner-occupier housing | 7.1 | 6.4 | 7.3 |
| – Investor housing | 0.1 | 1.4 | 1.4 |
| – Personal | −1.7 | −1.4 | −1.5 |
| − Business | 2.6 | 8.3 | 4.4 |
| Broad money | 1.2 | 3.3 | 2.1 |
|
(a) Seasonally adjusted and break-adjusted Sources: ABS; APRA; RBA |
|||
The slowing in housing credit growth largely owes to investor credit
Housing credit growth has slowed since mid 2017, to be around 4½ per cent in six-month annualised terms. The slowing was most pronounced for investors (Graph 3.14).
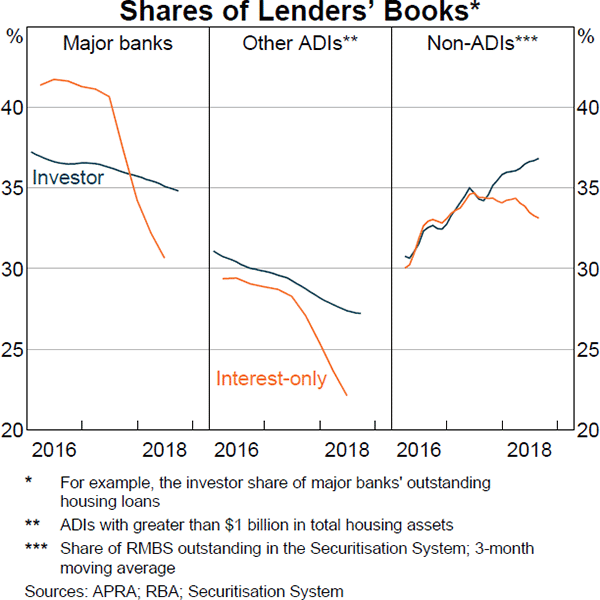
Over the past three months, investor credit increased only a little, by around 1 per cent in six-month annualised terms; this compares to average annualised growth of around 6 per cent over the past decade. Housing credit extended by the major banks to investors contracted over recent months, but this was more than offset by continued growth in lending from other institutions. Growth in investor credit extended by ADIs other than the major banks has picked up recently (Graph 3.15). Liaison with financial institutions also indicates that non-ADIs have been lending to some borrowers who may otherwise have borrowed from ADIs in the absence of earlier regulatory measures (discussed further below). This includes some investors and IO borrowers, as well as some borrowers who may have been offered smaller loan sizes by ADIs or had difficulty meeting their tighter lending criteria. Consistent with this, the available data suggest that a rising share of non-ADI lending has been to investors (Graph 3.16). Furthermore, the share of non-ADIs' loans extended on IO terms appears to have remained relatively stable, while the share of ADI loans on IO terms has declined significantly. While non-ADIs' housing lending has been growing rapidly, the non-ADI share of total housing credit is estimated to remain low, at less than 5 per cent.
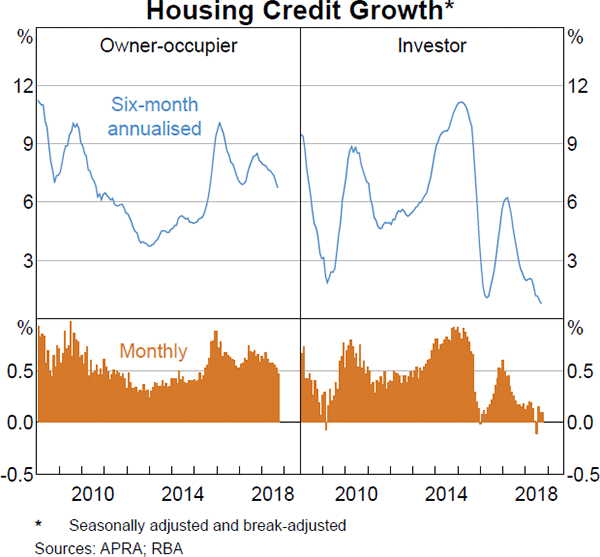
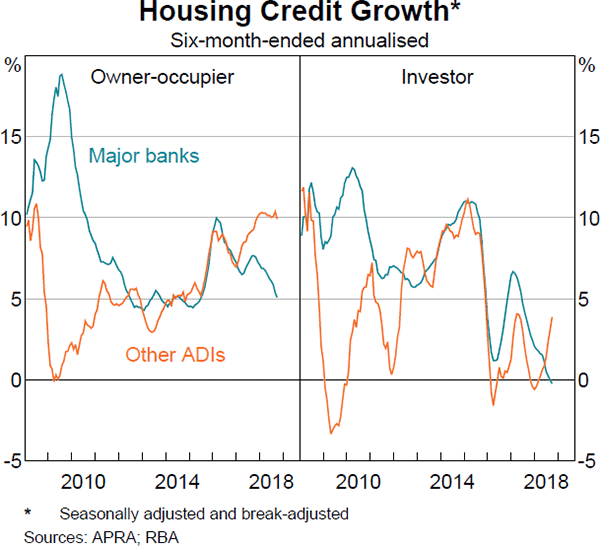
Growth in owner-occupier credit has eased a little recently, but it has grown at around 6½ per cent in annualised terms over the past six months. The recent easing reflects some slowing in the growth of owner-occupier credit at the major banks, while owner-occupier credit growth at other ADIs remains strong at around 10 per cent over the year.
Housing credit conditions are tighter than they have been for some time …
Over the past few years, the increase in standard variable housing loan rates and a range of changes to lending standards prompted by regulatory actions suggest that the supply of credit has tightened. Credit conditions tightened, particularly for investors, as regulators implemented a range of measures from late 2014 onwards to mitigate the risks associated with certain forms of housing lending. These included: a benchmark for investor lending growth, with supervisors paying particular attention to institutions with annual investor credit growth exceeding 10 per cent; a benchmark limiting the share of IO loans to less than 30 per cent of an ADI's new lending; tightening loan serviceability assessment criteria; and guidance aimed at limiting lending at high loan-to-valuation ratios.[3] Collectively, these measures reduced risk by changing the composition of housing lending. They also contributed to the slowing in investor credit growth. Over the same period, financing conditions tightened for foreign investors leading to a reduction in demand for housing from this source.[4] The tightening in the supply of IO loans will have prevented some borrowers from extending their IO period and required them to switch to higher P&I payments; this is likely to have made a very small contribution to the overall slowing in credit growth.[5]
The supply of housing credit is also likely to have been influenced by some more recent developments. Banks may have become less willing to extend credit due to heightened public scrutiny, partly as a result of the Royal Commission into Misconduct in the Banking, Superannuation and Financial Services Industry. Moreover, in response to regulatory actions by Australian Prudential Regulatory Authority (APRA) and Australian Securities & Investments Commission (ASIC), banks have been more thoroughly assessing loan applicants' expenses when deciding how much to lend and it is taking longer for many borrowers to get a loan than in the past. While these delays may have contributed to a slowing in credit growth over recent months, some of this slowing is likely to be temporary as banks transition to new processes. Other developments potentially affecting credit supply include: greater focus on banks' responsible lending obligations; the introduction of limits on lending with high debt-to-income ratios by bank boards;[6] and the introduction of comprehensive credit reporting that will improve the visibility of borrowers' overall debt obligations. The cumulative effect of these changes is to reduce the maximum loan size available to some households. However, only a small share of households had previously borrowed close to the maximum amount that they were offered. So, even noticeable reductions in maximum loan sizes will not be binding for most households. The prospective borrowers most affected will be those who are least able to afford loans and these borrowers account for only a small share of new credit. These changes are therefore not expected to reduce the overall availability of credit by much.[7] In addition, growth in credit to investors by lenders other than the major banks has picked up, providing an alternative source of credit supply. Furthermore, it is possible that credit conditions for investors may ease somewhat in coming months to the extent that banks are successful in applying for their investor lending benchmark to be lifted by the regulator.
… but growth in demand for housing loans has also declined
Growth in the demand for credit also appears to have slowed noticeably over the past year or so, particularly for investors. The fall in housing prices in major markets is likely to have weighed significantly on demand for credit. Investors are likely to have been especially sensitive to expectations of capital losses associated with declines in housing prices. The fact that average variable lending rates drifted down over most of the past year suggests that banks have been responding to this weakness in credit demand by competing more vigorously to supply housing loans to high-quality borrowers. Indeed, there is some evidence that average variable interest rates on new loans declined by more for investors than owner-occupiers, which is consistent with a noticeable decline in growth in demand for investor credit.
Business funding conditions are generally accommodative
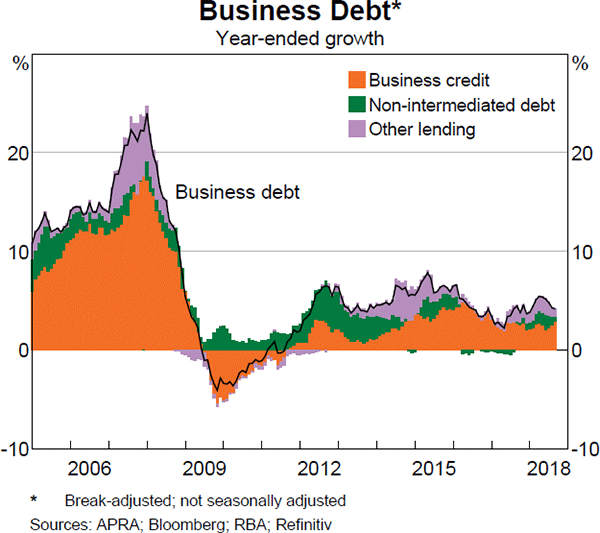
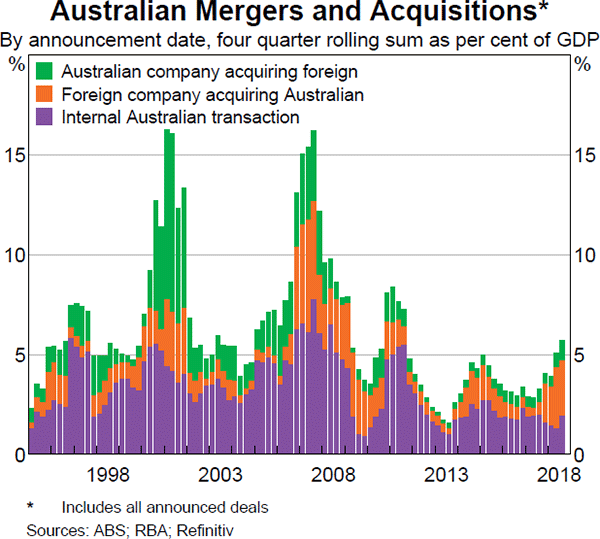
Funding conditions remain accommodative for many businesses. Growth in business credit has picked up in recent months, alongside an increase in mergers and acquisitions activity (see below). However, growth in a broader measure of business debt remains moderate due to a slowing in non-intermediated debt issuance this year (Graph 3.17).
The increased scrutiny of conduct in the financial services sector has extended to lending to small businesses. Market participants have highlighted that there is a trade-off between providing more protections for small business borrowers and the willingness of banks to lend. There is often a blurred line between the business and personal finances of entrepreneurs, so banks can find it operationally easier to also apply the responsible lending rules for consumers to small businesses. This could be contributing to a tightening in access to finance for small businesses.[8]
As discussed earlier, interest rates on loans to many businesses have risen, reflecting the rise in banks' funding costs. Rates on outstanding variable-rate loans to large businesses increased by around 30 basis points over the past year, as most of these loans are linked to BBSW rates (Table 3.3; Graph 3.18). Nevertheless, lending rates for large businesses remain near historical lows. Lending rates on outstanding loans to small businesses were little changed over the past year, as small business rates are generally not directly linked to BBSW rates. However, a few banks have increased advertised interest rates for their residentially secured small business loans alongside the increase in their SVRs on residential mortgages. A few banks have also increased their fixed rates for small business loans during 2018, though these rates also remain low by historical standards.
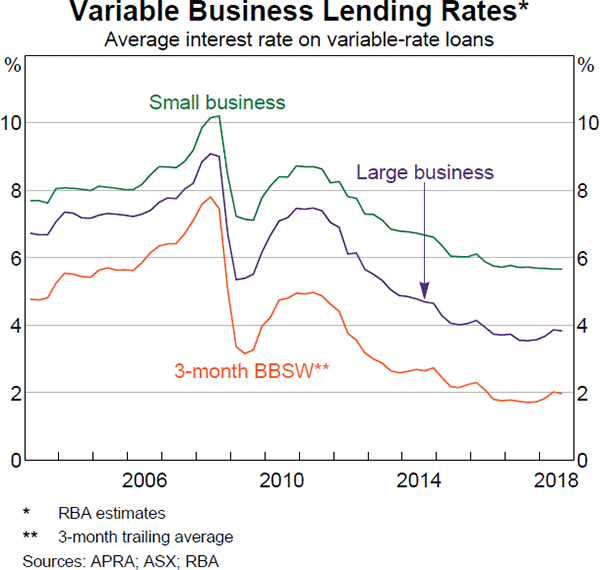
| Interest rate Per cent | Change since September 2017 Basis points |
|
|---|---|---|
| Small business(a) | ||
| – Average outstanding variable rate | 5.66 | −6 |
| – Average outstanding fixed rate | 5.27 | 4 |
| Large business | ||
| – Average outstanding variable rate | 3.83 | 30 |
| – Average outstanding fixed rate | 3.74 | 23 |
|
(a) Loans under $2 million Sources: APRA; RBA |
||
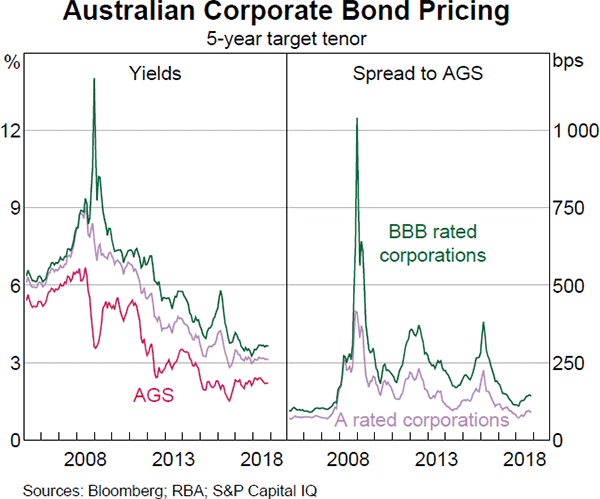
Yields on bonds issued by non-financial corporations have been little changed over recent months and remain at very low levels (Graph 3.19).
Australian equity prices have decreased …
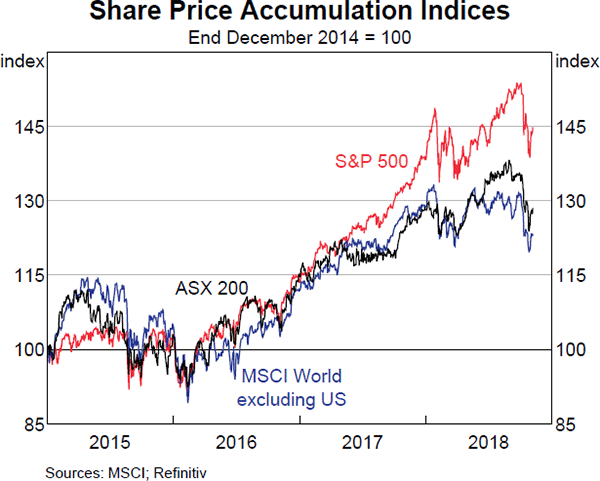
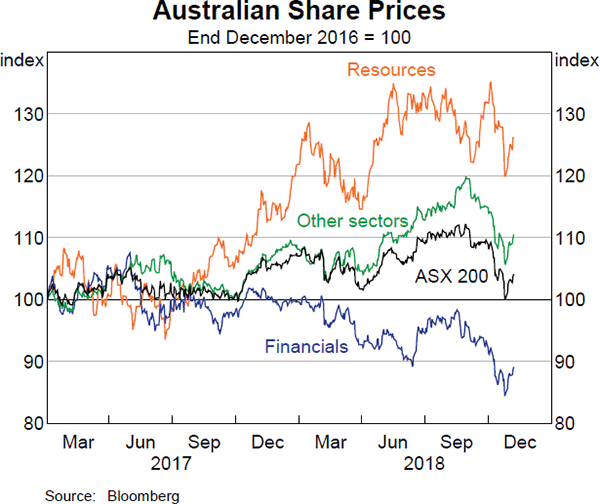
Australian equity prices fell sharply in October in line with global developments. Taking account of dividend payments, the Australian equity market has underperformed relative to the US market but outperformed other markets since the start of the year (Graph 3.20). After an extended period of low market volatility, the equity market decline in October generated a pick-up in volatility to around the average of recent years.
As a result of the recent price falls, share prices for a number of sectors are below their levels at the beginning of the year. Financial sector share prices have experienced some of the largest declines over this period (Graph 3.21). In particular, bank share prices are 12 per cent lower over the year, with their performance in recent months influenced in part by developments associated with the Royal Commission. While the healthcare and information technology sectors have underperformed the market over the past month, share prices for these sectors are still above their levels at the start of the year.
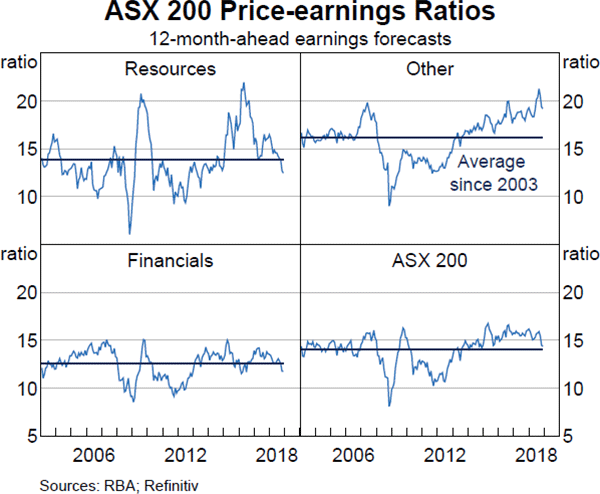
Analysts' expectations for listed company earnings in aggregate have been broadly unchanged in recent months, while those for the resources sector have been revised up slightly. Recent falls in equity prices have led to a decline in price-to-earnings ratios; on this measure, the valuations of resources and financials companies are around their long-run averages, but the valuations of other sectors remain above their long-run average (Graph 3.22).
Merger and acquisition (M&A) activity has continued to be robust in recent months (Graph 3.23). The largest recent M&A deal was the privatisation of the WestConnex motorway by the NSW Government for $9 billion.
… although profits of listed companies are higher than a year ago
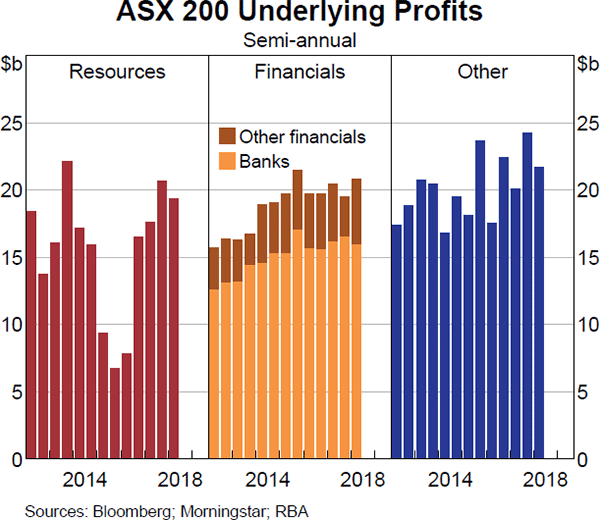
Aggregate underlying profits of ASX 200 companies were 5 per cent higher in the first half of 2018 compared to the same period in 2017, and were slightly above consensus expectations (Graph 3.24). The increase in underlying profits was largely driven by the resources sector, reflecting higher commodity prices. Resources firms continued to pay down debt and return capital to shareholders, though several companies indicated that their focus in coming periods is likely to be a move away from debt reduction in favour of higher dividends.
Underlying profits for the financial sector were little changed relative to the first half of 2017, with a small decline in banks' profits – driven by a narrowing in net interest margins – offset by an increase in earnings at diversified financials. Banks' underlying profits declined a little further recently, reflecting a narrowing of net interest margins.
Underlying profits for listed companies outside the resources and financial sectors rose modestly compared with the same period last year, and were generally a bit stronger than market expectations. The real estate and utilities sectors, along with some internationally focused companies, reported strong profit results; profits at telecommunications and consumer discretionary companies declined.
The Australian dollar is within the narrow range of the past few years
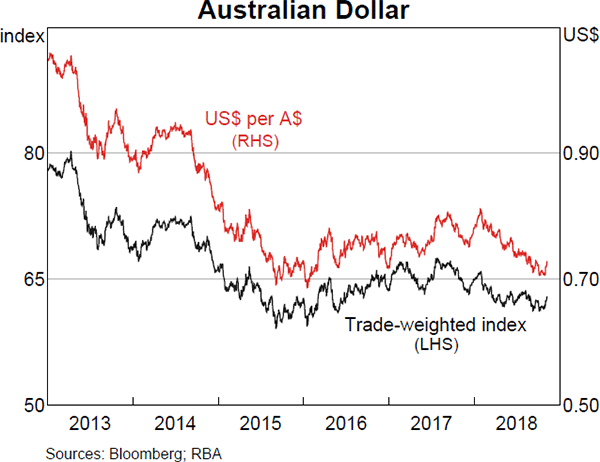
The Australian dollar has depreciated a little since the start of the year on a trade-weighted (TWI) basis, but remains in the fairly narrow range of the past few years (Graph 3.25). The depreciation this year has been more pronounced against the US dollar than on a trade-weighted basis. This is consistent with the appreciation of the US dollar against a number of Australia's key trading partners (see ‘The International Environment’ chapter).
Movements in the Australian dollar tend to be related to developments in commodity prices (and the terms of trade more generally) and interest rate differentials over time. Those two forces have been working in offsetting directions over recent years. The RBA Index of Commodity Prices has increased while Australian government bond yields have declined relative to those in major markets. Over the past 18 months or so, the net effect of these two forces has been consistent with the Australian dollar having depreciated a bit but still within a relatively narrow range.
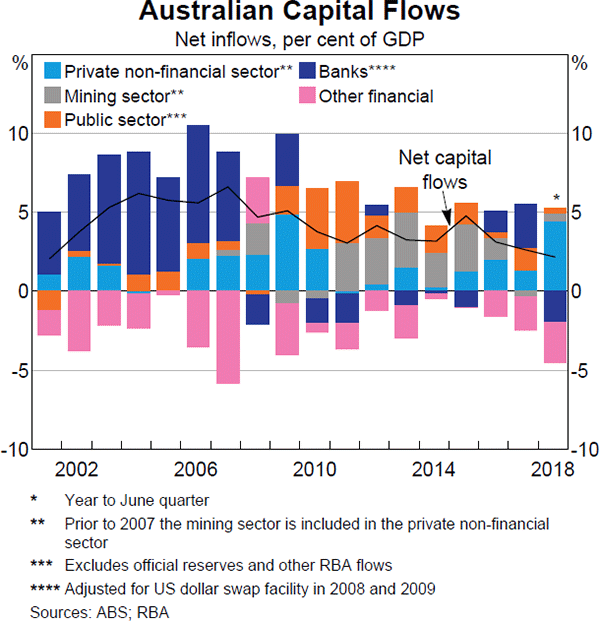
Net capital inflows to Australia have remained modest, consistent with the relatively low level of the current account deficit (Graph 3.26). Underlying this, there have been increased inflows to the non-mining corporate sector in the past few years, partly offsetting a decline in flows to the mining sector and, more recently, outflows from the banking sector. While the banking sector has continued to experience bond inflows, in line with positive net offshore bond issuance by Australian banks, this has been more than offset by outflows in the form of deposits, loans and commercial paper. In turn, this may reflect a decline in short-term Australian bank securities held by US corporations with large cash holdings, such as those in the technology sector, in light of recent tax changes that provide an incentive for the repatriation of funds to the United States.
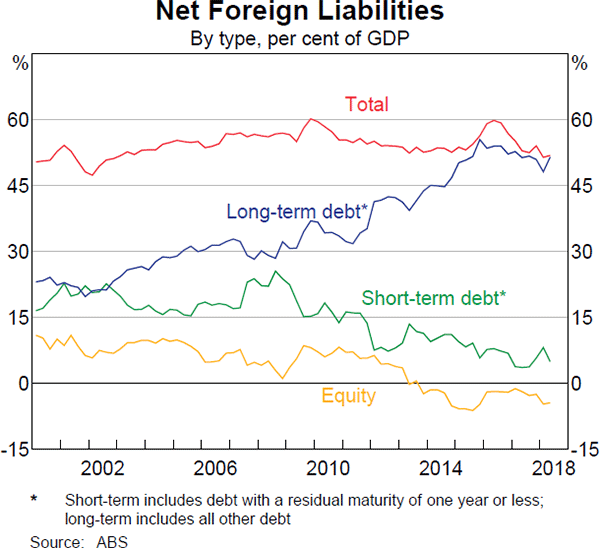
Australia's net foreign liability position has declined over recent years (Graph 3.27). This partly reflects a decline in net capital inflows at a time when the nominal growth of the economy has picked up. It also reflects asset valuation effects; that is, the value of Australian assets held abroad has increased relative to Australia's liabilities with the rest of the world. This reflects foreign equities, particularly those in the United States and Japan, outperforming Australian equities over the past couple of years, and the sizeable offshore equity holdings of the Australian superannuation sector. Over the past year, the depreciation of the Australian dollar has also increased the value of Australia's holdings of foreign assets (which are largely unhedged) relative to foreign liabilities (which are mostly denominated in Australian dollars or hedged against a depreciation of the Australian dollar).
Footnotes
The NIM is a measure of the difference between the interest income earned by banks, for example, on loans and other assets, and the amount of interest they pay out on their liabilities, for example, on deposits and other sources of funding. [1]
The Securitisation Dataset covers around a quarter of the market for housing loans and includes information on the loans underlying both marketed securitisations and ADIs' self-securitisations. These data provide useful indicators of developments in home lending, although loans in the dataset may have different characteristics from those not covered by the dataset. See Kent C (2017), ‘Some Innovative Mortgage Data’, Speech at Moody's Analytics Australia Conference 2017, Sydney, 14 August. See also Kohler M (2017), ‘Mortgage Insights from Securitisation Data’, Speech at Australian Securitisation Forum, Sydney, 20 November. [2]
For further details see RBA (Reserve Bank of Australia) (2018), ‘Assessing the Effects of Housing Lending Measures’, Financial Stability Review, October, pp 75–88. [3]
Lending to non-residents is not included in housing credit, so this has not affected the measures of housing credit growth. [4]
Liaison with ADIs suggests that while some borrowers have encountered repayment difficulties after switching to P&I repayments at the end of their IO terms, many have subsequently been able to adjust to higher payments within a year. See RBA (2018), Financial Stability Review, October. [5]
Subject to this, and confirmation that banks' lending policies are sufficiently strong, banks can apply to have the 10 per cent investor lending benchmark lifted. [6]
For further details see RBA (2018), ‘Box B: The Impact of Lending Standards on Loan Sizes’, Financial Stability Review, October, pp 32–36. [7]
For further details, see Connolly E and J Bank (2018), ‘Access to Small Business Finance’, RBA Bulletin, September. [8]