Statement on Monetary Policy – November 2018 1. The International Environment
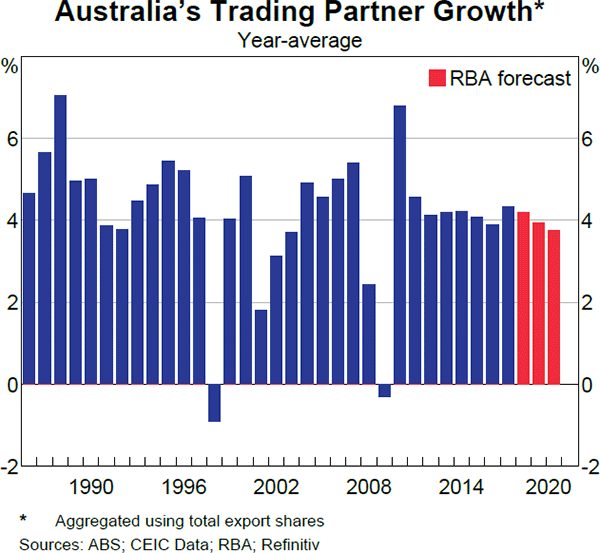
Global economic conditions remain robust. Major trading partner growth has continued at a bit above the average of recent years. While growth has eased in some economies, in the United States the recent fiscal stimulus has contributed to a further strengthening in growth. The outlook for major trading partner growth is for a gradual easing over the next two years (Graph 1.1). Trade tensions have escalated over recent months and represent a downside risk to the global outlook.
Labour markets have continued to tighten, particularly in the major advanced economies, and this has helped push wages growth up. Core inflation has increased and is close to inflation targets in some economies, including the United States, but remains low and little changed in other advanced economies. There has been a broad-based pick-up in headline inflation this year because oil prices have moved higher.
The major central banks are at different stages of their monetary policy cycles, reflecting differences in the amount of spare capacity in these economies and/or the outlook for inflation. Policy stimulus has continued to be withdrawn gradually in a few economies, particularly in the United States. For other advanced economy central banks, policy is expected to remain very accommodative and little changed for some time.
More broadly, financial conditions in advanced economies remain supportive of economic growth. Sovereign bond yields and the cost of corporate debt financing remain low and short-term money market spreads are generally narrow. However, recently conditions tightened somewhat as equity prices declined sharply and credit spreads widened slightly. A number of risks could prompt a significant further tightening of conditions. Moreover, while financial conditions have stabilised of late in the few emerging market economies with external financing vulnerabilities and/or relatively weak institutional frameworks, challenges remain.
Growth in China has moderated over the past year, partly because policymakers have sought to mitigate risks to financial stability by tightening the supply of riskier forms of finance and improving the transparency of local government finances. More recently, the authorities have taken steps to ease fiscal and monetary policy in a targeted fashion to support growth without undermining broader efforts to address risks in the financial sector. Growth elsewhere in Asia has been relatively resilient, particularly given the more difficult external financing environment faced by a few other emerging markets of late.
Trade tensions have escalated
Trade tensions have increased since the previous Statement on Monetary Policy. As a result of measures imposed over recent months, nearly half of US imports from China and around three quarters of Chinese imports from the United States have become subject to higher tariffs. The effective US tariff rate on imports from China has increased from around 3 per cent to around 8 per cent, and the effective Chinese tariff rate on imports from the United States has increased from around 6 per cent to around 14 per cent.
The trade tensions appear to be having some effect on the global economy. Survey indicators of new export orders have weakened sharply this year in a number of economies, although the downward trend started ahead of the tariffs being introduced. Business surveys suggest that US manufacturers are concerned about rising input prices and the impact of this on their competitiveness. The uncertainty generated by the trade disputes could already be affecting investment decisions in some economies. A number of US companies noted in recent earnings reports that trade tensions pose a risk to their future earnings, although earnings growth has been strong in recent quarters.
The Chinese authorities have announced a number of initiatives to support their trade-exposed firms to counter the effect of the higher US tariffs. Export tax rebates have been increased, banks have been encouraged to provide liquidity support to both importing and exporting firms, and import tariffs on goods from other economies have been reduced.
Still, the outlook for trading partner growth remains positive
Overall, the outlook for growth in Australia's major trading partners is little changed from the August Statement on Monetary Policy. A modest easing in growth is expected over the next two years, in part because monetary policy accommodation is expected to be gradually removed in some economies as spare capacity is absorbed.
Growth is expected to remain above potential in most of Australia's trading partners. Growth in the United States is expected to be well above potential, partly because of the substantial fiscal stimulus. Nevertheless, the recent escalation in trade tensions has resulted in some small downward revisions to the growth outlook for the United States and some of the more trade-exposed east Asian economies in 2019.
The GDP growth forecasts for the euro area and Japan have also been revised a little lower to reflect recent data. Growth in the euro area is expected to remain a little above potential over the next two years. Growth in Japan is expected to remain above potential next year and to ease to well below potential in 2020 as fiscal policy is tightened through the increase in the consumption tax rate in late 2019.
The outlook for Chinese activity is marginally weaker following the recent downward revisions to the official GDP figures. While the trade conflict with the United States is expected to weigh on Chinese exports, this negative impulse is expected to be largely offset by policy efforts to support growth in other sectors of the economy.
On the other hand, growth in India and New Zealand is expected to be higher than previously forecast in 2018, reflecting stronger-than-expected GDP growth in the first half of the year. Growth in New Zealand is expected to be above potential over the next two years.
The effects of a further escalation in trade tensions are an important source of uncertainty for the global outlook (see ‘Economic Outlook’ chapter for a more detailed discussion). The US Administration is planning a further tariff rate increase early next year if no progress is made on its trade negotiations with China. On a more positive note, the United States has made some progress towards resolving some of its other trade grievances, including a renegotiated US-Mexico-Canada trade agreement and agreement to have trade discussions with Japan and the European Union.
Growth in the major advanced economies remains above potential …
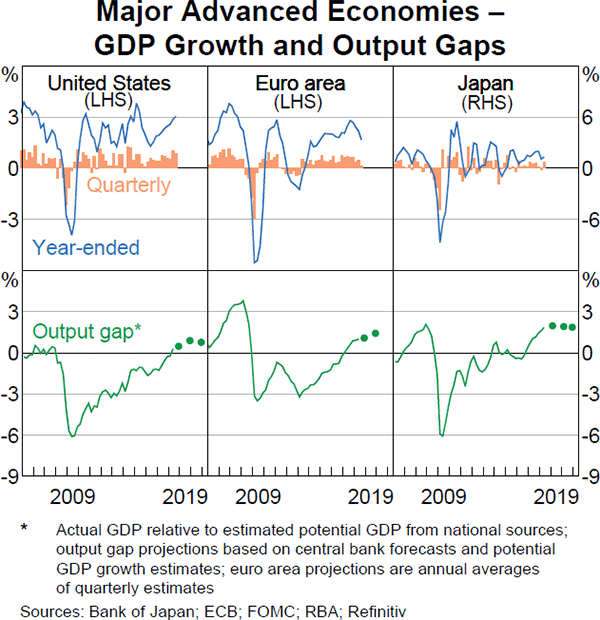
GDP growth in the major advanced economies has been above potential for some time (Graph 1.2). Output gaps appear to have closed and survey measures of capacity utilisation and supplier delivery times remain elevated, suggesting that inflationary pressures are likely to be building.
In the United States, private consumption growth has picked up, supported by lower personal income taxes and strong labour market conditions (Graph 1.3). The outlook for consumption growth is strong because both wages growth and household wealth have been increasing. Business investment growth picked up in the first half of the year, supported by the reduction in corporate tax rates, but slowed sharply in the September quarter. Elevated investment intentions and increasing capacity constraints suggest that strong investment growth is likely to resume. US exports to China declined considerably in the September quarter, suggesting that the increase in US-China trade tensions could be having some effect, although growth in imports from China has held up so far. The increased trade tensions are expected to weigh on consumption and business investment over the medium term because they will increase import prices, reduce US competitiveness, and could also result in US monetary policy tightening more quickly than otherwise.
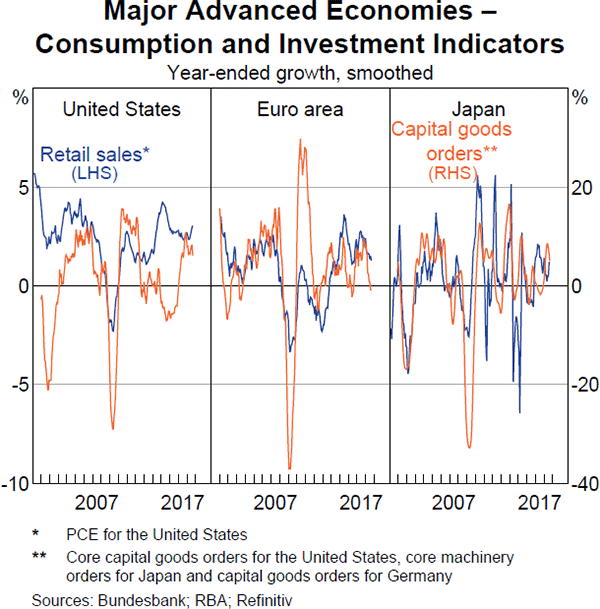
Japanese GDP growth remains above trend, although it is likely to have moderated temporarily in the September quarter due to disruptions from natural disasters. Over the past year, activity has shifted towards domestic demand. Business investment has picked up strongly, partly to address severe labour shortages. Surveys suggest that investment growth will remain high over the next few quarters. Japanese growth will also get a near-term boost from consumption being brought forward ahead of a scheduled consumption tax increase in late 2019. However, export growth has slowed and the decline in export orders suggests that export growth is likely to remain subdued in the near term.
Growth in the euro area has eased in 2018. The slowing in year-ended growth has been broadly based across countries and most expenditure components. External demand, particularly from China, has weakened. Forward-looking indicators, such as new export orders, suggest that export growth is unlikely to pick up again in the short term. Business survey indicators and consumer sentiment have also drifted lower. Nevertheless, year-ended growth has remained above potential, and broader conditions – including strong labour markets and increased capacity utilisation – are still supporting growth.
… so labour markets are tightening and wages growth is increasing
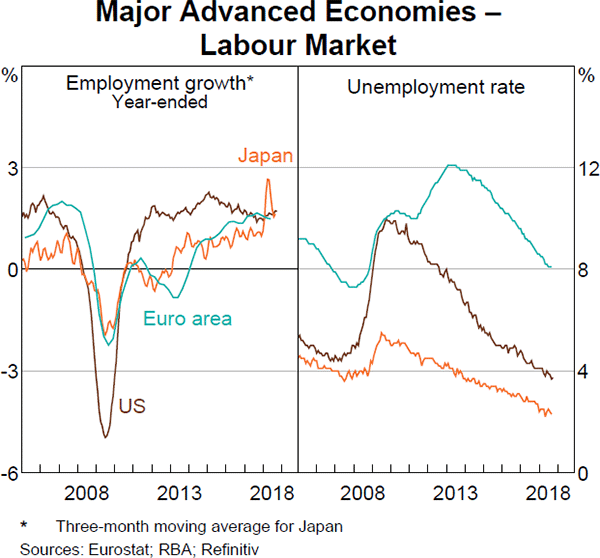
Labour market conditions in the major advanced economies have tightened further (Graph 1.4). Employment growth has remained higher than the growth in working-age populations. Unemployment rates are at multi-decade lows and have continued to edge lower in recent months, particularly in the United States and the euro area. Measures of underemployment have also declined and job vacancies have increased. The labour force participation rate has increased further in Japan, especially for females, and remains steady in the United States and the euro area.
Unemployment rates have been below conventional estimates of full employment in these economies for some time, but wages growth has been slow to pick up. Although wages growth has gained momentum over the past year, it remains low by historical standards given the apparent tightness in these labour markets (Graph 1.5).
In the United States, wages growth has picked up this year. Labour turnover has increased as the labour market has tightened and is now above its pre-crisis rate. The increase in labour turnover is relevant to the outlook for wages growth because much of the increase in wages growth over the past three years has been for workers who have switched jobs; more recently, there have also been significant increases for the much larger group of workers who have stayed with the same employer. In the euro area, wages growth picked up considerably in the June quarter, continuing the upward trend of the past two years. In Japan, full-time wages growth has picked up this year and part-time wages growth has been increasing strongly for a few years now.
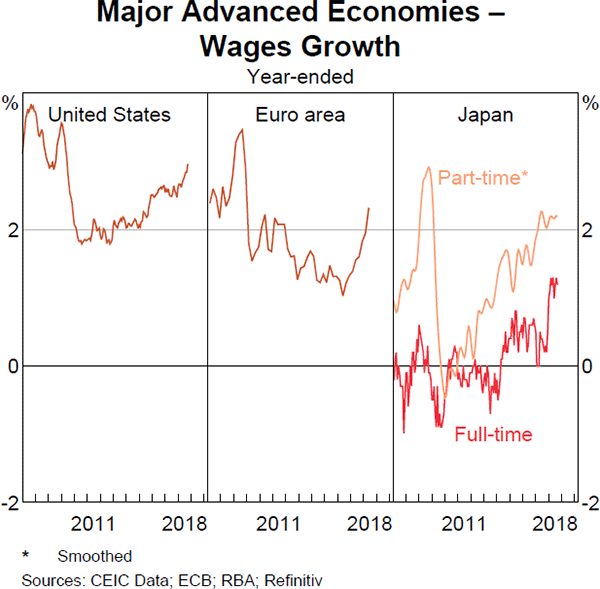
Several advanced economies, including New Zealand and Korea, have implemented significant minimum wage increases in 2018, and further increases are planned over coming years. More broadly, tightening labour markets and more-pronounced capacity pressures are expected to contribute to further increases in nominal wages growth and hence CPI inflation over time.
Core inflation has increased in some economies
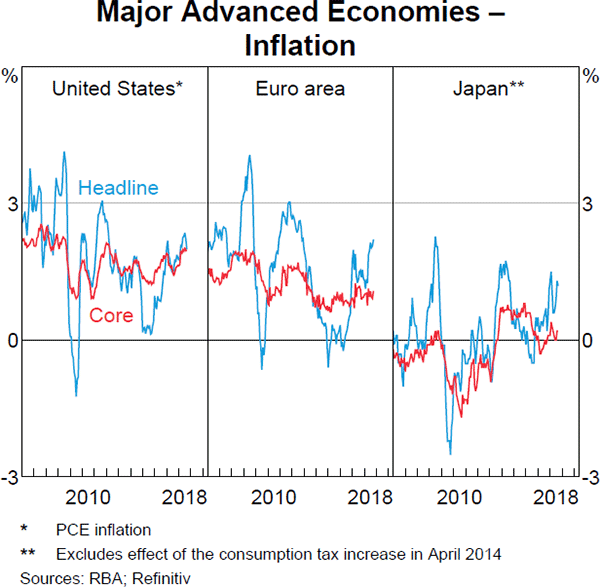
Core inflation has increased in the United States and has been around the Federal Reserve's (Fed's) inflation target since March (Graph 1.6). Core inflation has also increased in Canada, Norway, Sweden and the United Kingdom to be around their respective inflation targets, but it remains low and below inflation targets in other advanced economies. Headline inflation has increased in most advanced economies this year as a result of the pick-up in oil prices. Inflationary pressures are expected to increase with the continued build-up in capacity pressures.
Inflation expectations remain well anchored
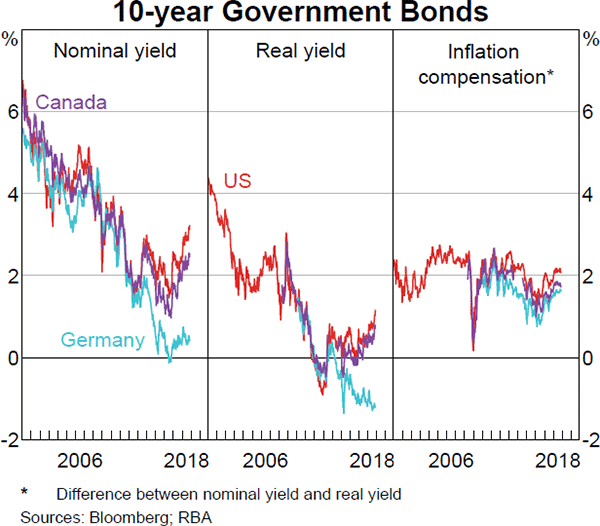
Despite recent rises in inflation, market-implied and survey-based measures of inflation expectations in advanced economies have remained stable, around levels consistent with central bank policy targets. In line with this, the rise in nominal bond yields for those economies where capacity pressures are building have mostly reflected a rise in real yields, rather than inflation compensation or term premiums (Graph 1.7). Nominal bond yields could rise further if real yields continue to increase or if inflation expectations and/or term premiums begin to rise.
The major central banks are at different stages of their monetary policy cycles
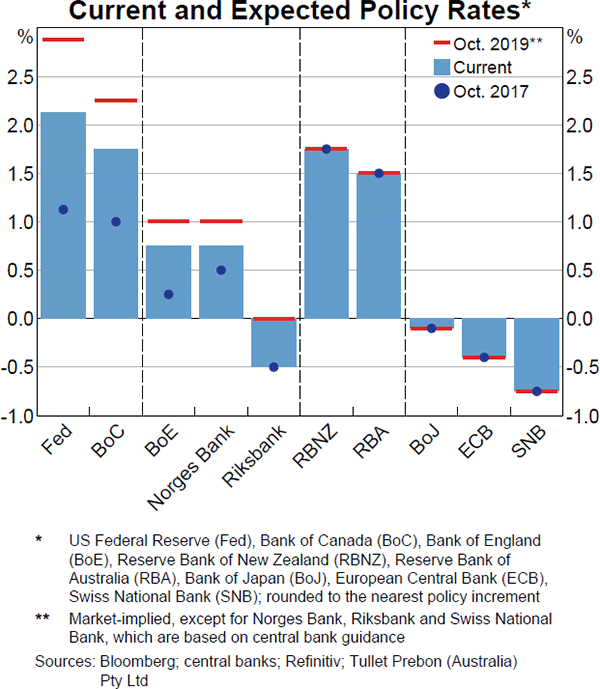
Globally, monetary policy settings remain expansionary. However, financial market pricing implies that the policy settings of some central banks are expected to gradually become less accommodative over the coming year, while for other central banks, policy is expected to remain very accommodative and little changed for some time (Graph 1.8). These differences in expected policy paths reflect differences between the amount of spare capacity in these economies and/or the outlook for inflation:
- The Fed and the Bank of Canada (BoC) are progressively increasing their policy rates. The Fed's balance sheet is expected to continue to decline at a gradual pace but remain above pre-crisis levels.
- The Bank of England (BoE) and Norges Bank are in the early stages of raising their policy rates from very low levels (with the Riksbank expected to do the same in coming months). The BoE and Riksbank have also ceased their net asset purchases (the Norges Bank never pursued an asset purchase program).
- Financial market participants expect the Reserve Bank of New Zealand (RBNZ) to leave its policy rate on hold for some time, although it never lowered its rate to the levels observed in other advanced economies (nor increased its balance sheet). The situation is similar for the Reserve Bank of Australia.
- The Bank of Japan (BoJ), European Central Bank (ECB) and Swiss National Bank (SNB) are expected to maintain negative policy rates for some time. The BoJ and ECB continue to provide monetary stimulus by expanding their balance sheets, although the ECB expects to cease net asset purchases at the end of this year.
- In China, the People's Bank of China (PBC) has taken measures to selectively ease financial conditions to support growth without adding to financial sector vulnerabilities.
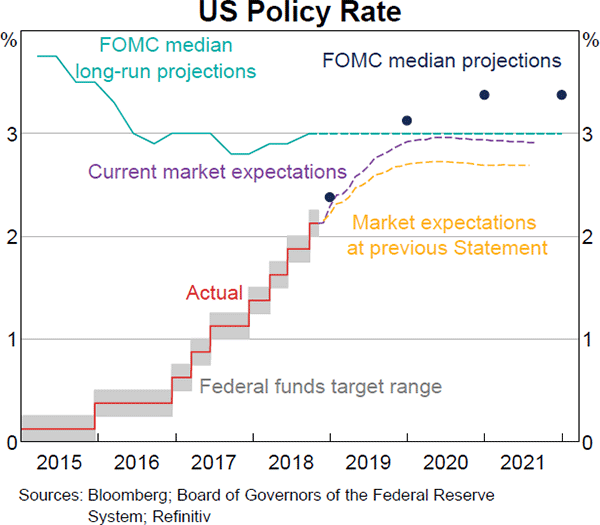
This year, financial markets have become increasingly confident that the Fed will pursue its projected path of gradual policy tightening. The Federal Open Market Committee (FOMC) has raised the federal funds rate target range three times this year, each time by 25 basis points, and a fourth increase is expected in December. The FOMC projections suggest that the federal funds rate will be increased three more times in 2019 and once in 2020, to a level that the FOMC members assess will be a slightly contractionary stance of monetary policy (Graph 1.9). However, interest rate pricing continues to suggest that the market does not expect the policy rate to increase by as much as the FOMC is projecting.
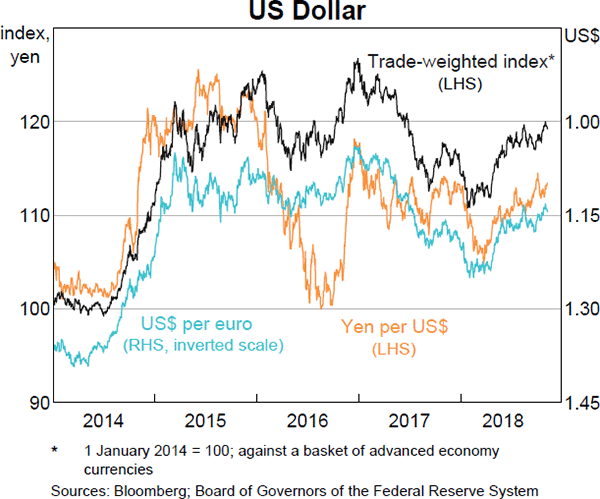
Consistent with the divergence in monetary policy stances and widening differentials between yields on US sovereign debt and those of other advanced economies, the US dollar has appreciated by around 5 per cent on a trade-weighted basis since the beginning of the year (Graph 1.10).
Financial conditions have tightened somewhat but remain supportive of growth
Financial conditions in the major advanced markets have tightened somewhat recently, but remain supportive of economic growth overall.
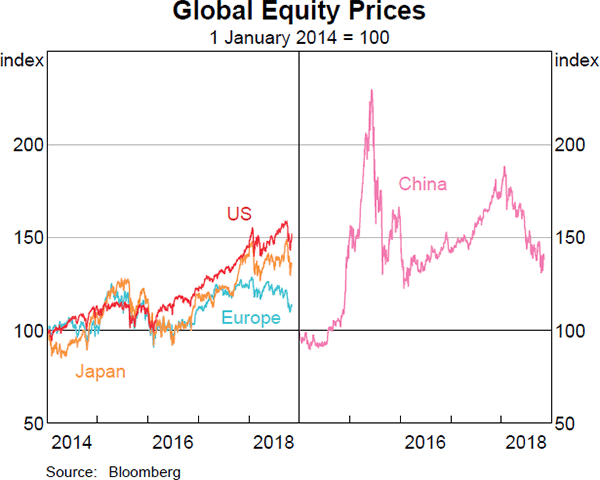
Global equity prices fell sharply in October (Graph 1.11). Analysts cited a range of factors as having contributed to the declines, including concerns that earnings growth will decline due to the imposition of trade tariffs and rising cost pressures more broadly, higher bond yields and elevated valuations (most notably for the United States). Nonetheless, third-quarter corporate earnings have been robust, particularly in the United States. Chinese equity prices also fell sharply, to around their trough in 2016, before stabilising after regulators announced measures to support the market. While large in absolute terms, relative to the size of the economy, China's equity market is smaller than those in many advanced economies, and it accounts for a small share of household assets and corporate financing.
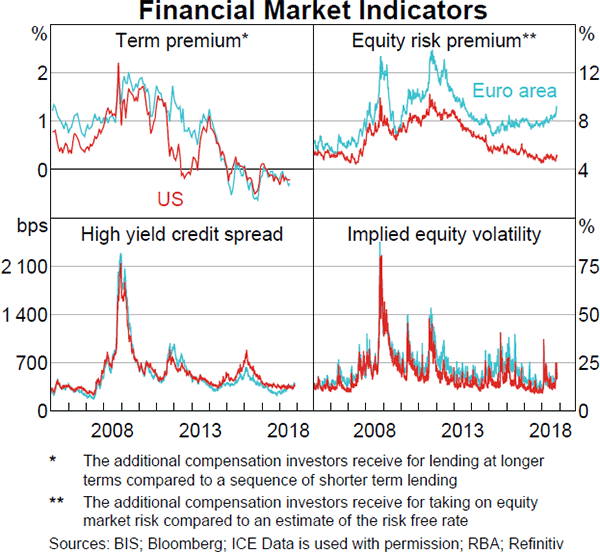
Despite the recent volatility in equity markets, the cost of long-term finance for corporations issuing debt in advanced economies remains low relative to history (Graph 1.12). In part, this reflects expectations that central bank policy rates will remain relatively low for some time. More generally, low financing costs imply that investors are demanding little compensation for risk; for example, this can be seen in low premiums for the risk of financing corporations relative to governments (the credit risk premium) and for long-term interest rate risk (the term premium). This is consistent with expectations of low future corporate default rates and low levels of uncertainty over future inflation and policy rate outcomes.
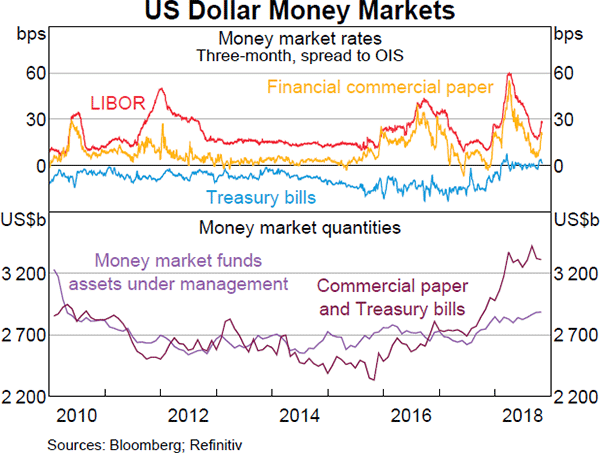
While there has been a modest widening in spreads in short-term US dollar money markets recently (over and above expected policy rates), spreads remain significantly lower than earlier in the year (Graph 1.13). The overall easing in funding pressures since the first quarter may be partly due to investors responding to the earlier rise in short-term interest rates by increasing their allocations to money market funds, which invest in such instruments. Further, unlike in the first quarter of this year, episodes of increased issuance of US Treasury bills, while still significant, have been smaller and better anticipated by the market.
Several key risks could prompt a significant tightening of global financial conditions if they were to materialise. A further increase in trade tensions could generate uncertainty around the outlook for economic growth and corporate earnings. An unexpected increase in inflationary pressures in the United States could prompt the Fed to increase the federal funds rate by more, or more quickly, than currently anticipated. The tightening in financial conditions that has been seen in some vulnerable emerging markets this year could spill over to other emerging markets. In addition, an increase in political and policy uncertainty in Europe could also see risk premiums in global financial markets widen in a disruptive manner.
Italian bond yields remain high as markets have focused on fiscal sustainability
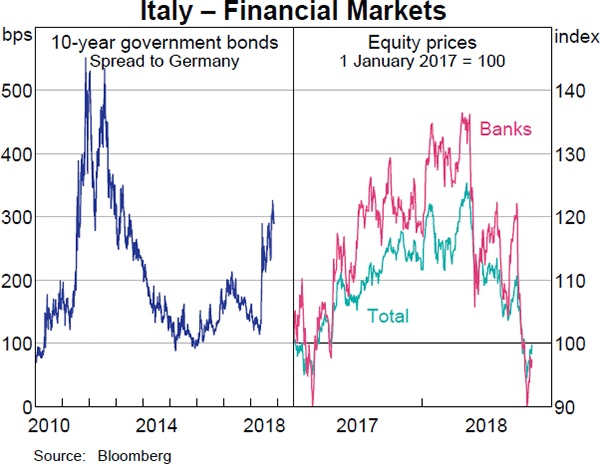
The sustainability of Italy's public finances remains a key concern for financial markets. The government's draft budget was released in October and incorporated some expansionary fiscal measures, increasing the size of the deficit to levels that are in breach of European Commission rules. The budget also projected a gradual decline in the debt-to-GDP ratio over the next few years, but this may not eventuate if market interest rates are higher or if economic growth is lower than assumed.
The spread between yields on Italian government bonds and German Bunds has therefore remained elevated in recent months, although still below the levels of the European sovereign debt crisis in 2012 (Graph 1.14). Italian equity prices have declined sharply, particularly in the banking sector. This is largely because of concerns about the implications of rising government bond yields and/or a sovereign credit downgrade for bank solvency, liquidity and profitability, and the resilience of the domestic financial system more broadly (reflecting the fact that Italian banks own one quarter of Italian sovereign debt).
Spillovers to other bond markets in the euro area have so far been limited. However, the euro exchange rate has been responsive to changes in sovereign credit risk. Conflict between the new Italian Government and the European Commission over the Italian budget, or a downgrade of Italian sovereign debt to non-investment grade by the major rating agencies, could lead to further pressures on Italian banks and a broad-based increase in risk premiums across the euro area.
Chinese growth has moderated
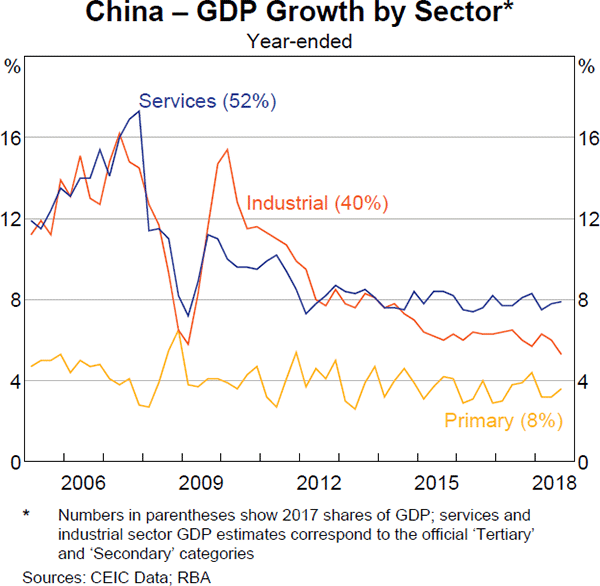
In China, real GDP growth has eased a little over the past year following the tightening of financial conditions (partly induced by policy initiatives) through late 2017 and early 2018 (Graph 1.15). Restrained public spending on infrastructure continues to have flow-on effects to activity in parts of the manufacturing sector; output of a wide range of industrial products has been flat or falling for most of the past year, and survey measures of Chinese manufacturing conditions have declined in recent months. Nonetheless, resilient growth in service sector activity has largely offset weak conditions in the industrial sector.
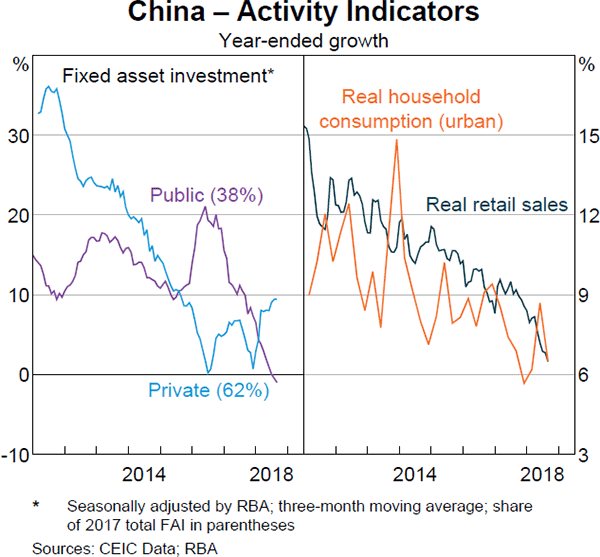
Real investment growth moderated in the September quarter, as public investment continued to be constrained by authorities' efforts to control growth in local government debt and reduce financial risks (Graph 1.16). However, the value of new projects approved by the government has increased strongly, which should support public investment in the period ahead. Private investment growth has also strengthened in recent months. Real consumption continues to grow at a slightly faster pace than investment, underpinned by consumption of services, although sales of consumer goods have slowed.
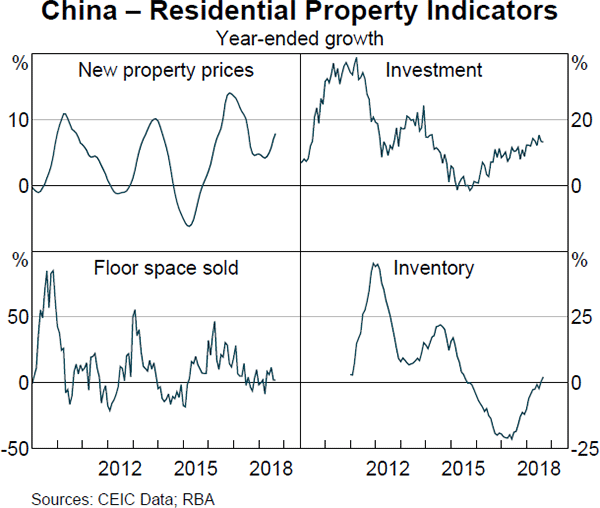
Conditions in Chinese property markets across the country have been mixed of late (Graph 1.17). Housing prices have increased further in most cities, but real estate investment growth has been broadly stable and growth in new sales has eased, especially in smaller cities; as a result, inventory levels have increased a little recently. Measured growth of real estate investment continues to be driven almost entirely by growth in spending on land purchases. Construction completions have declined, while advance sales of apartments and new commencements have both eased in recent months, which is likely to weigh on construction activity (and thus demand for steel) in the near term.
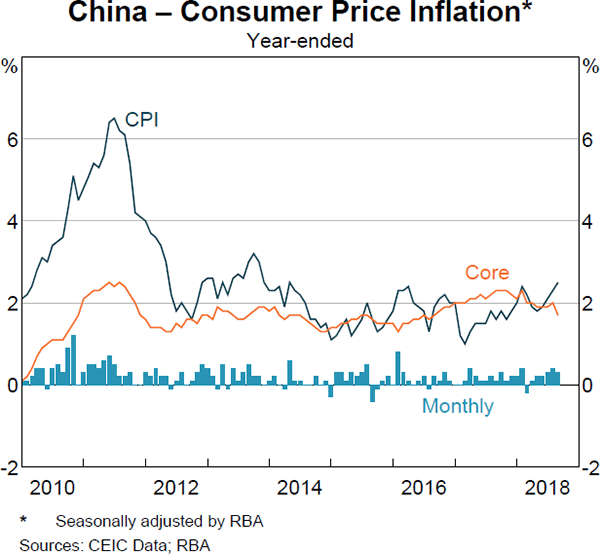
Producer price inflation has continued to ease, reflecting weaker growth in manufacturing, mining and raw material prices. Core inflation has been broadly unchanged but headline inflation has increased a little, led by a pick-up in food prices (Graph 1.18). This has been driven partly by a rise in pork prices, associated with an outbreak of African swine flu in August. Flooding in eastern China resulting from recent tropical cyclones has also contributed to higher vegetable prices.
Chinese authorities have responded to softer growth with targeted policy easing
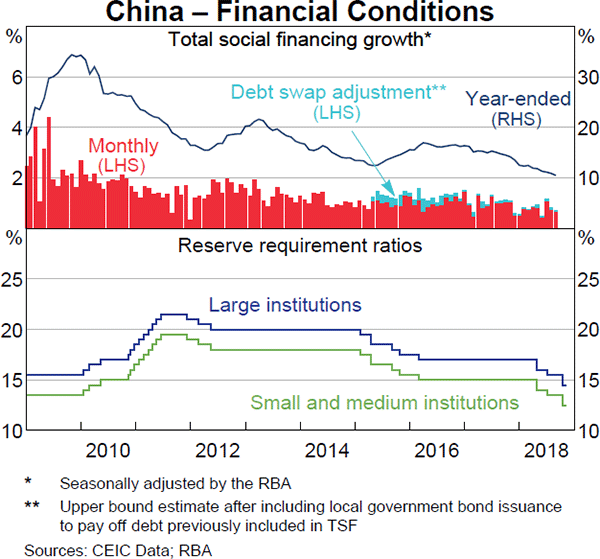
In response to weaker growth in parts of the economy and concerns about escalating trade tensions, the Chinese authorities have continued to implement a targeted easing of policies. This easing has been modest in scale relative to previous episodes, partly because it has been highly targeted. The authorities also remain mindful about the need to contain financial stability risks and to discourage shadow banking activities (see ‘Box A: Evolving Financial Conditions in China’). Measures have included a series of cuts to the reserve requirement ratios for banks by the PBC to ensure that money market rates remain low and that ample liquidity is available to the banking system (Graph 1.19). Credit growth (which is an important component of total social financing) has remained strong in recent months, partly driven by bank lending to businesses. But limited access to credit for smaller private sector enterprises remains a key concern for policymakers and, as a result, officials continue to urge banks to increase their lending to smaller firms.
The government also remains committed to broadening fiscal support for growth. In August, the Ministry of Finance directed local governments to accelerate their issuance of special bonds to fund infrastructure projects, and the available data suggest that local governments are broadly on track to meet their issuance quotas for 2018.
Alongside these efforts, the Chinese authorities have continued to introduce measures to contain the build-up of financial risks. Recent government directives have focused on reducing the leverage of state-owned enterprises (SOEs); SOEs with debt-to-asset ratios that exceed certain thresholds will be subject to more intrusive government oversight. Regulators have also taken steps to prevent instability arising from the collapse of hundreds of online peer-to-peer (P2P) financing platforms in recent months, although some consolidation in the P2P market was an intended consequence of recent measures. To help smooth the adjustment, the four large majority state-owned asset management companies have reportedly been instructed to assist with the liquidation and restructuring of distressed P2P assets.
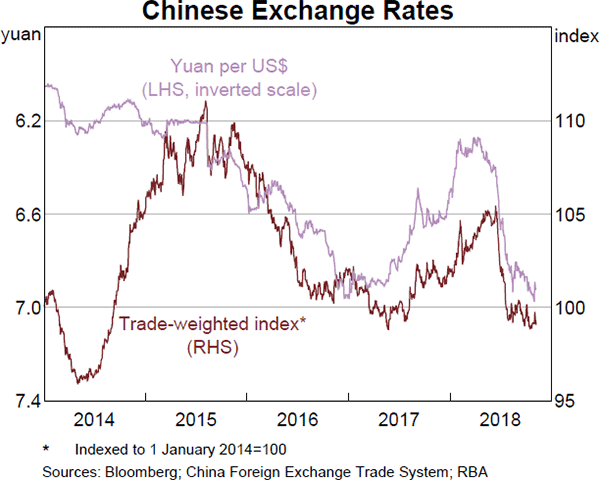
The Chinese renminbi has depreciated modestly in each of the past seven months to be around the same level against the US dollar as its trough in late 2016 (Graph 1.20). So far, there have been no substantive signs of direct intervention by the Chinese authorities in the spot foreign exchange market, and limited evidence of large-scale private capital outflows. This is in contrast to 2015 and 2016, when expectations for depreciation of the renminbi prompted significant intervention and a noticeable tightening of capital controls on outbound investment.
Growth elsewhere in Asia has been relatively resilient
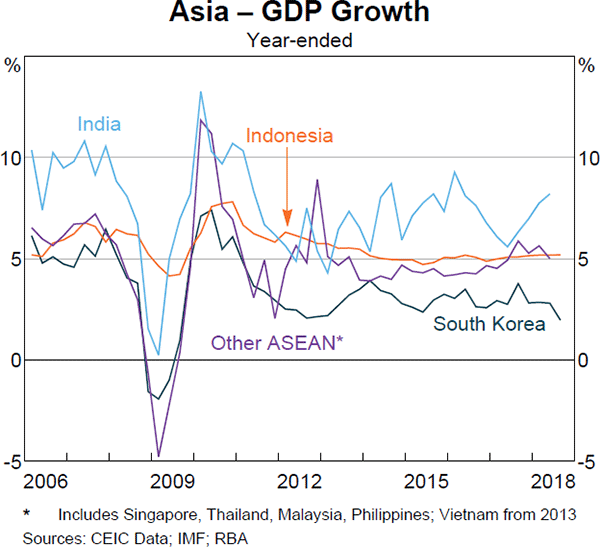
GDP growth in Asia (excluding China and Japan) has remained relatively strong in 2018 to date (Graph 1.21). Growth has picked up in India, has been steady in Indonesia, but has eased in Korea and the other ASEAN economies.
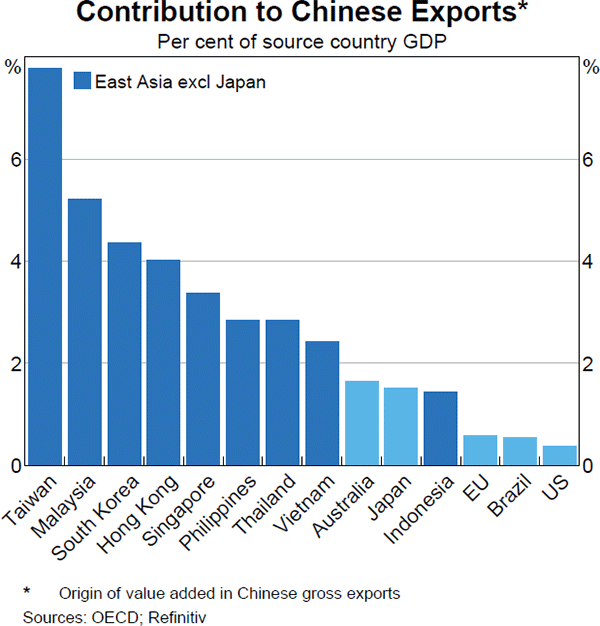
Many of the economies in east Asia are particularly exposed to rising trade tensions between the United States and China because they produce intermediate goods used in the production of Chinese exports as a part of integrated supply chains across Asia (mainly for electronics products); for example, the Korean content of Chinese gross exports is around four per cent of Korean GDP (Graph 1.22).
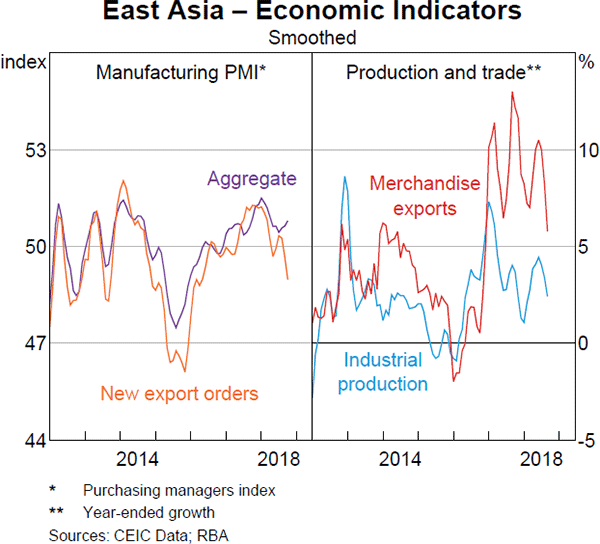
In east Asia overall, industrial production growth has declined in recent months (Graph 1.23). Surveyed business conditions in the manufacturing sector have also declined this year, as have new export orders.
However, it is also possible that, over a longer timeframe, some of the lower-cost economies in the region could benefit from rising trade tensions if production is relocated to avoid US tariffs on Chinese goods; there have been growing anecdotal reports of such business considerations in recent months.
In Korea, business investment has declined this year, as previous investment initiatives to increase productive capacity in the electronics sector have been completed. Although consumption growth in Korea has remained strong, consumer confidence has declined considerably in recent months to around its average level. This may reflect the sharp fall in employment growth in response to the substantial increase in the minimum wage earlier in the year.
Growth in India strengthened further in the June quarter, underpinned by robust growth in investment and private consumption. Consumption growth is expected to remain strong, following the reduction in the goods and services tax on a number of white goods, televisions and other household appliances.
Strong growth in investment continues to support crude steel production, which has increased a little further in recent months, and is driving elevated levels of coking coal imports (including from Australia). Indian exports also grew strongly in the June quarter, although not at a fast enough pace to prevent the trade deficit from widening further.
GDP growth in Indonesia has remained resilient, despite a significant monetary policy tightening this year related to financial developments. Consumption continues to be the key driver of growth, while growth in investment has remained elevated.
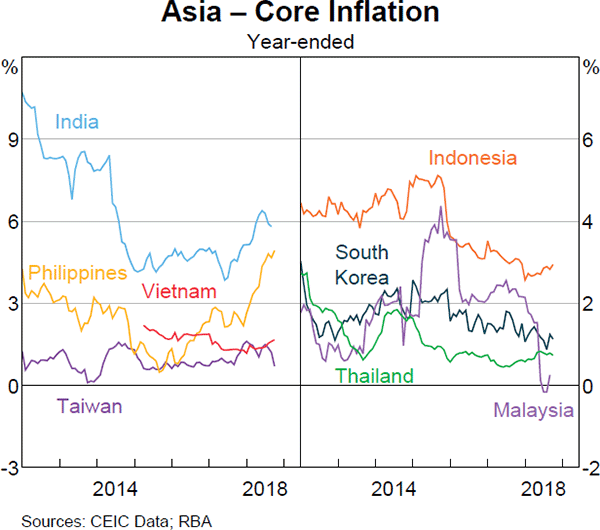
Inflation remains subdued in most of the region (Graph 1.24). Inflation has declined sharply in Malaysia due to changes in consumption taxes. Indian CPI inflation has eased in recent months, falling below the Reserve Bank of India's medium-term inflation target of 4 per cent, due to a noticeable moderation in food price inflation; however, core inflation (which excludes food and fuel) remains elevated. In the Philippines, inflation has increased sharply due to strong domestic demand pressures and higher excise taxes implemented earlier in the year.
Some emerging market economies continue to face a challenging external financing environment …
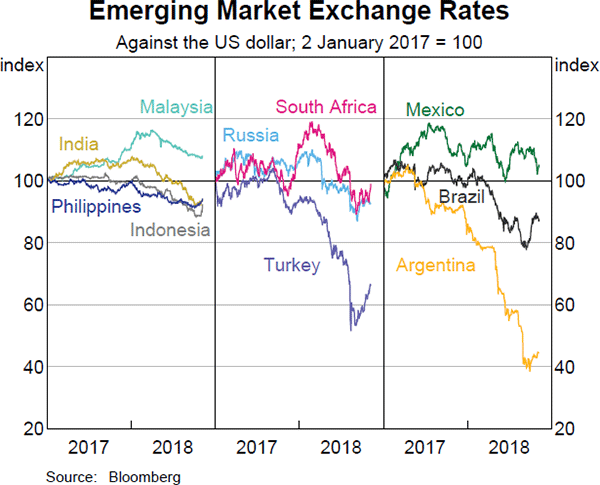
A number of emerging market economies have experienced large exchange rate depreciations and higher funding costs this year (Graph 1.25). This is particularly so for economies with significant fiscal and/or current account financing requirements, significant foreign currency-denominated debts, and/or policy frameworks that are perceived to be weak.
The central banks of Turkey and Argentina have raised their policy rates sharply in recent months, in response to fears that further exchange rate depreciations would lead to an acceleration in (already high) inflation and make servicing foreign currency-denominated debts more difficult. In Argentina, the authorities negotiated a revised agreement with the International Monetary Fund to increase the size and accelerate the disbursement of the financial assistance package in exchange for a larger fiscal tightening next year and other reforms. Thus far, these developments appear to have been well received by financial markets, though asset price and exchange rate volatility remains somewhat elevated.
… but there are no signs yet of significant spillovers to other emerging market economies
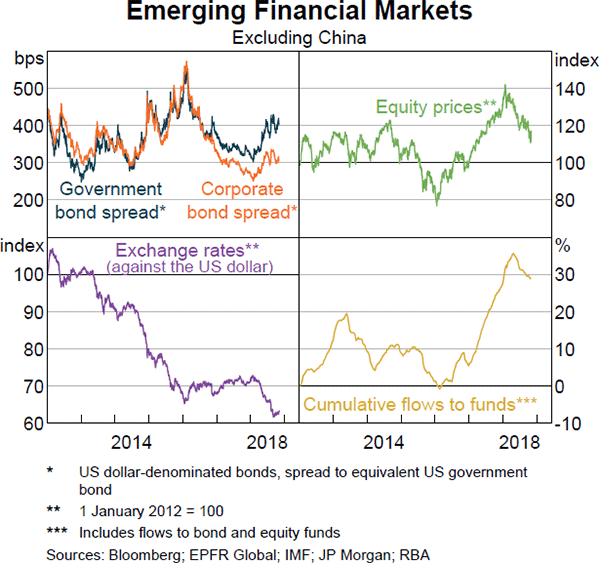
So far, there has been limited evidence of significant spillovers to less vulnerable emerging market economies. Timely proxies of non-resident capital movements suggest that outflows have been more modest than during other episodes of significant capital outflow over the past decade. Recently, emerging market asset prices, currencies and capital movements have shown some signs of stabilisation (Graph 1.26).
The Asian region has remained relatively resilient to the more difficult external financing environment, reflecting generally strong economic conditions and institutional frameworks.[1] Within the region, the currencies of India, Indonesia and the Philippines have depreciated the most this year against the US dollar, possibly reflecting that these are the largest economies in Asia with current account and fiscal deficits. Partly in response, central banks in all three of these economies have recently increased policy rates. The authorities in India and Indonesia have also intervened in currency markets and announced plans to reduce their current account deficits.
Nonetheless, there remains a risk that capital outflows from emerging markets broaden and intensify, prompting a more significant tightening of financial conditions. This might occur, for example, if the Fed were to increase the federal funds rate by more, or more quickly, than currently anticipated, or if key commodity prices were to move unfavourably (for example, higher oil prices for oil importers or lower prices faced by commodity exporters). Were these factors to eventuate, the emerging markets most at risk would include those with larger current account and fiscal deficits, larger foreign currency-denominated debts and less well-anchored inflation expectations. For emerging economies in Asia, a significant increase in trade protectionism and/or a sharp slowdown in Chinese economic growth continue to represent risks to regional economic growth and asset prices.
Bulk commodity prices have risen considerably in recent months
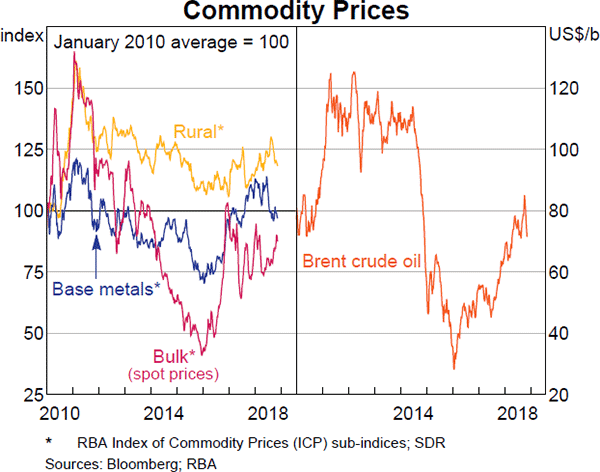
Bulk commodity prices have risen strongly since the previous Statement, while movements in other commodity prices have been mixed. Oil prices are little changed, while base metal and rural prices have declined (Table 1.1; Graph 1.27).
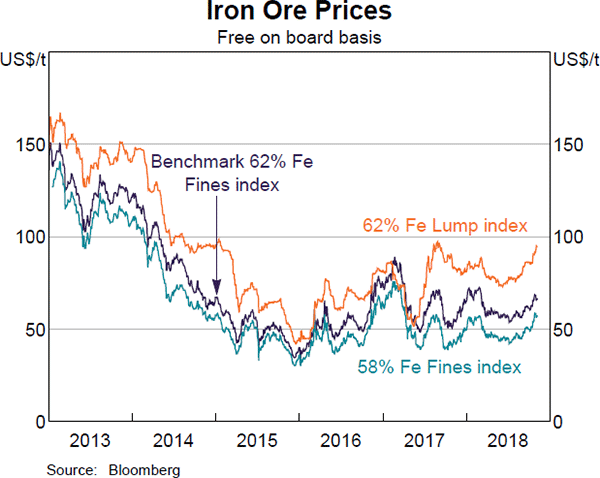
The benchmark iron ore spot price has risen strongly since the previous Statement, supported by ongoing strength in Chinese steel production and market expectations that the Chinese winter production restrictions may not be as severe as last year. The iron ore market has shown pronounced quality-related price differentials over the past year or so, mostly reflecting a shift by Chinese steel producers towards more efficient and less-polluting steel production that demands higher-quality ore (Graph 1.28). Demand for higher quality inputs and recent restrictions on some Chinese iron ore processing have also contributed to higher premiums for lump and pellet ore. Around 40 per cent of Australia's iron ore exports are estimated to be of lower-grade than the benchmark and subject to discounts to the benchmark index, while almost 25 per cent of exports are lump products and receive a premium over the relevant fines index.
| Since previous Statement | Over the past year | |
|---|---|---|
| Bulk commodities | 9 | 18 |
| – Iron ore | 12 | 21 |
| – Coking coal | 22 | 23 |
| – Thermal coal | −13 | 4 |
| Rural | −10 | 4 |
| Base metals | −3 | −12 |
| Gold | 2 | −3 |
| Brent crude oil(b) | 0 | 12 |
| RBA ICP | 3 | 12 |
| – Using spot prices for bulk commodities | 5 | 14 |
|
(a) Prices from the RBA Index of Commodity Prices (ICP); bulk commodity
prices are spot prices Sources: Bloomberg; IHS; RBA |
||
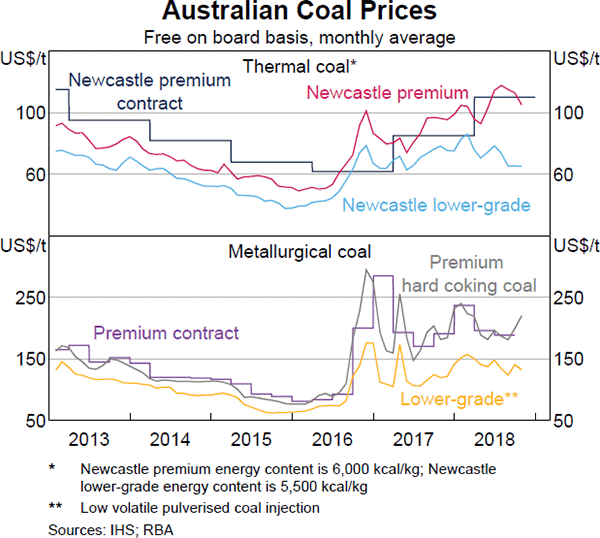
The spot price for premium hard coking coal has also increased strongly since the previous Statement, partly reflecting supply-side disruptions in Australia, as well as robust demand – notably from China and India – for use in steel making (Graph 1.29). With demand and supply in the seaborne coking coal market finely balanced over recent years, supply-side disruptions have tended to have a large impact on spot prices. The spot price of Newcastle premium thermal coal remains elevated reflecting ongoing strength in demand and limited growth in supply.
Oil prices are little changed since the previous Statement. Increased global demand as well as supply disruptions in several oil-producing economies have supported oil prices over recent years. However, prices have eased over recent weeks following expectations of increased supply from some of the major producers, and downward revisions to the global economic outlook by the IMF. Oil prices remain around their highest level since late 2014.
Base metal prices in aggregate have declined modestly since the previous Statement. Prices have fallen by around 15 per cent since June 2018, reflecting concerns around the outlook for global industrial production amid heightened trade tensions. Meanwhile rural prices have declined since the previous Statement led by falls in global wheat and beef prices.
Australian export prices are expected to increase further over coming quarters, before declining gradually as Chinese demand for bulk commodities eases and further low-cost global supply comes on line. Consequently, the terms of trade are expected to remain around their recent high levels before declining further out in the forecast horizon, but will remain above their trough in early 2016 (see ‘Economic Outlook’ chapter).
Footnote
See RBA (2018), ‘Box A: Financial Market Resilience of Emerging Asia’, Statement of Monetary Policy, August, pp 22–24. [1]