International Comparisons of Bank Branches – An Update 2. International Comparisons of Branch Numbers
Submission to the House of Representatives Standing Committee on Financial Institutions
and Public Administration
- Download 199KB
Over the period 1983–1992, the number of bank branches per million inhabitants declined in most developed countries (Graph 1). Australia had the third highest number of bank branches per million inhabitants in 1992, possibly reflecting its low population density.[1]

Data for 1996 confirm that the downward trend in branch penetration continued in most countries, including Australia. Australia remained towards the higher end of the range, notwithstanding a fall from 394 branches per million inhabitants in 1992 to 355 in 1996.
Interestingly, in four countries (Germany, Italy, Sweden and the United States) the number of bank branches per million inhabitants rose. In Germany and Sweden at least, those increases have a straightforward explanation. In both cases, the 1996 figures for the first time include banking facilities in post offices as bank branches, resulting in a sharp increase over 1992 figures. This highlights how different banking structures can make international comparisons difficult. But it also emphasises the need to consider access to banking facilities more broadly than the narrow definition of ‘bank branches’, a theme taken up in Section 2.
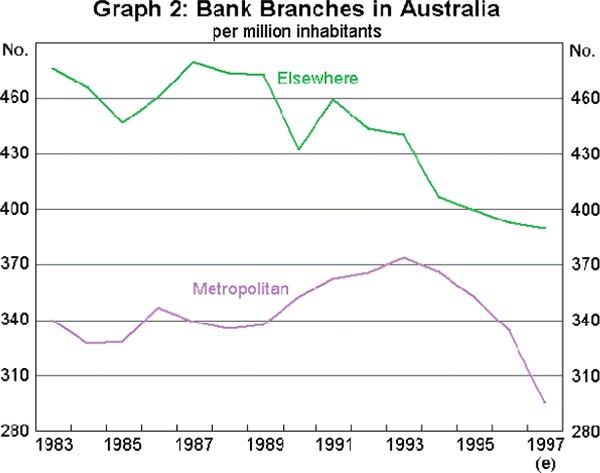
Trends in the distribution of bank branches in Australia are shown in Graph 2, which distinguishes between ‘metropolitan’ areas (capital cities and adjoining suburbs) and ‘non-metropolitan’ areas. These data must be treated with caution. Firstly, branches in many large cities are, by definition, excluded from the metropolitan series; areas such as Geelong, Newcastle and the Gold Coast, for example, are all defined as non-metropolitan. Conclusions on more narrowly defined concept of ‘regional’ branch representation are therefore difficult to draw. Secondly, during the late 1980s and early 1990s a number of building societies converted to banks while in 1991 the Commonwealth Bank of Australia reclassified around 350 agencies as branches. The data are not adjusted for these effects.

That said, branch representation has been consistently higher outside the capital cities over the past fifteen years; however, the number of bank branches per million inhabitants in these areas has been falling steadily. This reflects both falls in the number of branches and a rise in population. In contrast, the ratio of branches to population in capital cities was on a generally upward trend until the last few years, when it dropped noticeably.
Footnote
In 1992, Australia ranked behind Belgium and Switzerland. Due to a change in definitions, comparable data on bank branches are no longer available for Belgium and it has been excluded from this comparison. [1]