RDP 9305: The Unemployment/Vacancy Relationship in Australia 2. Concepts and Existing Literature
June 1993
- Download the Paper 120KB
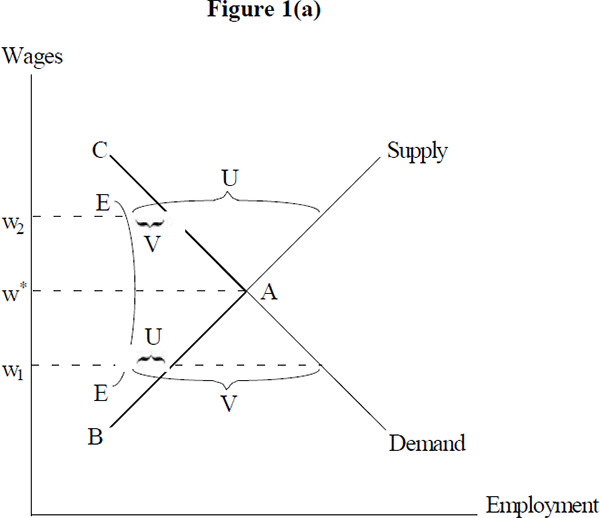
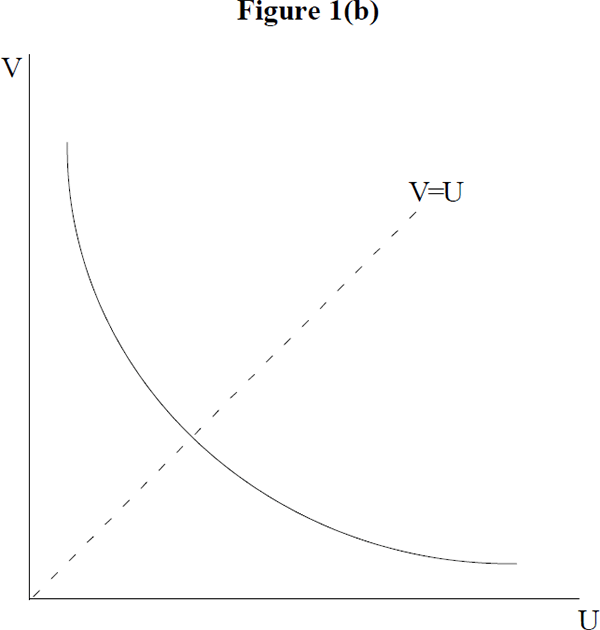
The inverse relationship between the unemployment rate and the vacancy rate was first examined by Dow and Dicks-Mireaux (1958) in their study of labour market conditions in Great Britain. However, it was Hansen (1970) who provided the most widely used justification for the existence of the UV curve. According to Hansen, the convex shape of the Beveridge Curve is caused by the effect that excess supply or excess demand for labour has on the matching of the unemployed to vacancies. Figures 1(a) and 1(b) illustrate his point.


The line segment AC is realised if there is excess supply of labour and the line segment BA is realised if there exists excess demand for labour. The EE curve reflects the fact that vacancies and unemployed workers cannot be perfectly and instantaneously matched, and its shape results from the assumption that the matching becomes better when the pressure of excess demand or excess supply increases. The distance between EE and the labour supply curve represents the number of unemployed, and the distance between EE and the labour demand curve represents the number of vacancies. When w = w* the labour market is in equilibrium, and the number of vacancies is equal to the number of unemployed. The Beveridge Curve is derived by plotting the number of vacancies against the number of unemployed.
This ‘traditional’ approach to the UV curve has been criticised for several reasons. As Bowden (1980) points out, the position of the UV curve will be altered by a shift in either the labour demand or the labour supply schedule. Also, it is not clear that labour market equilibrium occurs only when the vacancy rate equals the unemployment rate.
An alternative derivation of the UV curve considers the flows into and out of unemployment. Following Borsch-Supan (1991), let N be the labour force, u the unemployment rate U/N, v the vacancy rate V/N, s the probability per time unit that an existing labour contract leads to a separation and p the probability per unit of time that an unfilled vacancy is matched with an unemployed worker. Assuming for simplicity that s is fixed and p = p(v/u), p′ = 0, the following flow equilibrium holds:

where 
The Beveridge Curve,
 = 0, is convex to the origin if p″(v / u) > 0.
Bowden (1980) demonstrates that this curve is independent of aggregate demand and
the real wage level. A change in aggregate demand or real wages simply results
in an adjustment to a new equilibrium on the
original
 = 0 curve. The fact that the BC is shown to be independent of the business
cycle makes it possible to distinguish between structural and cyclical unemployment.
Some recent overseas studies have focused on the role of search effectiveness in determining the position of the Beveridge curve. In particular Budd et al. (1988), Jackman et al. (1989) and Layard et al. (1991) have all attributed a large role to the related features of a fall in search intensity and an increase in long-term unemployment to explaining the outward movement in the UV curve for Great Britain. In contrast, Blanchard and Diamond (1989) find little evidence of long-term unemployment affecting the UV relationship in the United States.
Australian studies have typically concentrated on a large apparent outwards shift in the UV curve in the early 1970s. Hughes (1975), Gruen (1978) and Harper (1980) all find evidence of an outwards shift in the UV curve sometime between 1972 and 1974. Both Hughes and Harper conclude the sharp fall in migration in the early seventies contributed to the outward shift in the curve. Hughes does not consider that the increases in the real level of unemployment benefits has made a contribution, while Harper finds evidence that it has. Withers and Pope (1985) re-estimate the Harper model using a different formulation of the migration variable. They confirm Harper's findings with respect to the level of real unemployment benefits, but find that migration has not played a role in shifting the UV curve.

There has been no rigorous examination of the Australian UV relationship for the 1980s. From a visual inspection of a UV scatterplot Chapman (1990) concludes that there has been no obvious and large outward movement in Australia's UV curve over the latter part of the 1980's.