RDP 2016-08: The Slowdown in US Productivity Growth: Breaks and Beliefs 1. Introduction
October 2016
- Download the Paper 1.59MB
In many advanced economies, the pace of recovery from the Great Recession has been unexpectedly slow. The United States has performed better than some other economies in this regard. But even so, the level of GDP remains well below what an extrapolation of its pre-recession trend would imply.[1]
While a temporary contraction in economic activity can plausibly be attributed to factors affecting the demand side of an economy, a prolonged slowdown in growth lends itself to a supply-side explanation. Indeed, a growing literature argues that the long-run, or steady-state, rate of total factor productivity (TFP) growth in the United States is lower now than it was in the past (Gordon 2012; Fernald 2014; Reifschneider et al 2015).[2] Visual inspection of Figure 1, which shows the level and growth rate of US TFP over recent decades, appears to support this conjecture.
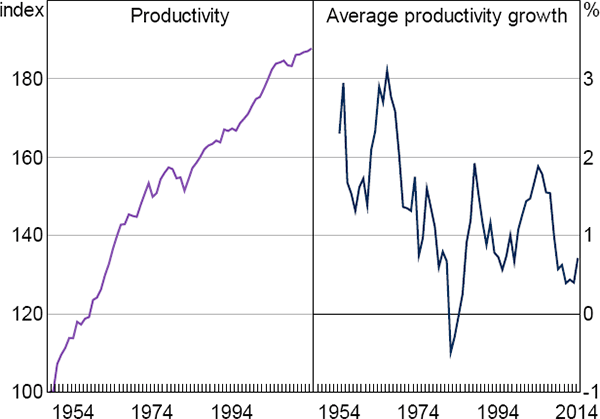
Notes: Left panel shows the log of total factor productivity, normalised to equal 100 in 1948; right panel shows a six-year moving average of annual productivity growth
Sources: Authors' calculations; Bureau of Labor Statistics; Federal Reserve Bank of St. Louis
A downward shift in steady-state US productivity growth matters for several reasons. For US residents, slower productivity growth ultimately means less improvement in living standards. As the United States is responsible for a large part of the world's technological innovation, in as much as US firms operate at the production possibility frontier in many industries, a prolonged slowdown in US productivity growth may limit opportunities for growth in living standards in other countries as well. Slower productivity growth also has implications for monetary policy. In particular, it lowers the neutral real interest rate. For a given inflation target, this implies a lower neutral nominal interest rate. If productivity growth is lower, the zero lower bound on nominal interest rates will bind more frequently.
Yet while much of the recent literature has focused on the possibility of a slowdown in productivity growth, barely a decade ago there was an active debate about whether the arrival of the ‘new economy’, associated with rapid advances in information technology and its diffusion across the economy, marked the start of an era of permanently higher productivity growth (Gordon 2000; Greenspan 2000; Cogley 2005; Kahn and Rich 2007). That such different interpretations of long-run productivity growth can be considered plausible in a short space of time indicates that steady-state productivity growth varies frequently, is difficult to identify in real time, or both.
In light of this, in this paper we explore the timing and size of breaks in US steady-state productivity growth using a business cycle model. A novel feature of our approach is that it allows agents' beliefs about long-run TFP growth to differ from reality. We estimate the model allowing for, but not requiring, breaks in steady-state productivity growth. In the model, shifts in steady-state productivity growth cause predictable changes in economic behaviour. Because agents in the model are forward looking, these changes depend on agents' expectations about productivity growth in the future as well as actual productivity outcomes in the present and the past. In estimation, we infer breaks in steady-state productivity growth, and the beliefs of households and firms about those breaks, from the behaviour of the model's observable variables.
We identify a single break in US productivity growth, most likely occuring in the early 1970s, that roughly halved steady-state growth from 0.6 per cent to 0.3 per cent at a quarterly rate. Relative to the quarter-to-quarter volatility in macroeconomic data, a 0.3 percentage point change in productivity growth might seem inconsequential. But, cumulated over time, even small changes in productivity growth have large consequences. We estimate that per capita consumption and output in the United States would both be around 45 per cent higher today if steady-state productivity growth had not slowed. We also find that the federal funds rate would have been 1 percentage point higher in the mid 2000s and that monetary policy would not have been constrained by the zero lower bound until late 2010.
Our results also indicate that the slowdown in productivity growth was hard to detect in real time. Indeed, the behaviour of households and firms suggests that their beliefs about future productivity growth did not incorporate the slowdown for up to three decades. Because of this delay, the initial responses of output, consumption and investment to the break in productivity growth were smaller than they would have been if agents had observed the break when it occurred. Instead, much of the adjustment occurred after beliefs about steady-state productivity growth shifted down, sometime in the 2000s. This discrepancy between the timing of the break in productivity growth and the time when agents' beliefs about future productivity growth adjusted is a key difference between our results and the recent literature which has identified a downward shift in steady-state productivity growth in the 2000s.
Across a range of specifications we find no evidence of a pick-up in steady-state productivity growth in the 1990s. The productivity growth performance of the United States in this era was extremely strong. But our results indicate that it represented a temporary transition to a higher level of productivity rather than a shift in the steady state of TFP growth. Our results are also robust to a range of other modelling specifications, including allowing for multiple breaks in steady-state growth and for changes in the variance of shocks to productivity growth.
1.1 Relationship to Previous Literature
Our paper builds upon the large body of work that tests for changes in steady-state US productivity growth. One branch of the literature has looked for breaks using univariate statistical models. Early work in this genre tended to find a decline in steady-state productivity growth of around 0.25 percentage points at some point between the late 1960s and mid 1970s (e.g. Dolmas, Raj and Slottje 1999; Benati 2007; Perron and Wada 2009). More recently, with longer samples of data that include the recession of 2007–09, Fernald (2014) and Luo and Startz (2014) identify a larger slowdown in steady-state productivity growth, of 0.4 percentage points, occurring around 2006.
Other authors have adopted a multivariate approach. For instance, Cogley (2005) and Kahn and Rich (2007) use information from consumption and wages, which economic theory predicts will be cointegrated with output, to identify permanent shifts in productivity growth. Both papers conclude that steady-state productivity growth increased in the late 1990s. However, subsequent updates of the Kahn and Rich model suggest that the US economy reverted to a low productivity growth regime in 2005.
Our key contribution to the literature is to explore the timing and size of breaks in US productivity growth through the lens of a business cycle model. Model-based estimates have three advantages over single equation or statistical inferences. First, they use a much broader information set. Changes in productivity growth have implications for many macroeconomic variables. Including these variables in estimation can help to identify the timing and size of breaks in productivity growth. Second, using a structural model allows us to distinguish between shifts in steady-state productivity growth and changes in agents' beliefs about productivity growth. We demonstrate that the response of the economy to changes in steady-state productivity growth depends on whether or not agents' beliefs adjust in real time. Because of this, failing to account for agents' expectations could lead to incorrect inference. Third, by using a structural model, we are able to spell out the implications of slower productivity growth for other macroeconomic variables. In particular, our results shed light on how slower steady-state productivity growth could affect the conduct of monetary policy.
Our work also relates to the growing literature on ‘secular stagnation’, both as a supply-side and demand-side phenomenon.[3] On the supply side, Gordon (2012, 2015) documents a range of demographic, educational, environmental and social factors that he argues will cause US productivity to grow only half as fast in the future as it did on average over the past 150 years. Our results support Gordon's conjecture. In particular, we provide quantitative evidence of a large slowdown in steady-state US productivity growth.
Our results also help to reconcile Gordon's supply-side concept of secular stagnation with that of Summers (2014, 2015), who also raises the prospect of a sustained decline in US economic growth, but identifies demand-side factors as the cause. A key element of Summers' argument is that, since at least the late 1990s, the US economy has failed to achieve strong growth in real economic activity and financial stability simultaneously. This failure could occur in an environment in which agents' expectations about future income growth, which is a key determinant of asset prices, are too optimistic (e.g. Hoffmann, Krause and Laubach 2012). This is precisely the mechanism that we uncover in our paper – steady-state productivity growth fell long before beliefs about future productivity growth adjusted.
The rest of the paper is organised as follows. Section 2 provides details of the theoretical model and illustrates its response to structural breaks in steady-state productivity growth. Section 3 describes the estimation approach. Section 4 presents results and highlights features of the data that influence the estimated timing of breaks in productivity growth. Section 5 discusses some of the implications of our results for the US economy. Section 6 shows the robustness of the estimation results to alternative model specifications. And Section 7 concludes.
Footnotes
For example, see Graph 1 of Reifschneider, Wascher and Wilcox (2015). [1]
In most economic models, TFP growth is the only source of long-run growth in output per capita. [2]
This demand-side explanation appears closer in spirit to the original description of secular stagnation by Hansen (1939), although more recently the term has come to refer to both demand-side and supply-side explanations for slower growth. [3]