Statement on Monetary Policy – February 2006 Balance of Payments
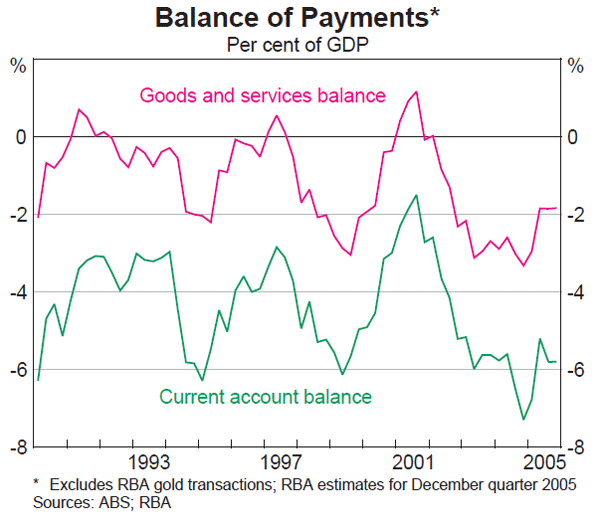
Australia's trade deficit narrowed in 2005 reflecting the run-up in commodity prices, most notably the significant increases in contract prices for coal and iron ore that helped push the level of the terms of trade to a 30-year high. However, the trade deficit (at around 2 per cent of GDP) and current account deficit (at around 6 per cent of GDP) both remain large by historical standards (Graph 40). While export prices have increased sharply, growth in the volume of Australia's exports has remained lacklustre, with average annual growth over the past five years of only around 1½ per cent. Import volumes have continued to expand more rapidly, although growth moderated during 2005 in line with the easing in the pace of domestic spending.
Exports
Export earnings increased by around 18 per cent over the year to the December quarter of 2005, mostly reflecting higher export prices (Graph 41). The strongest growth came from resources, where export values increased by over 40 per cent, driven by sharply higher prices for iron ore, coal and base metals. Resource export volumes are estimated to have risen by around 7 per cent over the year, reflecting growth in many components (notably iron ore, alumina and aluminium), although coal exports were somewhat restrained by temporary disruptions in the second half of 2005. Further increases in resource exports appear likely, with several new mining projects due to come on-line in the first half of 2006 (particularly for coal) and transport infrastructure constraints easing somewhat, although there are likely to be declines in production from some existing operations, especially for gold and oil.
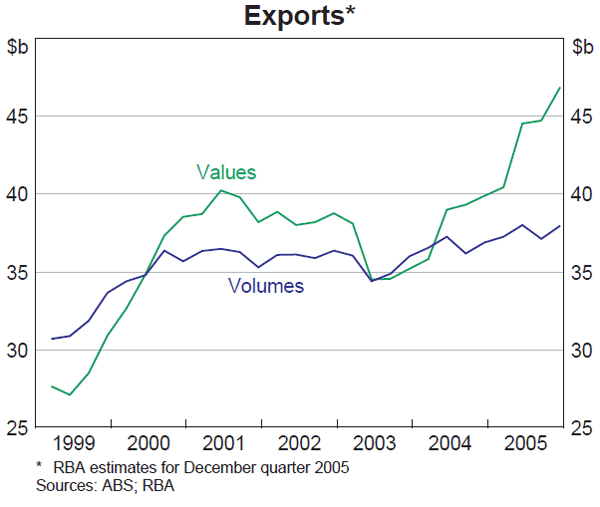
Earnings from manufactured goods exports increased by around 8 per cent over 2005, with volumes estimated to have grown more strongly than overall exports, albeit at a rate well below that seen during the 1990s. Nonetheless, recent business surveys report a pessimistic outlook for manufactured exports, and the Bank's liaison with Australian manufacturers reports that producers are finding it difficult to compete with developing economies in Asia.
In contrast to the other goods categories, rural export earnings declined over 2005, falling by about 3 per cent due largely to a fall in cereals export volumes. However, the outlook for cereals exports is positive given the above-average crop harvested in late 2005 and the improved prospects for the summer crop following the widespread rainfalls in the second half of the year. Wool exports have continued to trend lower, in part reflecting farmers substituting towards meat production to take advantage of high prices, particularly for lamb. The outlook for livestock-based exports is mixed, although the reimposition of bans on US beef sales into Japan should support demand for Australian beef. Overall, although rural export volumes appear to have fallen in the second half of 2005, the Australian Bureau of Agricultural and Resource Economics (ABARE) forecasts a modest rise in total rural exports in 2005/06.
Services export earnings increased by around 1 per cent over 2005, while volumes have continued to track sideways at around their 2001 levels. Growth in travel and transportation services exports, which account for over two-thirds of total services exports, has been subdued despite a sizeable increase in short-term visitor arrivals over recent years. This reflects a decline in average visitor expenditure, in part resulting from changes in the mix of visitors to Australia.
Imports
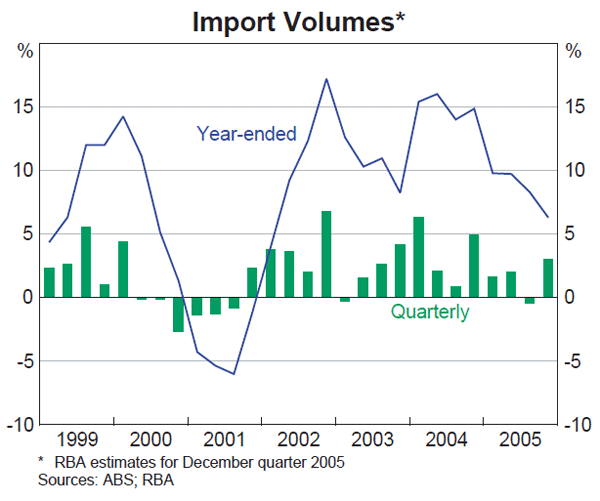
Growth in import volumes eased in 2005, due to the more moderate expansion in domestic spending and the waning of the adverse effect on competitiveness from the appreciation of the exchange rate seen over 2002 and 2003. The annual pace of import growth is estimated to have slowed to around 6 per cent over the year to the December quarter, down from the particularly rapid 15 per cent rate recorded over 2004 (Graph 42). All categories of imports have shown signs of easing, although growth in capital imports remains relatively strong, consistent with the strength in business investment.
Net income
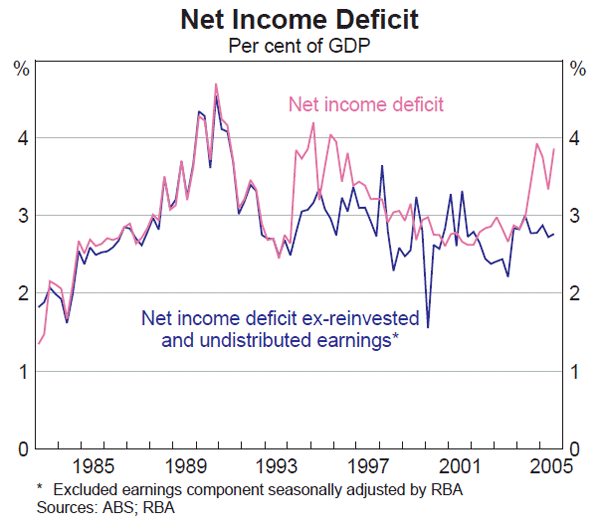
After narrowing over the first two quarters of 2005, the net income deficit (NID) increased sharply in the September quarter to $9 billion or 3.9 per cent of GDP (Graph 43). This largely reflected an increase in equity returns on foreign direct investment in Australia, in line with the strong profit growth in the resource sector. As has been the case for the past year, a significant proportion of these equity earnings were reinvested within the Australian-based companies and did not result in actual payment outflows. Excluding such reinvested earnings, the NID has been broadly unchanged for the past two years, at just below 3 per cent of GDP.
Commodity prices and the terms of trade
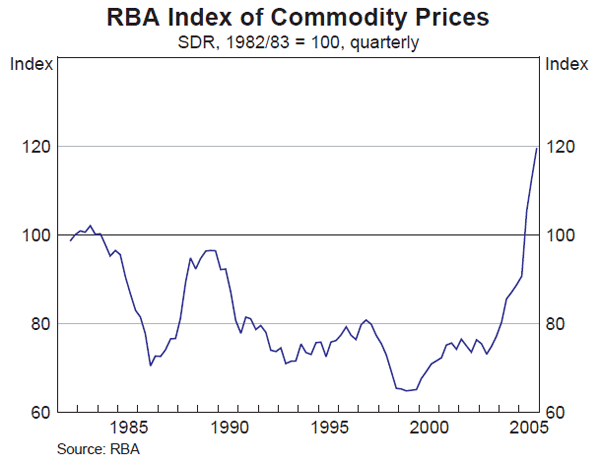
The prices of Australia's commodity exports have continued to move higher, buoyed by the ongoing upswing in the global economy. The RBA index of commodity prices (ICP) increased by 5.9 per cent over the three months to January, and has risen by almost 40 per cent over the past year (Table 9). The ICP is now at its highest level in nominal terms since 1982, the first year for which the index is available (Graph 44). The lift in prices over the past three months has been broadly based across commodity groups, with the pick-up in base metals prices particularly marked. In Australian dollar terms, the ICP rose by 6.6 per cent over the three months to January, and was up by 34 per cent over the year.
| Three months to January 2006 |
Year to January 2006 |
|
|---|---|---|
| RBA Index | 5.9 | 38.6 |
| Rural | 4.2 | 10.7 |
| – Wheat | −1.5 | 10.6 |
| – Beef & veal | 3.0 | −2.1 |
| – Wool | −1.5 | −8.0 |
| Base metals | 22.1 | 37.2 |
| – Aluminium | 23.0 | 36.3 |
| – Copper | 16.7 | 57.5 |
| – Nickel | 17.4 | 5.7 |
| Other resources | 2.3 | 52.4 |
| – Coking coal(a) | 5.5 | 104.0 |
| – Steaming coal(a) | 2.4 | 21.4 |
| – Iron ore(a) | 0.0 | 76.3 |
| – Gold | 17.1 | 36.9 |
| Memo item: | ||
| Oil in US$(b) | 4.6 | 39.1 |
|
(a) Latest available data are for December. Sources: ABS; AWB; AWEX; Bloomberg; Meat and Livestock Australia; RBA |
||
The base metals sub-index surged by 22 per cent over the past three months, reflecting sizeable price gains across all base metals, to reach its highest level since 1988. Base metals prices have doubled since mid 2003, boosted by strong demand from China and other emerging economies, supply disruptions and resulting low inventory levels. Growth in zinc prices was particularly strong over the three months to January, at more than 40 per cent. The price of copper rose further to reach a new record high (in nominal terms), partly reflecting a series of supply disruptions. The price of gold has also risen, reflecting both speculative activity and increased portfolio allocations to commodities, in addition to weak growth in global production.
Rural commodity prices rose by 4.3 per cent over the past three months, buoyed by higher prices for beef & veal and sugar. The price of beef has been supported by a pick-up in Japanese demand towards the end of last year, while good rainfall in Australia in the second half of 2005 has prompted herd rebuilding and restrained supply. The price of sugar has continued to rise strongly as sugar cane is increasingly devoted to ethanol production, while the EU's decision to curtail sugar subsidies has also boosted prices.
Looking ahead, contract price negotiations for coal and iron ore exports in 2006/07 have commenced. Early contract price settlements suggest that average coal contract prices will ease somewhat relative to 2005/06 prices, in line with softer spot prices for most types of coal. However, with the global market for iron ore tight, it appears likely that there will be further increases in iron ore contract prices following the 70 per cent jump seen in early 2005.
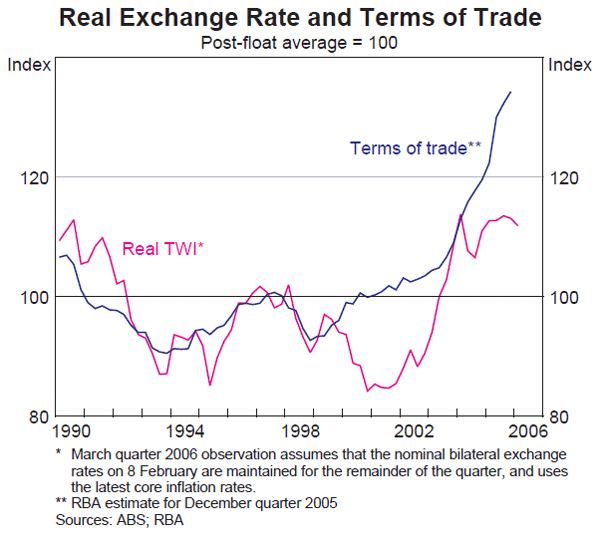
Broad-based rises in commodity prices, coupled with relatively modest growth in import prices, are estimated to have boosted the terms of trade in the December quarter, following a 1.8 per cent increase in the September quarter. The annual increase is estimated at around 12 per cent, taking the overall terms of trade to a level last seen in the commodity boom of 1974.
Real exchange rate
In real trade-weighted terms, the Australian dollar has been broadly steady over the past year, although it is still 12 per cent above its post-float average (Graph 45). At this level, the exchange rate is restraining activity in some trade-exposed sectors, particularly in the manufacturing sector. However, for the economy as a whole, the benefits from the increased terms of trade are likely to have more than offset the adverse effects of the high exchange rate.
