Statement on Monetary Policy – February 2006 Inflation Trends and Prospects
Recent developments in inflation
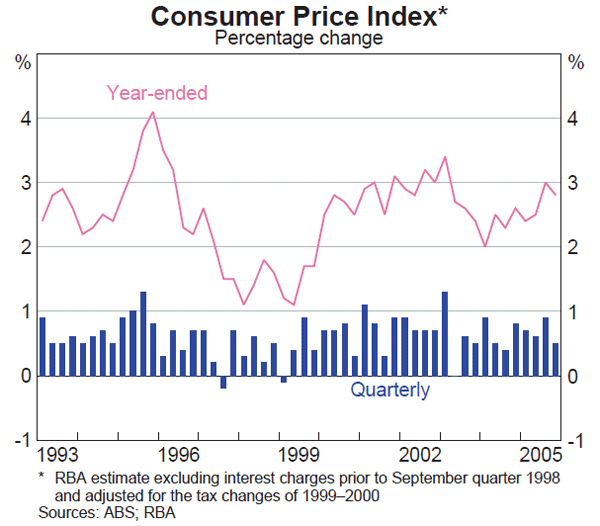
The Consumer Price Index (CPI) rose by 0.5 per cent in the December quarter, to be 2.8 per cent higher over the year (Graph 63, Table 12). The annual rate has recently been boosted by petrol prices, which were up by around 15 per cent over the year. Based on a range of measures, including statistical measures which downweight (but do not exclude) the impact of large rises and falls in particular items, the Bank's assessment is that underlying inflation was around 2½ per cent over the year to the December quarter.
| Quarterly | Year-ended | ||||
|---|---|---|---|---|---|
| September quarter 2005 |
December quarter 2005 |
September quarter 2005 |
December quarter 2005 |
||
| CPI | 0.9 | 0.5 | 3.0 | 2.8 | |
| – Tradables | 1.2 | 0.0 | 2.6 | 2.0 | |
| – Tradables (ex food and petrol) | 0.1 | −0.5 | 0.2 | −0.3 | |
| – Non-tradables | 0.8 | 0.8 | 3.4 | 3.5 | |
| Underlying measures | |||||
| Weighted median(a) | 0.6 | 0.7 | 2.5 | 2.6 | |
| Trimmed mean(a) | 0.6 | 0.5 | 2.6 | 2.3 | |
| CPI ex volatiles(a) | 0.6 | 0.4 | 2.4 | 2.3 | |
|
(a) Based on the distribution of seasonally adjusted quarterly price changes. Sources: ABS; RBA |
|||||
Increases in the prices of food and deposit & loan facilities made the most significant contributions to CPI inflation in the December quarter, while falls in the prices of audio, visual & computing equipment, pharmaceuticals and motor vehicles partly offset these rises. In contrast to previous quarterly outcomes, there was little direct effect from petrol prices in the December quarter.
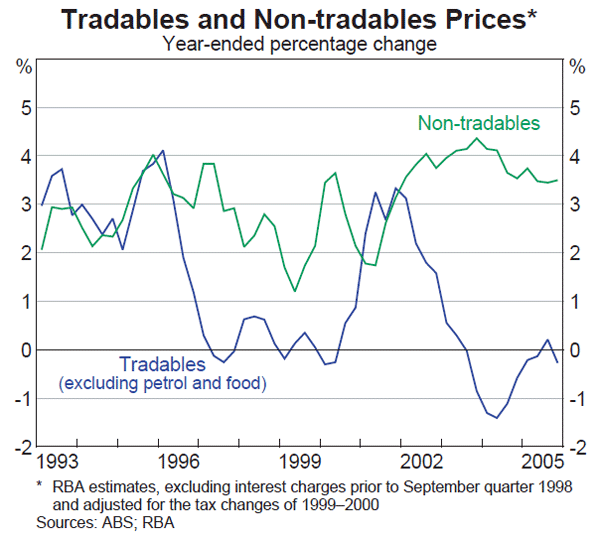
Inflation continues to be driven by the non-tradables component of the CPI (Graph 64). Non-tradables prices rose by 0.8 per cent in the quarter and, in year-ended terms, inflation in non-tradables prices remained around 3½ per cent.
Producer prices
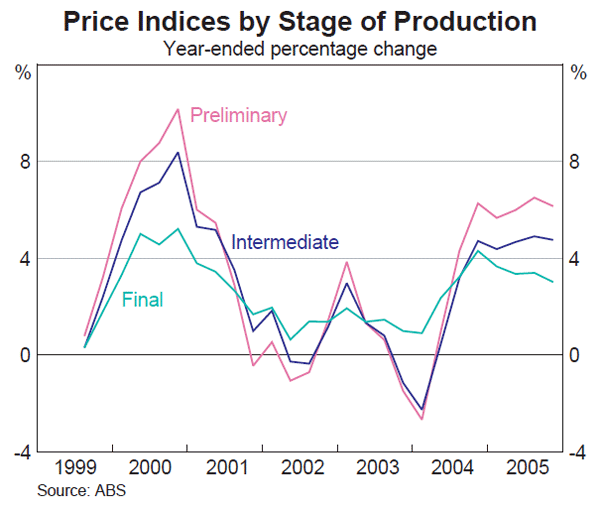
Producer price data suggest that upstream inflation pressures remained firm and fairly widespread over the year to the December quarter (Graph 65, Table 13). Although rates of price growth at all stages of production were lower than those recorded in the September quarter, they were still relatively strong.
| December quarter 2005 |
Year to December quarter 2005 |
|
|---|---|---|
| Preliminary | 1.1 | 6.2 |
| – Domestically produced | 1.1 | 5.5 |
| – Imported | 1.4 | 10.3 |
| – Excluding oil | 1.1 | 4.3 |
| Intermediate | 1.0 | 4.8 |
| – Domestically produced | 1.0 | 4.5 |
| – Imported | 1.1 | 6.0 |
| – Excluding oil | 1.0 | 3.6 |
| Final(a) | 0.8 | 3.0 |
| – Domestically produced | 0.9 | 3.8 |
| – Imported | 0.1 | −1.1 |
| – Excluding oil | 0.9 | 2.6 |
|
(a) Excluding exports Source: ABS |
||
By industry, building construction costs continued to make the largest contribution to the quarterly rise in prices at the final stage of production, followed by various food and agricultural products. Strong raw materials prices, reflecting healthy world demand, made the largest contribution to growth at the preliminary and intermediate stages of production. Property and business services also contributed significantly to producer prices at these stages. As with the CPI, oil prices have boosted the annual rate of producer price inflation, although there was little effect from oil prices in the December quarter.
Labour costs
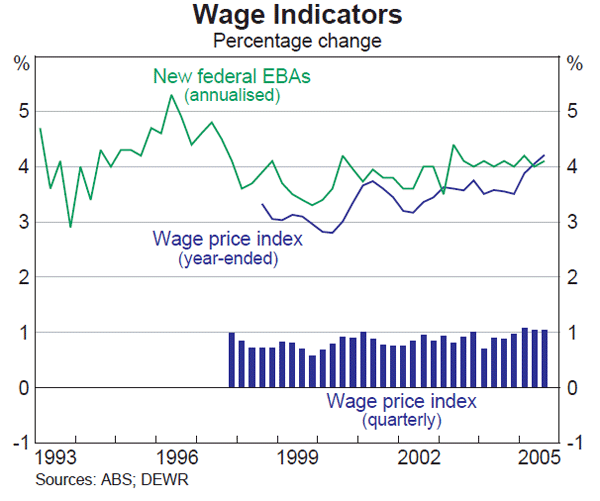
Recent data show that wages are continuing to grow at a rate above the average of recent years, which is consistent with other indications of tight labour market conditions and shortages of suitable labour. However, the recent information does not suggest any acceleration from the rate of wages growth recorded in the first half of 2005. The wage price index (WPI) grew by 1.0 per cent in the September quarter, broadly similar to the pace seen in the two previous quarters, to be 4.2 per cent higher over the year (Graph 66). The average annualised wage increase (AAWI) for federal enterprise agreements certified in the September quarter rose to 4.1 per cent from 4.0 per cent in the June quarter. Measures of average earnings are much more volatile, but on balance these also suggest that wage pressures remain strong (see ‘Box D: Measures of Labour Costs’ for discussion of these measures and their interpretation).
More recently, the NAB survey suggests that growth in actual labour costs in the December quarter was broadly similar to its September quarter pace. While liaison indicates that wage pressures are most pronounced in industries facing strong demand, such as non-residential construction and mining, they are becoming more broadly based. Employees in a growing number of occupations have been granted wage rises to maintain relativities, for example, to match increases granted to similar workers in other states.
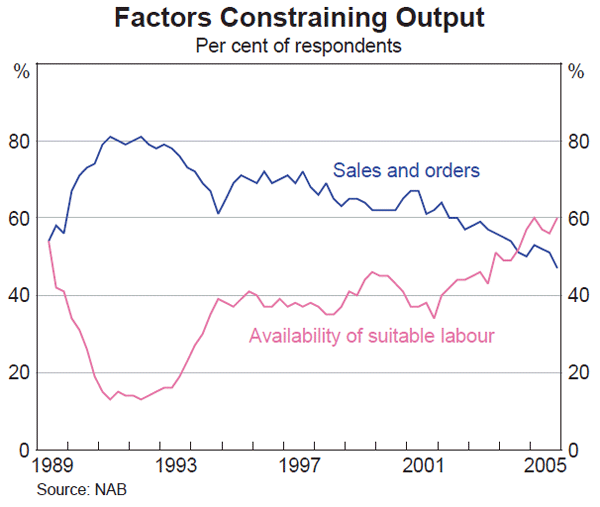
Although there has been some easing in the ABS measure of vacancies, labour market conditions remain relatively tight. According to the NAB survey, firms reported that the difficulty in finding suitable labour increased in the December quarter, to be close to its recent peak. The survey reports that labour scarcity has for the past year been a greater constraint on business activity than the more traditional concerns about lack of demand (Graph 67). The Bank's liaison program has indicated that firms are using a variety of strategies to attract and retain employees, many of which add to labour costs. These include increased frequency of salary reviews and promotion, as well as enhanced non-wage remuneration (such as bonus payments and leave provisions) that is not recorded in some of the standard wage measures.
Inflation expectations
Business surveys suggest that both near-term inflationary pressures and expectations of future price growth remain contained. According to the ACCI-Westpac survey, the net balance of manufacturing firms expecting to raise their prices picked up a little in the December quarter. The Dun & Bradstreet survey reported a similar small rise, with the net balance marginally above its long-run average. The NAB survey measure of expected inflation in final product prices has been broadly steady in recent quarters.
Forecasts of market economists, surveyed by the Bank following the release of the December quarter CPI, show that they expect headline inflation to remain around recent levels through 2006, before declining modestly in 2007. The median expectation for inflation over the year to December 2006 was slightly higher than the previous survey, at 2.8 per cent, while the median expectation for the year to December 2007 was for a decline to 2.6 per cent (Table 14). Union officials expect inflation to be 3.0 per cent for the year to December quarter 2006 and to remain at this level over 2007.
| Year to December 2006 | Year to December 2007 | ||||
|---|---|---|---|---|---|
| August 2005 |
November 2005 |
February 2006 |
February 2006 |
||
| Market economists(a) | 2.6 | 2.6 | 2.8 | 2.6 | |
| Union officials(b) | 3.0 | 3.5 | 3.0 | 3.0 | |
| (a) RBA survey (b) ACIRRT survey |
|||||
The median inflation expectation of consumers, as reported in the Melbourne Institute survey, was 5.0 per cent in February. While this is slightly below its peak in the second half of 2005, it is somewhat above its long-run average. The implied medium-term inflation expectations of financial market participants, which are calculated as the difference between nominal and indexed bond yields, have also edged higher since the previous Statement, to around 3 per cent in early February. However, it appears that this in part reflects tight supply, as well as increasing demand for indexed bonds that is unrelated to expectations about inflation (see the chapter on ‘Domestic Financial Markets and Conditions’).
Inflation outlook
Based on the December quarter CPI data, underlying inflation appears to have remained fairly constant through 2005, as opposed to earlier expectations that it would gradually increase. It appears that the combination of the slowing in domestic demand and greater pricing discipline from international competition have so far reduced or offset the pass-through of higher unit labour costs into CPI inflation. Furthermore, although the rise in oil prices has resulted in price increases and surcharges for some specific goods and services, it has not so far fed through into more generalised inflation. This recent experience has been mirrored in some other countries. Despite the pick-up in prices of oil and other commodities, core inflation rates have remained well-behaved in most industrial countries.
It remains to be seen if the benign recent outcomes will continue or whether the impact of cost pressures on inflation has merely been delayed. For the moment, the Bank continues to expect underlying inflation to pick up modestly over the coming year, though not by as much as was earlier forecast. The forecast for inflation is based on the assumption that oil prices remain around recent levels of US$65 per barrel. It envisages GDP growth of 3 per cent or a little more over the forecast period and a slowing in the growth of domestic expenditure towards that of production. Underlying inflation is expected to remain in the 2½–3 per cent range over the forecast period, with our central forecast being that underlying inflation will increase to 2¾ per cent in the second half of 2006 and remain around this level through 2007. Headline CPI inflation is expected to remain at around 3 per cent for the next few quarters, and then to converge with underlying inflation from around the end of 2006.
The forecast pick-up in underlying inflation largely reflects our forecast for the profile of growth in wages and unit labour costs. Survey data and liaison continue to indicate firm labour demand and pervasive shortages of skilled labour. Accordingly, the current strength in wage growth is expected to persist for some time and is forecast to feed through into consumer prices to a greater extent than has been seen recently. However, the central forecast incorporates an expectation that any additional pressures from labour costs on consumer price inflation will be quite modest, based largely on indications that profit margins remain healthy, which should permit firms to continue to absorb some additional labour cost pressures during the forecast period. But if demand were to be stronger than envisaged, it is likely that there would be less margin compression and stronger inflation than in the central forecast.
Increases in the prices of administered items such as health, education and utilities are likely to continue to contribute significantly to domestic inflation. By contrast, the forecasts do not include any significant indirect effects from higher fuel prices, nor any additional increases in world oil prices. As discussed in the previous Statement, the effects of oil prices on inflation do not appear to be as pronounced as they were in the past. In addition, any effects from oil prices are being offset by another international factor, namely the higher degree of international competition, most notably from China and other emerging economies. The integration of low-cost producers into the world economy seems to have a long way to run, and this is likely to continue to help contain domestic inflation.