Statement on Monetary Policy – February 2006 Domestic Financial Markets and Conditions
Interest rates and equity prices
Money and bond yields
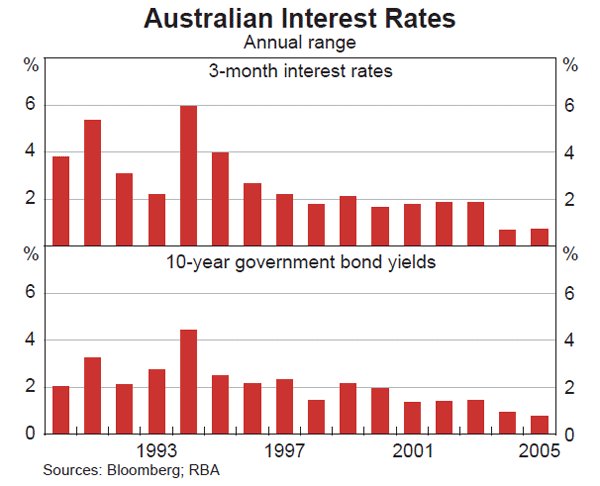
Domestic interest rates have moved in a narrow range over the past 12 months or so. This reflects the relatively stable conditions that have characterised global interest rate markets during this period and, since early to mid 2005, market expectations that the Bank was unlikely to change the target cash rate in the near term. The range of movement in interest rates in 2005, at less than 1 percentage point for both short-term and long-term rates, was well below the averages for the past 15 years (Graph 46).
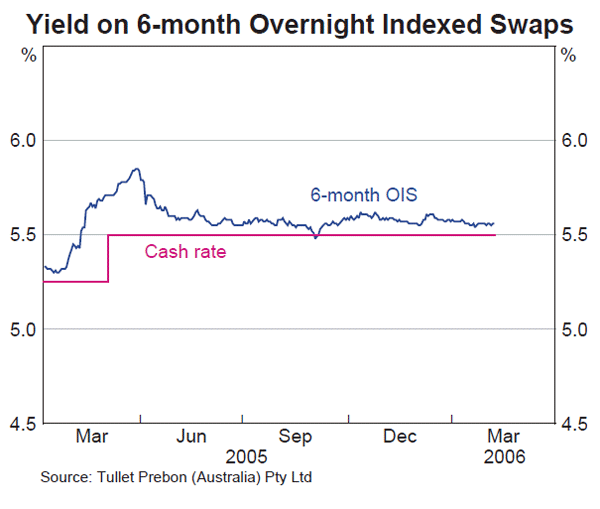
Since the monetary tightening in March 2005, the cash rate has been held steady at 5.5 per cent, a level in line with the average rate over the past decade. Short-term market yields rose a little further following the tightening in March as investors looked for successive policy moves (Graph 47). But once these expectations were not realised, yields settled into a relatively narrow range, typically just above the cash rate target, suggesting that the market has seen little chance of a further rate rise. The only significant departure from this pattern came in August when there was a temporary dip in line with the sharp fall in US short-term yields associated with the Gulf of Mexico hurricanes.
As noted above, the fluctuation in long-term interest rates over the past year or so has also been relatively small by historical standards. Bond yields rose in early 2005 and again in the second half of the year, on fears of a re-emergence of global inflation, but each of these proved transitory. Ten-year bond yields touched a high of 5.8 per cent in March 2005 and a low of 5.0 per cent in September but, at 5.3 per cent, are just a little lower than at the beginning of 2005.
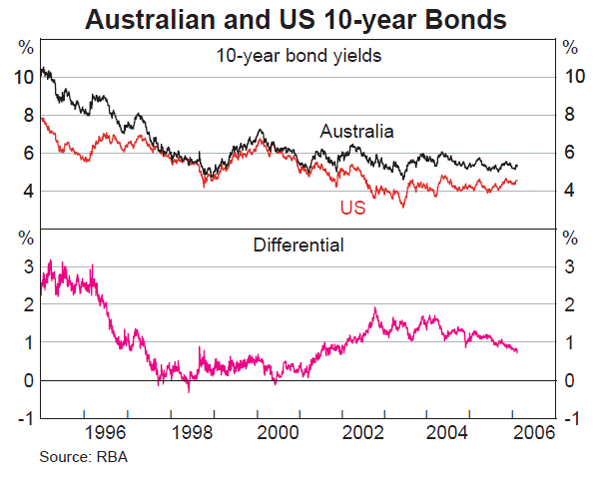
For some years now, daily movements in Australian bond yields have been highly correlated with movements in US yields. That said, the small net fall in local bond yields over the past year or so has occurred against a background of a small net rise in US yields. In part, this reflected market expectations of some moderation in domestic growth. More importantly, however, it reflected the ongoing search for yield, with demand for higher-yielding Australian assets from overseas investors an important factor, especially during recent months. As a result, the spread between Australian and US 10-year yields has narrowed to around 75 basis points, its lowest level for four years (Graph 48).
With short-term yields having risen in early 2005, and long-term yields tending to move lower from around that time, the domestic yield curve has been inverted for most of the subsequent period. Yields on all Commonwealth government securities are currently below the cash rate, with those on 10-year bonds some 20 basis points lower. An inverted yield curve normally arises when monetary policy is thought to be close to the end of a tightening cycle, as it implies future short-term interest rates are expected to be lower than current rates. But the excess of global savings in search for returns has pushed bond yields to exceptionally low levels around the world. As a result, it is difficult to infer market expectations for the stance of monetary policy from the current shape of the yield curve.
It should also be noted that the domestic yield curve, as measured by the spread between the cash rate and 10-year bond yields, has been negative on several occasions since the early 1990s without there having been a significant slowdown in the economy.
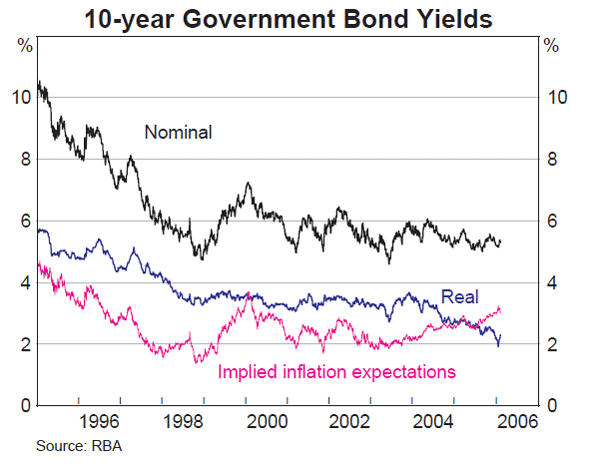
One development of particular note over the past year or so has been the fall in yields on inflation-indexed bonds. Yields on 10-year indexed bonds fell by 85 basis points from the beginning of 2005 to mid January 2006. This took them below 2 per cent, by far the lowest level since their introduction in the mid 80s and, as a result, the spread between 10-year nominal and real yields widened to 3.2 per cent, compared with around 2.7 per cent in the first half of 2005 (Graph 49). While this spread is usually seen as a measure of expected inflation, its recent increase is at odds with other measures of inflation expectations and reflected special factors, unrelated to inflationary pressures. As noted in the earlier chapter on international markets, regulatory changes abroad have encouraged life insurers and superannuation funds to acquire long-dated bonds as an asset class that better matches their liabilities. Other investors, such as hedge funds, are said to have recognised that this process is likely to continue for some time and have added to demand. These developments, against a background of a small, tightly-held domestic supply of indexed bonds, have seen their prices rise (yields fall) significantly. As a consequence, and despite having fallen a little in February, the current spread between yields on nominal and indexed government bonds overstates the market's expectations of inflation.
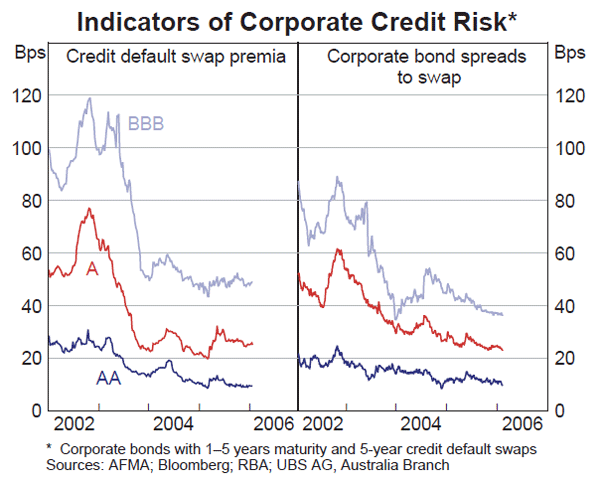
Spreads on corporate bonds – an indicator of financial market participants' perceptions of default risk – have generally drifted lower since mid 2004 and are now very low by historical standards. Similarly, premia on credit default swaps (which are financial derivatives that provide ‘insurance’ against defaults on corporate bonds) are at low levels (Graph 50).
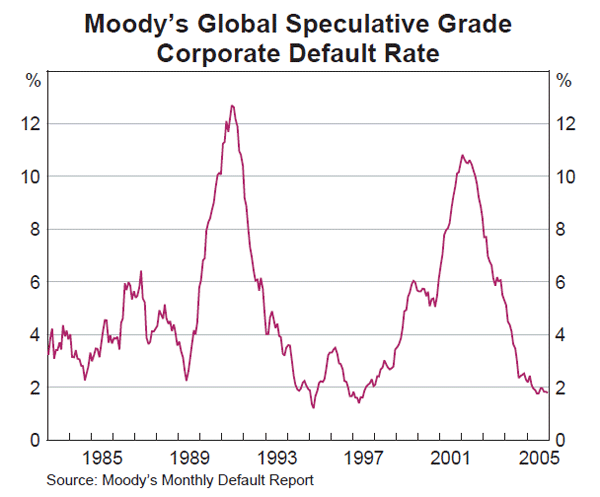
Underpinning the market's sanguine view on corporate credit risk are the generally good prospects for these borrowers; globally in 2005, only around 2 per cent of issuers that were rated as sub-investment grade defaulted on their borrowings, well below average but around the same as in other periods of good economic performance over the past 20 years (Graph 51). Also putting downward pressure on corporate bond spreads has been the strong global investor demand for higher-yielding assets.
Intermediaries' interest rates
Most intermediaries' indicator rates on variable-rate housing loans have been unchanged since the cash rate target was last increased in March 2005. There have, however, been some small reductions in the indicator rates offered on variable-rate loans, mostly by non-bank mortgage originators, as demand for housing loans has remained well below earlier peaks.
Most of the recent competition in the housing loan market has manifested itself in increases in the size and availability of ‘discounts’ offered on indicator rates, rather than changes in indicator rates themselves. Over 90 per cent of borrowers taking out variable-rate housing loans in the first half of 2005 were charged an interest rate below the major banks' average standard variable indicator rate. Moreover, the average size of this discount has risen from around 40 basis points in early 2004 to 55 basis points in mid 2005, the latest period for which we have reliable data. While this increase in the average discount may partly reflect borrowers choosing cheaper loan products, it also reflects lenders easing the requirements for borrowers to access discounts and increasing the size of the discounts they offer.
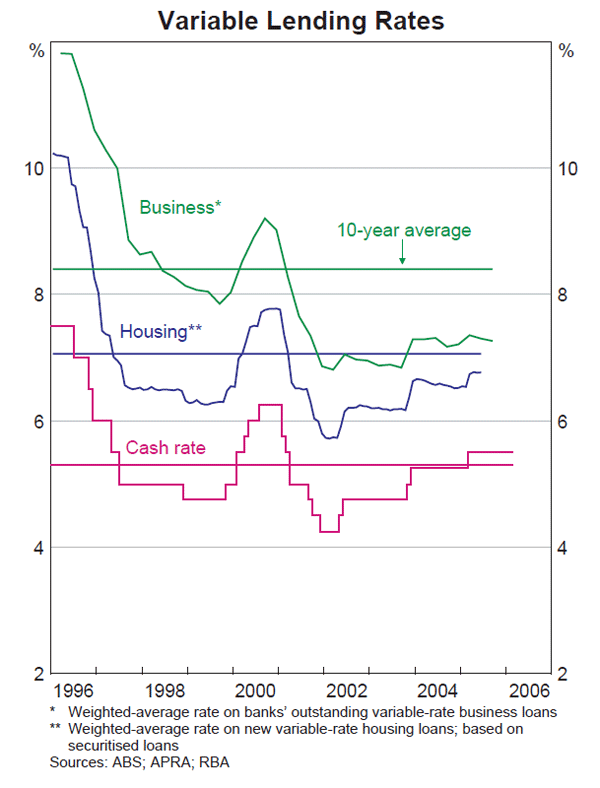
Reflecting the trend towards discounting, the average rate that borrowers paid on new variable-rate housing loans in mid 2005 was around 30 basis points below its decade average in both real and nominal terms (Graph 52).
Competition has also been evident in other parts of the household lending market, particularly credit cards. In the past few years there has been a proliferation of so-called ‘no-frills’ credit cards which have relatively low interest rates and annual membership fees, but generally no loyalty rewards programs. Interest rates on ‘no-frills’ cards range from 9 to 13 per cent compared with rates of 17 per cent or higher on most standard rewards-based cards. Competition has also seen some lenders offer significantly discounted introductory interest rates on balances transferred from other credit cards and on new purchases, in some cases as low as zero per cent for six months. These discounts represent considerable – but not indefinite – savings for cardholders with outstanding debts.
With the moderation in lending to households over the past couple of years, banks have also been competing more for business loans. While indicator rates on variable-rate business loans have mostly been unchanged since last March, the overall rate being paid on these loans after incorporating risk margins and discounts has declined by 10–15 basis points. In both real and nominal terms, the overall business loan rate has been below its decade average for several years (Graph 52). The recent decrease in spreads on business loans is consistent with other signs of competitive pressure in the business loan market, including fee discounting and indications that banks have eased their loan approval standards, particularly for larger loans.
With respect to fixed-rate loans, the major banks' average 3-year fixed rate on housing loans (the most popular term for fixed-rate loans) is currently 6.70 per cent (Graph 53). This is around its level at the beginning of 2005 and close to the average rate that new borrowers would pay on these banks' variable-rate housing loans, given the tendency for the latter to be discounted.
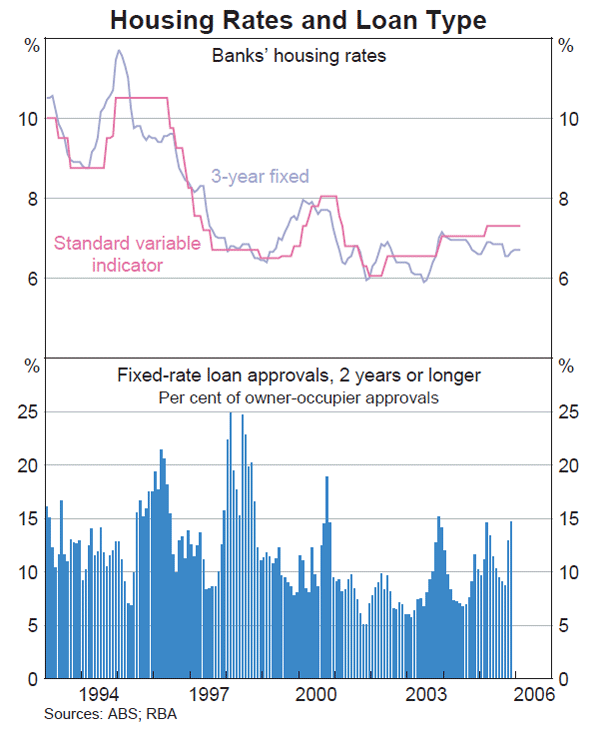
Overall, demand for fixed-rate housing loans remains fairly low in Australia, with only around 10 per cent of new owner-occupier loans taken out at fixed rates on average, though this share does tend to cycle (Graph 53). Demand was relatively strong ahead of the monetary policy tightening in early March 2005, then moderated over the middle half of the year before picking up again, to around 15 per cent in November, the latest month for which we have data. The recent strengthening in demand is likely to reflect the reductions in interest rates on these loans that occurred around September, which have since been partially reversed.
Small business fixed rates, which tend to follow movements in wholesale market rates more closely than do fixed housing rates, are also little changed in net terms since early 2005. For small business loans, the share of outstanding loans at fixed rates has been largely unchanged for the past few years, at around 30 per cent.
Equity prices
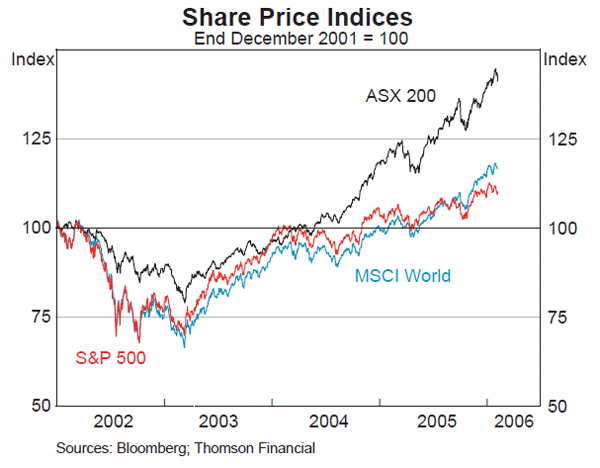
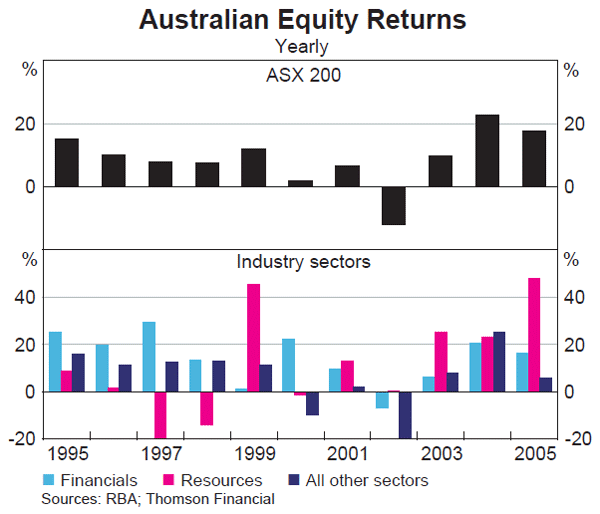
The ASX 200 rose by 18 per cent over the course of 2005, following increases of 23 per cent in 2004 and 10 per cent in 2003. This cumulative increase is the biggest rise over a three-year period for 12 years. Since the previous Statement, the share market has risen 8 per cent, continuing to reach record high levels (Graph 54).
An important factor contributing to the high returns of the past few years has been the large increases in resources companies' share prices, which increased by around 50 per cent in 2005 after increasing by over 20 per cent in each of the previous two years (Graph 55). Share prices in most other sectors also increased noticeably in 2005, with the exception of consumer discretionary and telecommunications companies.
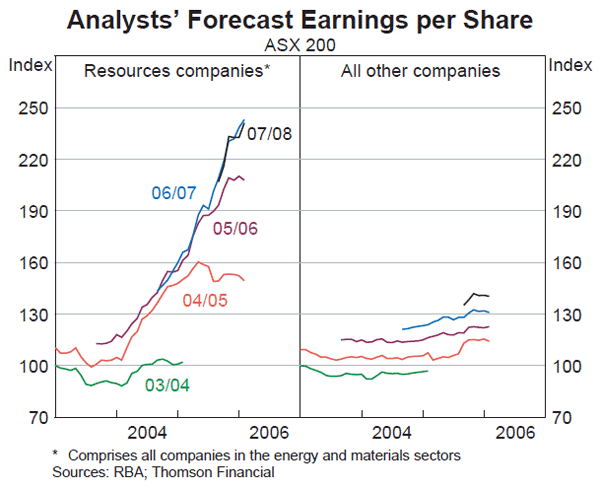
Underpinning the strength in resources companies' share prices over the past few years has been continuous upward revisions of the forecast earnings for these companies (Graph 56). Expected earnings per share for companies in the energy and materials sectors for the 2005/06 financial year have now been revised upwards by around 85 per cent from analysts' initial estimates made in the latter part of 2003. Earnings estimates for subsequent years have also been strongly revised upwards, with these companies' earnings per share in 2006/07 now expected to be around 70 per cent higher than initially forecast. In contrast, there has been little revision to analysts' estimates of other companies' earnings: the expected earnings growth in each financial year has been fairly steady at around 7 per cent.
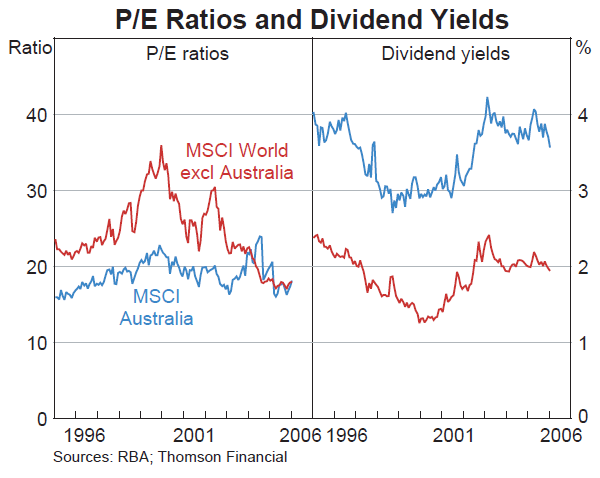
There has been little change in aggregate measures of the valuation of the Australian market: while the price/earnings (P/E) ratio based on actual earnings has risen since the previous Statement, it currently stands at 18, which is only a little above its 50-year average. Australian dividend yields have fallen slightly, to 3.6 per cent, which is a little above the historical average (Graph 57). These measures indicate that the rise in share prices has been underpinned by the rise in profits. While, as always, future profits cannot be predicted with certainty, the outlook for the domestic and global economic environment appears to be very favourable for corporations.
Financing activity
Intermediated financing
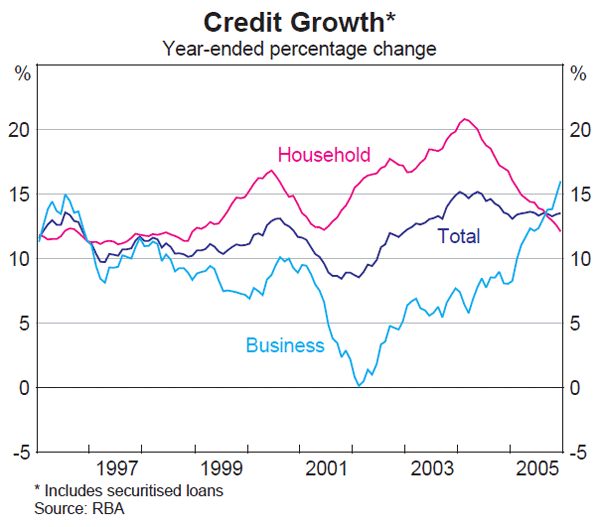
Total credit growth over the course of 2005 was 13½ per cent, around the same as growth in the previous year (Graph 58). The 12-month ended growth rate for household credit fell from around 17 per cent at the end of 2004 to 12 per cent in December – below its average of the past 10 years. The slowdown was particularly marked for investor housing credit growth. Growth in owner-occupier housing credit and personal credit both finished the year somewhat below their averages for the past 10 years. However, these slowing trends looked to be levelling out by the December quarter (Table 10). One issue here is that lenders have become more aggressive in marketing loans with increased discounting of interest rates and lowering of credit standards.
| Average monthly growth | |||
|---|---|---|---|
| September quarter 2005 |
December quarter 2005 |
Year-ended December 2005 |
|
| Total credit | 0.9 | 1.1 | 13.5 |
| Household | 0.8 | 0.9 | 12.1 |
| – Housing | 0.7 | 0.9 | 12.3 |
| – Personal | 0.8 | 0.7 | 10.7 |
| Business | 1.0 | 1.3 | 16.0 |
| Broad money | 0.5 | 0.5 | 9.1 |
|
Source: RBA |
|||
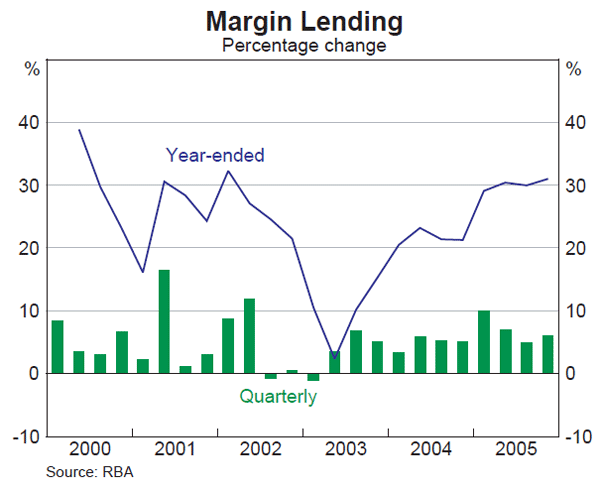
One component of personal credit that continued to record strong growth throughout 2005 is margin lending for the purchase of shares and managed funds. Outstanding margin debt, which accounts for around 16 per cent of personal credit, rose by more than 30 per cent over the course of 2005 (Graph 59). Two-thirds of this growth was due to growth in the average loan size, with the remainder due to an increase in the number of borrowers. Despite the strong growth in margin debt, indicators of the riskiness of borrowers' margin loan positions, such as average gearing levels and the percentage of credit limits being used, are fairly conservative by historical standards.
Business credit growth picked up strongly in 2005, with 12-month ended growth rising from around 8 per cent at the end of 2004 to stand at 16 per cent in December. Strong business credit growth was supported by strong investment spending, as well as a competitive lending market and interest rates remaining below their historical average.
Data on banks' business lending by size of facility suggests that growth in borrowing by large businesses has tended to outpace that of small businesses for the past couple of years. This is consistent with the strength seen in the syndicated loan market: in 2005, a record $70 billion of syndicated loans were approved, 14 per cent higher than in the previous year, even though the average loan size fell slightly, to $520 million.
Non-intermediated financing
Total issuance of bonds by Australian non-government entities amounted to $157 billion in 2005, the same as in the year before (Table 11). Increased issuance in the domestic market was offset by reduced issuance offshore. The domestic bond market was further boosted by issuance by non-resident entities, including quasi-government entities who have been taking advantage of the decline in issuance by the Commonwealth Government in recent years to satisfy demand for high-quality fixed-interest bonds. On the other hand, offshore Australian dollar issuance by non-resident entities fell during the year, in part because of a switch in Japanese retail demand away from Australian dollar denominated debt to higher-yielding New Zealand dollar debt.
| Sector | 2002 | 2003 | 2004 | 2005 | |
|---|---|---|---|---|---|
| of which December quarter |
|||||
| Bond issues by Australian entities | |||||
| Onshore | |||||
| Financial institutions | 7.4 | 9.9 | 14.3 | 20.9 | 4.1 |
| Non-financial corporates | 7.6 | 5.6 | 8.0 | 9.2 | 2.0 |
| Asset-backed | 19.5 | 20.6 | 25.0 | 32.2 | 5.4 |
| Total | 34.5 | 36.1 | 47.3 | 62.4 | 11.5 |
| Offshore | |||||
| Financial institutions | 32.2 | 51.0 | 64.7 | 52.0 | 8.7 |
| Non-financial corporates | 10.5 | 15.2 | 13.8 | 16.5 | 4.2 |
| Asset-backed | 16.6 | 24.3 | 29.8 | 25.6 | 3.7 |
| Total | 59.4 | 90.5 | 108.2 | 94.2 | 16.6 |
| Total | 93.9 | 126.6 | 155.5 | 156.6 | 28.0 |
| A$ bond issues by non-resident entities | |||||
| Onshore | 3.1 | 7.1 | 21.3 | 26.2 | 7.8 |
| Offshore | 18.7 | 24.8 | 21.5 | 11.9 | 1.5 |
| Total | 21.8 | 31.9 | 42.9 | 38.1 | 9.3 |
|
Source: RBA |
|||||
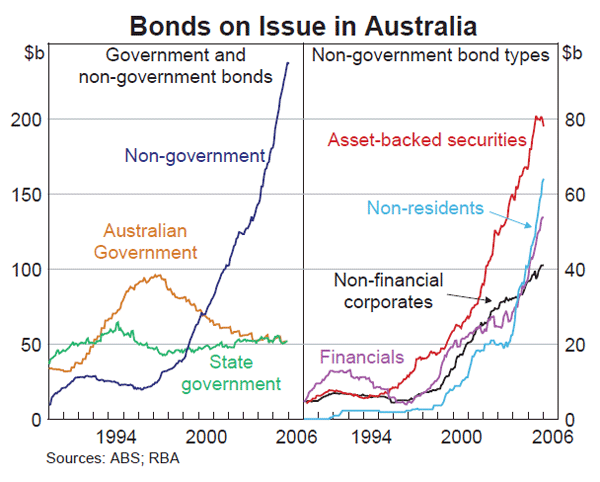
A pick-up in maturities meant net bond issuance by Australian non-government entities was a little weaker than in the previous year. Nonetheless, total outstandings of non-government bonds in the domestic market again grew strongly, to stand at $237 billion at year end, compared with just over $50 billion each of Commonwealth and State government bonds (Graph 60). Non-government bonds presently account for 70 per cent of domestic bond outstandings, compared with only 13 per cent a decade ago.
Net issuance of equity by Australian-listed companies amounted to $23 billion in 2005, up slightly from 2004. (This compares with net bond issuance by Australian entities – here and abroad – of triple this amount.) IPO activity was well above average in 2005, especially in the December quarter, when there were several very large raisings (Graph 61). IPO activity in general has been supported by buoyant equity markets, though other equity raisings were weak and buybacks were stronger than usual.
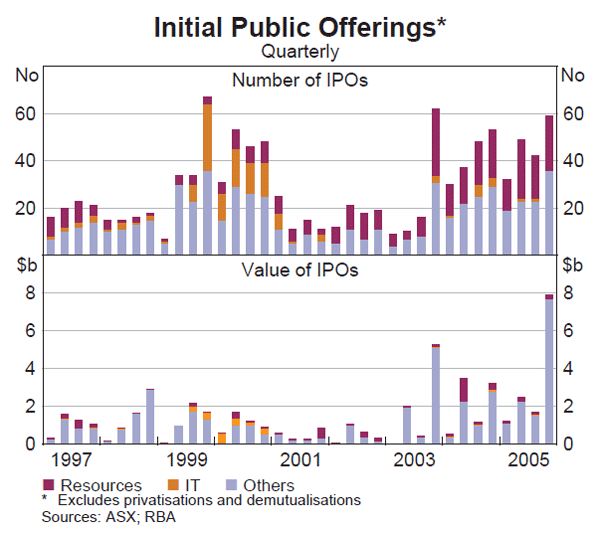
The strength in commodity prices and the resources sector over the past few years has seen strong IPO activity for companies in this sector. By number, around 40 per cent of new listings since the December quarter of 2003 have been resources companies. By value, however, these companies' raisings have been very small in comparison to overall raisings, with individual resources companies' raisings averaging only $15 million.
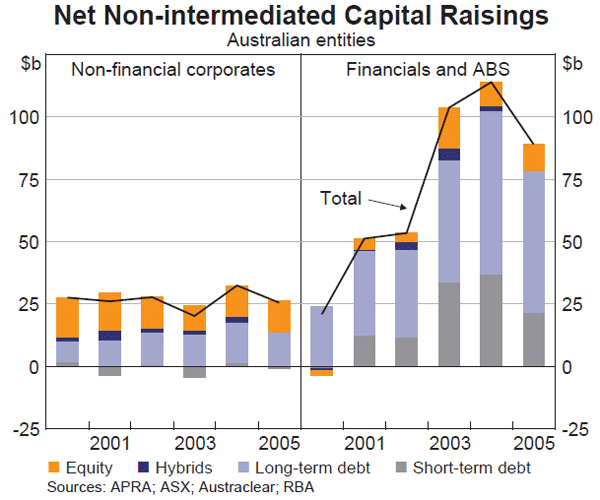
While net bond and equity raisings in 2005 were much the same as in 2004, short-term debt raisings fell. As a result, total non-intermediated capital raisings by the Australian non-government sector fell in 2005. For non-financial companies, total net capital raisings were only a little weaker than in 2004, at around $25 billion (Graph 62). This small reduction in net capital raisings by non-financial corporates reflected a pick-up in intermediated funding (with banks more willing to lend to businesses as demand for housing loans moderated) and high levels of profitability. As noted in the chapter on ‘Domestic Economic Conditions’, these firms continue to have ample ability to fund investment without heavy reliance on capital markets.
