Statement on Monetary Policy – February 2019 Box B: The Recent Japanese Yen Flash Event
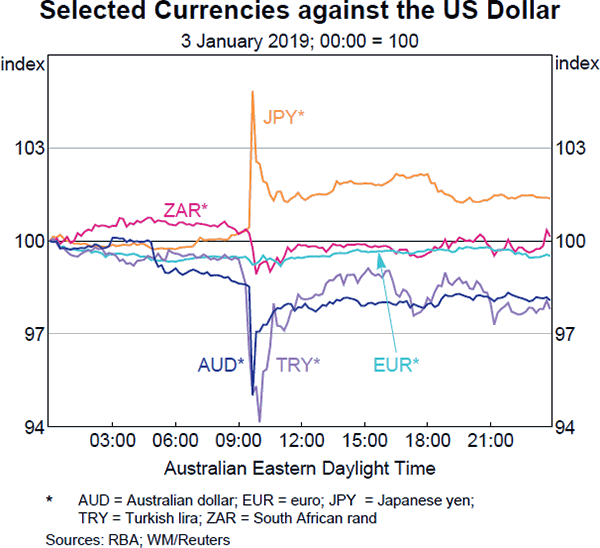
On 3 January, the Japanese yen appreciated very sharply against the US dollar over a few minutes around the open of the Asian trading session (Graph B1). This ‘flash’ event quickly cascaded across a number of other markets, with the Australian dollar depreciating sharply during a period of low liquidity. Such events have been observed in recent years in a number of markets. As in those earlier events, prices and liquidity recovered quickly and there were no systemic effects. This Box summarises how the event unfolded and describes several factors that are likely to have contributed to the abruptness of the moves.
Timeline of the flash event
The hour leading up to the event saw a general deterioration in risk sentiment, which was reflected in orderly price movements in a number of financial markets. This followed news that Apple had cut its quarterly revenue guidance, citing weakness in some emerging markets and a slowdown in China. In response, Apple shares fell noticeably in after-hours trade and US equity futures declined modestly (the US cash equities market had already closed). US and Australian government bond yields declined slightly in futures markets. In currency markets, the yen appreciated modestly, including against the US and Australian dollars. Some emerging market currencies depreciated, including the Turkish lira. Initial price movements in foreign exchange markets were orderly, with indicators of liquidity such as bid-ask spreads (the difference between the quoted prices for buying and selling) little changed.
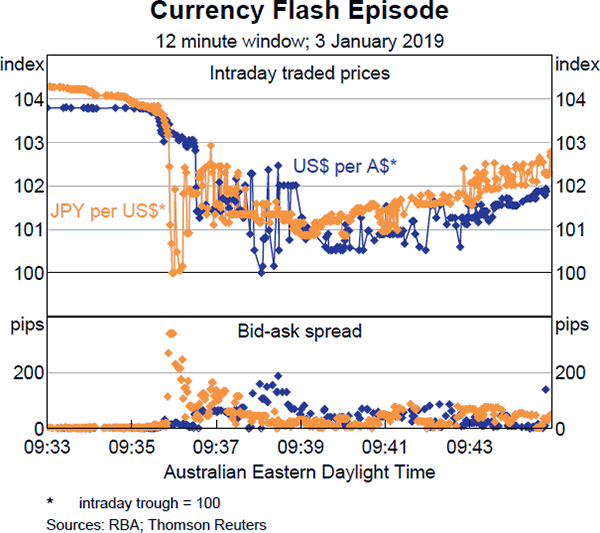
Conditions in foreign exchange markets deteriorated shortly after 9:30 am Australian Eastern Daylight Time (AEDT) (Graph B2). At that time, US and Japanese fixed income and equity (cash and futures) markets were closed and thus currencies were the main vehicle through which global portfolio adjustments could occur. At 9:36 am AEDT, over the span of about 30 seconds, and in the absence of any material news, the yen appreciated by 3 per cent against the US dollar amid a significant imbalance between orders to buy and sell yen. Bid-ask spreads also widened substantially from around 2 pips to 100–300 pips (i.e. 1–3 yen, or roughly 1–3 US cents).[1]
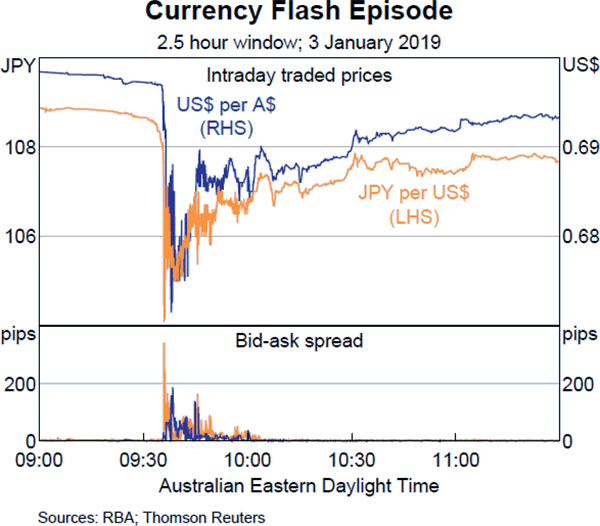
The appreciation of the Japanese yen then appeared to set off a sharp depreciation of the Australian dollar. Starting around 30 seconds after the significant move lower in the US dollar against the yen, and within a span of about two minutes, the Australian dollar depreciated by 3 per cent against the US dollar (to be around 7 per cent lower against the yen; Graph B3). That move saw the Australian dollar briefly reach a 10-year low of 0.6715 against the US dollar. Bid-ask spreads widened to over 100 pips (1 US cent) for a short period.
Market conditions then recovered within a few minutes. The Japanese yen and Australian dollar retraced around half of their price moves (relative to the US dollar) and the movements unwound further over the next hour. Market contacts reported a return to normal trading conditions within a few minutes and bid-ask spreads returned to normal levels within an hour.
Factors contributing to the event
It is difficult to draw firm conclusions on the causes of the flash event, partly because foreign exchange market trading activity is fragmented across an increasing number of different platforms. However, three key factors are likely to have contributed to the brief deterioration in market conditions on 3 January.
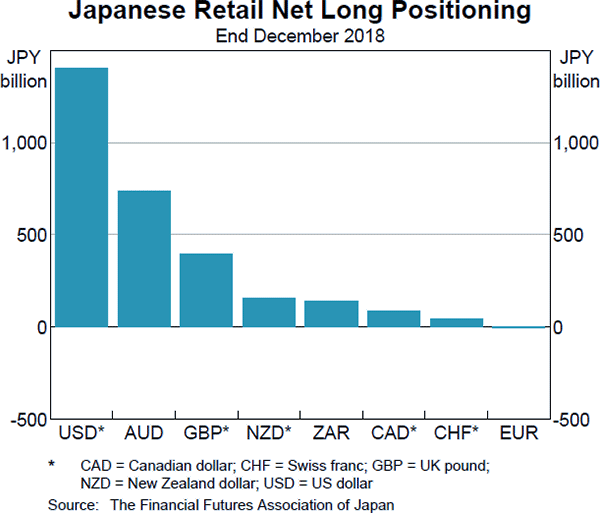
First, the impact of the liquidation of ‘carry trade’ positions, particularly of Japanese retail investors (who comprise as much as 10 per cent of total foreign exchange trading in Japan), are likely to have contributed to the disorderly appreciation of the yen. Carry trades involve taking long positions in currencies that have a higher yield than that of the funding (short) currency. Publicly available data on retail positions suggest that Japanese investors held aggregate long positions in high-yielding currencies (including the US dollar, Australian dollar, South African rand and Turkish lira) prior to the event (Graph B4).[2] Retail brokers will automatically liquidate these positions (via ‘stop loss’ orders) if losses due to adverse exchange rate movements exceed pre-determined levels (which are often linked to the value of the equity held in the accounts of the retail investors). On 3 January, following the initial orderly phase of yen appreciation, these automatic orders may have been triggered at an increasing rate. This would have contributed to the outsized depreciation in some high-yielding currencies relative to the yen.
Second, market liquidity was seasonably low at this time of the day and year, making the market more susceptible to imbalances between buy and sell orders. Although foreign exchange markets trade 24 hours a day during the business week, trading volumes are particularly low in the time between the closing of US markets and the opening of the Tokyo session, when Auckland and Sydney are the only foreign exchange centres open. Several flash episodes in the foreign exchange market have been recorded during this time period in recent years (Graph B5). On 3 January, liquidity is likely to have been further reduced due to the time of year (close to New Year's Day and during the vacation period for many participants) and because Japanese banks, many of whom act as foreign exchange market-makers, were closed for a public holiday in Japan. The relative lack of liquidity left the market vulnerable to disruptive price movements.
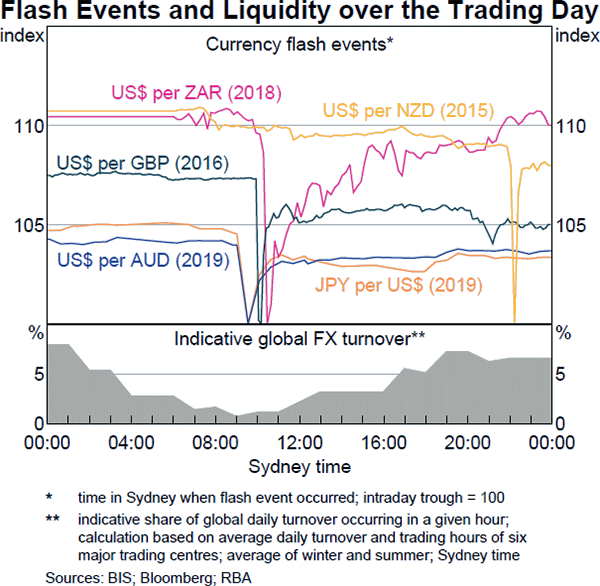
Third, algorithmic trading strategies may have acted as amplifiers during the flash event. Some algorithmic trading platforms that provide liquidity to the market during normal conditions are programmed to automatically ‘switch off’ in unusual market conditions, thereby reducing liquidity in the market during stress periods. For a brief period on 3 January, this may have contributed to the unusual widening in bid-ask spreads. Other participants may have added to the imbalance in long yen orders as the currency appreciated, thus amplifying price moves – in particular, ‘momentum-based’ algorithms (i.e. those betting that the market will continue moving in the prevailing direction) or participants engaged in systematic cross-asset hedging (using spot foreign exchange markets to hedge exposures in other markets).
As with other flash events in the foreign exchange market, it is also difficult to be definitive about what brought about the restoration of orderly market functioning. In the case of the Australian dollar, market contacts ascribed the intraday low (relative to the US dollar) on 3 January to a combination of discretionary buy orders by traditional market-making banks and institutional accounts, which assisted in re-establishing the process of price discovery. The stabilisation in the price may have been sufficient to trigger the resumption of market-making algorithms, as reflected in the rapid subsequent tightening in bid-ask spreads. However, data limitations prohibit firm conclusions being drawn.
More broadly, while the flash event of 3 January did not lead to wider disruption, it adds to a growing list of extremely sharp moves in foreign exchange (and other asset) markets. These events are likely to owe in part to key changes in the structure of markets more broadly over the past decade; for example, the make-up and behaviour of principals, intermediating agents and trading platforms.
Footnotes
Bid-ask spreads are typically measured in ‘pips’ in foreign exchange markets. For example, the AUD/USD bid-ask spread for a bid price of 0.6900 US dollars and an ask price of 0.6901 US dollars is 1 pip. [1]
Data on Japanese retail investor positions by currency are primarily reported by the Financial Futures Association of Japan (over-the-counter transactions) and Tokyo Financial Exchange (on-exchange transactions). Data may provide a partial snapshot of aggregate positioning across platforms. [2]