Statement on Monetary Policy – February 2019 1. The International Environment
Global growth remained above trend in 2018, despite moderating in the second half of the year. The outlook for the global economy has become more uncertain, partly because it is hard to predict how trade policies might evolve and how much support stimulatory policies will provide to domestic demand, especially in China. But after several years of strong growth, labour markets are tight, particularly in the major advanced economies, and this has helped to push up wages growth. Core inflation has picked up in some countries but remains low elsewhere. Headline inflation has declined because oil prices have fallen significantly since their peak in October 2018. Lower oil prices should also support growth, particularly for oil-importing economies, including China, Japan, India, and the euro area.
Financial market conditions in most advanced economies tightened somewhat in late 2018, following a lengthy period when conditions were generally very accommodative. The cost of funding for corporations rose, issuance of new debt securities eased, equity prices declined and volatility across global financial markets rose a bit. However, these moves have since been partly reversed, and risk premiums generally remain low by historical standards. In addition, long-term government bond yields have declined, as market participants have scaled back their expectations for central bank policy rates and inflation expectations have declined alongside lower oil prices. As a result, the cost of funding for corporations and sovereigns in major markets remains low by historical standards.
Global growth has moderated
Global growth has been strong for a number of years, but growth moderated in the second half of 2018; in some economies, this easing was partly the intended consequence of tighter financial conditions. In China, the authorities' efforts to prevent an unsustainable build-up in debt and rein in risky ‘shadow banking’ activities has contributed to slower growth. Monetary policy was also tightened in the United States in 2018 against a setting of strong growth that was boosted by a large fiscal stimulus.
Global trade grew strongly in early 2018, but slowed in the second half of the year (Graph 1.1). Some of the moderation is attributable to the increase in trade frictions, but slower growth in China, unrelated to the trade tensions, also contributed. Trade is closely tied to activity in the manufacturing industry, which reported a decline in conditions throughout 2018 globally.
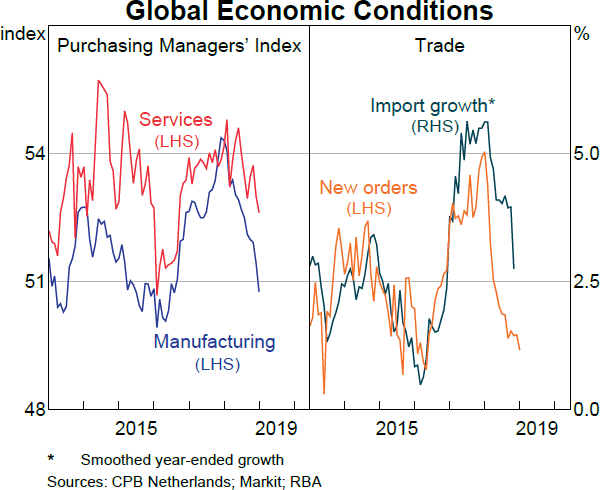
Investment intentions and new export orders declined noticeably in 2018 in a number of economies, reflecting the effects of ongoing trade tensions and increased political uncertainty in some economies in late 2018.
Trade tensions remain high
Trade tensions have been a source of uncertainty over the past year. The United States and China have both increased the tariffs on each other's imports. US exports to China and Chinese exports to the United States fell sharply in late 2018. In late November, the United States and China agreed to delay further tariff rate increases until 1 March 2019 to allow more time for bilateral trade negotiations. Speculation about a possible increase in US automotive tariffs remains a concern for a number of economies, particularly Germany and Japan, because of their large automotive sectors and high exposure to US consumers. The United States is holding trade negotiations with the European Union and has also agreed to enter into bilateral trade talks with Japan.
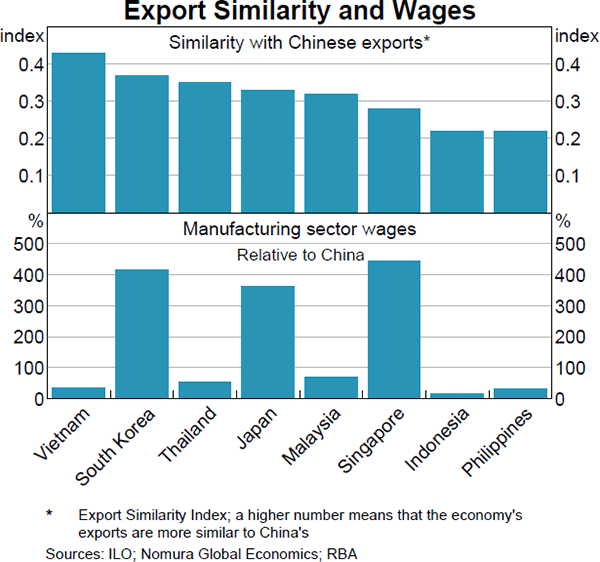
As discussed further below, there is evidence that the trade tensions are having adverse economic effects and are increasing uncertainty about the outlook for growth in many economies. Some economies are being adversely affected because they are part of cross-border supply chains with China. However, some other economies in the east Asian region may benefit from a restructuring of supply chains aimed at reducing the impact of higher US–China tariffs. Over the past six months, there have been more reports of manufacturing companies shifting production out of China in response to higher US tariffs. Some firms have reportedly shifted the production of automobile parts and electronics to Vietnam, Thailand and Malaysia. These economies produce and export similar products to Chinese exports and have lower labour costs, which was likely to have already been encouraging some production to shift away from China (Graph 1.2). The escalation of US–China trade tensions has accelerated existing plans to shift production to these lower-cost producers in the region.
Trading partner growth is expected to be around trend in 2019 and 2020
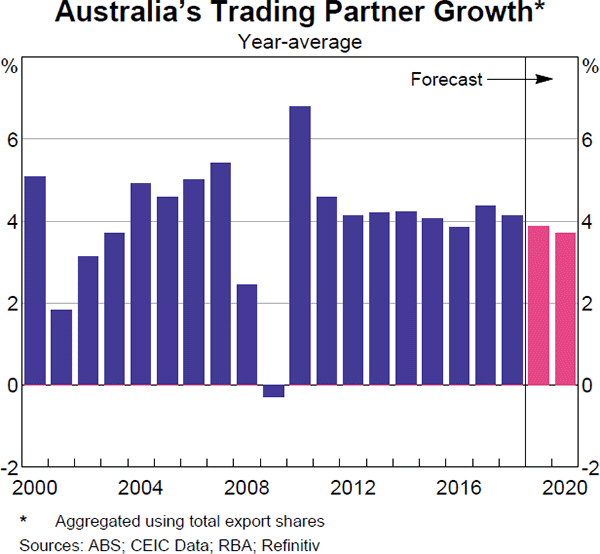
Australia's major trading partners are expected to grow by around 3¾ per cent in 2019 and 2020 (Graph 1.3). This should be sufficient to continue to put some upward pressure on global inflation, although headline inflation is expected to decline in the near term because oil prices have fallen. The forecasts for major trading partner growth represent a modest slowing from strong growth in 2017 and early 2018. Reflecting some weaker data at the end of 2018, this slowing is a little more than had been forecast three months ago. The downside risks to global growth have also increased.
In China, GDP growth was 6.6 per cent in 2018, but growth is expected to moderate in 2019, largely because of the previous tightening in financial conditions. In the near term, the pace of slowing is expected to be tempered by recent targeted fiscal and monetary stimulus, which should also help offset any negative effects arising from trade conflict with the United States. Ongoing trade tensions and the need to manage financial risks mean that there is considerable uncertainty around how these easing measures will affect future growth in China and other economies with strong trade links to China.
Growth in the United States is also expected to moderate from the very strong rates seen in 2018 to be back around trend by 2020. In part, that is because the effects of the recent fiscal stimulus are expected to wane. In addition, monetary policy has become less accommodative over the past year or so. The US Government shutdown during December and January is expected to subtract a little from growth in the first part of 2019. Nonetheless, the US economy is expected to continue operating at full capacity. There are a number of sources of uncertainty for the US outlook, including the effects of trade tensions on domestic firms and an uncertain outlook for fiscal policy in 2020.
Growth in Japan is expected to be above trend in 2019 as consumption is brought forward ahead of an October 2019 increase in the consumption tax, but to fall below trend in 2020 as fiscal policy tightens. Slower trade growth, particularly with China, has been weighing on growth in the trade-exposed economies of east Asia and the euro area. The outlook for the euro area is also subject to a range of country-specific factors, including uncertainty about the United Kingdom's exit from the European Union, disruptions in the German automotive sector, the repercussions from the recent protests in France and concerns related to sovereign and financial risks in Italy.
Trends in growth across major advanced economies diverged over 2018
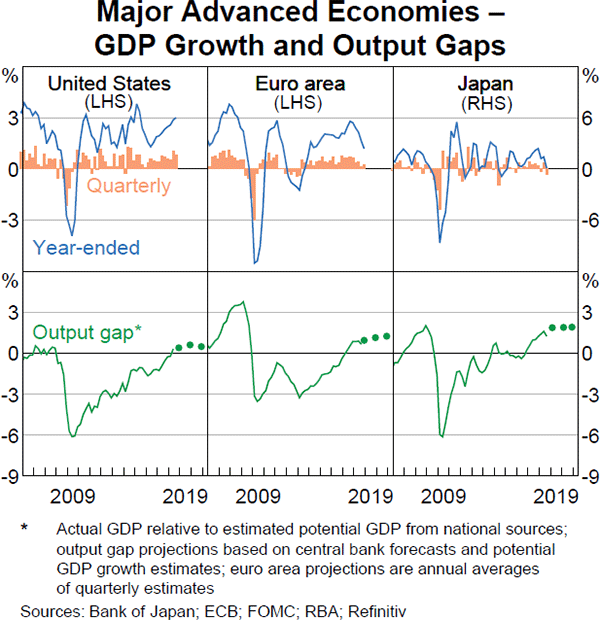
Over 2018, growth increased in the United States supported by the large fiscal stimulus (Graph 1.4). Growth in the euro area was around trend, having eased from the strong pace seen in the previous year that had been supported by a large pick-up in growth in exports to China; a number of temporary country-specific factors also contributed to growth easing. Growth in Japan also appears to have moderated over 2018, although the underlying momentum is harder to read given economic disruption from natural disasters in the September quarter.
In the United States, strong employment growth, a further pick-up in wages growth and large personal income tax cuts supported consumption growth in 2018. Business investment, while growing strongly, appears to have been weaker than expected in recent quarters despite the large corporate tax cuts. Investment intentions have eased, but are still at high levels (Graph 1.5). Uncertainty about US trade policies could be part of the explanation. The publication of GDP and some other economic data for the December quarter has been delayed because of the US Government shutdown.
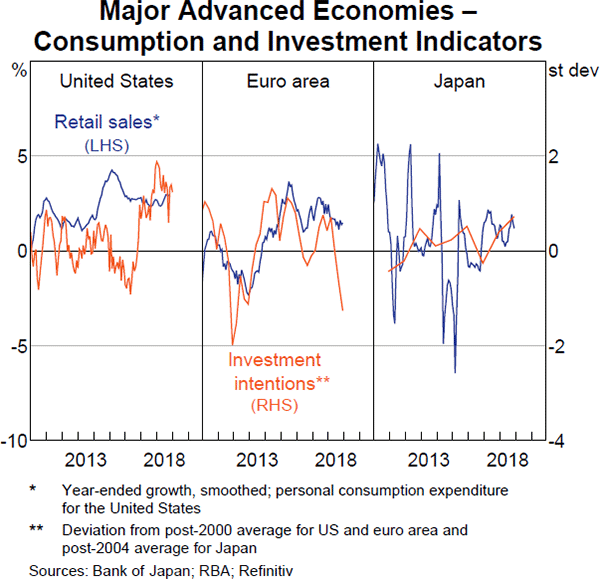
Growth in the euro area eased over 2018, particularly in Germany, France and Italy. Temporary disruptions to German automotive production, as the industry adjusts to new emissions testing standards, the effects of widespread social unrest in France, and sovereign risk and budget uncertainty in Italy had an effect. However, the slowing in growth appears to have been more broadly based, led by a softening in external demand, especially in export growth to China. Investment intentions and business conditions have also declined sharply, although consumption growth has been relatively resilient.
In Japan, natural disasters disrupted economic growth in the September quarter. It appears that domestic demand has since largely recovered but export growth, particularly to China, has eased over the year. Notably, business investment intentions remain high, in part because of investment in labour-saving equipment given a declining labour force as the population ages. Consumption growth has been supported by the strong labour market and, as mentioned above, will be boosted in the near term by activity being brought forward ahead of the consumption tax increase in October.
Labour markets are tight and wages growth is increasing …
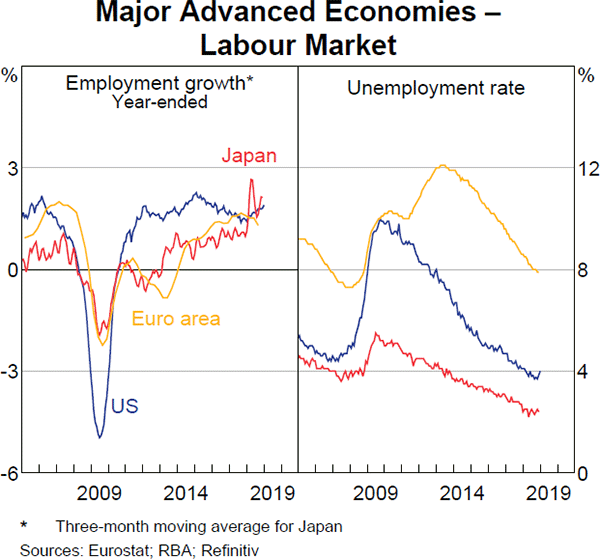
Following several years of strong economic growth in the major advanced economies, labour markets have tightened considerably (Graph 1.6). Employment growth has remained high and above growth in working-age populations. As employment prospects have improved, labour force participation rates have risen in the United States and Japan, while the participation rate has been flat in the euro area despite the drag from ageing. Unemployment rates have declined to be below estimates of full employment and are at multi-decade lows in most advanced economies. Firms are reporting widespread difficulties in filling jobs. Vacancy rates have increased strongly in recent years, but increased more slowly late last year in Japan and in the private sector in the United States.
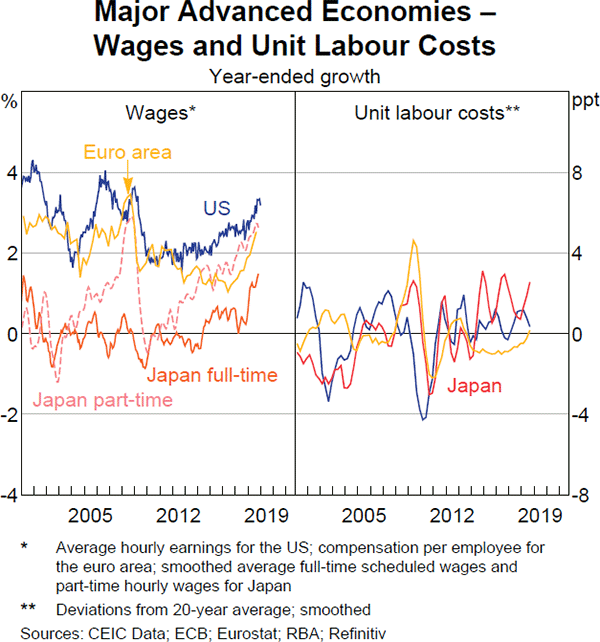
The tightening in labour markets has led to further increases in nominal wages growth over the past year (Graph 1.7). But wages growth still appears to be low relative to the tightness in the labour market, especially in the United States. Unit labour cost growth has ticked up in the euro area and Japan, in line with the increase in nominal wages growth and a further slowdown in labour productivity growth. Higher unit labour costs are putting pressure on business margins and could translate into higher inflation in these two economies. In contrast, labour productivity growth has increased a little in the United States (although it is low historically) and, as a result, growth in unit labour costs has slowed despite increases in nominal wages growth. Relatively large increases in minimum wages have been another source of upward wage pressures in some advanced economies (see ‘Box A: Minimum Wage Developments in Advanced Economies’).
… but core inflation is yet to pick up globally and headline inflation is declining
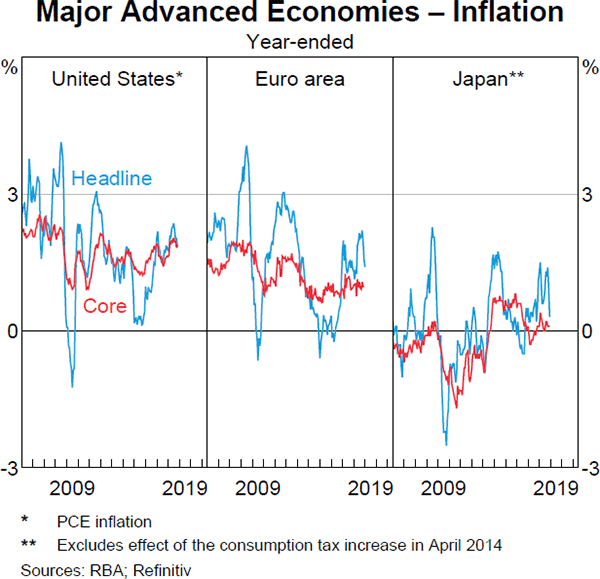
Core inflation is around central bank targets in the United States, Canada, Norway, Sweden and the United Kingdom (Graph 1.8). However, it remains noticeably below target in other advanced economies. Headline inflation has declined recently, and is expected to decline further because of the substantial fall in oil prices since October. Although GDP growth rates are expected to ease towards potential in a number of advanced economies, ongoing capacity constraints are expected to produce steady upward pressure on inflation. In the longer term, after the oil price fall has been fully passed through, inflation is expected to pick up a little in the euro area and Japan, and remain around target in the United States.
Expected policy rates in the United States and elsewhere have been revised lower …
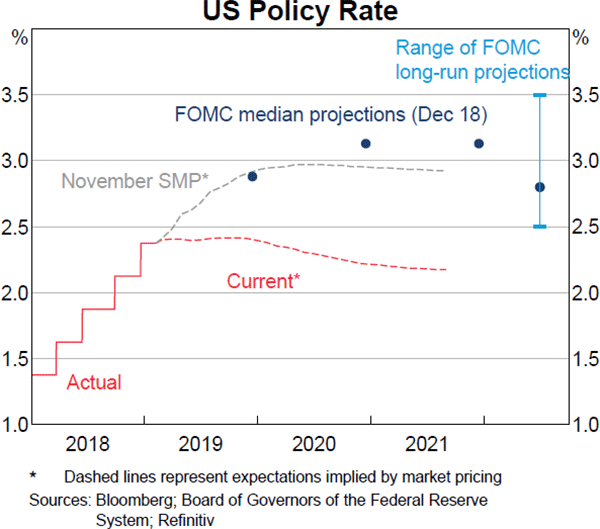
In the United States, financial market pricing now suggests that the Federal Reserve (Fed) has completed its rate increases for the current phase (Graph 1.9). The next move in the federal funds rate is expected to be down, though this is not anticipated to occur until next year. At its January meeting, the Federal Open Market Committee (FOMC) left its policy rate unchanged and removed its forward guidance for further interest rate increases. The FOMC acknowledged increased global economic risks, declines in financial market prices and muted inflation pressures. More generally, in recent communication the Fed has stated that it expects to take a more patient and flexible approach to normalising monetary policy than it had suggested through much of 2018. This approach also reflects the fact that the policy rate is close to the bottom of its range of estimates of the neutral rate.
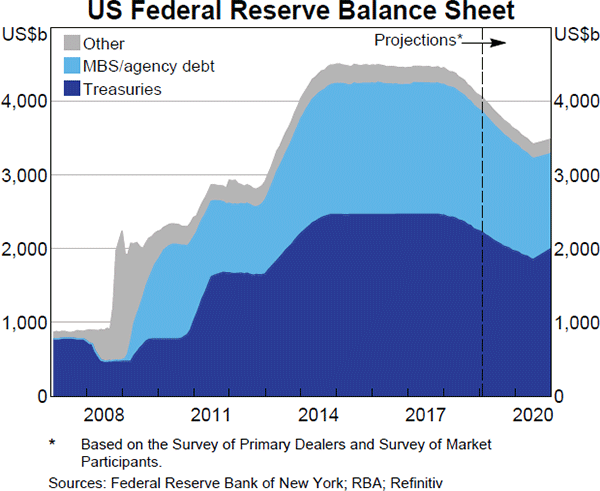
The Fed expects to continue to reduce its balance sheet gradually as planned (Graph 1.10).
However, it has recently signalled a preparedness to be flexible in its approach to normalising the size and composition of its balance sheet in response to any sizeable downward revisions to the economic outlook or dislocations in money markets. Separately, the FOMC has stated that it intends to continue to apply a floor system for implementing monetary policy (i.e. where the Fed maintains an ample supply of reserves and controls short-term interest rates through the rate of interest it pays on these reserves). A formal review of this and its broader monetary policy framework is underway.
Market expectations for policy rates have also been pared back in other advanced economies, albeit to a lesser extent than in the United States (Graph 1.11). Monetary policy settings are expected to remain accommodative and little changed for some time:
- The European Central Bank (ECB) has noted that the economic outlook for the euro area has moderated and that risks to the downside have increased. However, the ECB has not yet altered its forward guidance, namely, that it expects to leave its policy rates unchanged until at least the latter half of 2019. Market pricing suggests that the ECB is expected to begin raising its policy rates no earlier than 2020, a little later than market pricing had previously indicated. As it had previously signalled, the ECB ceased net asset purchases at the end of 2018. However, it will continue to reinvest the proceeds of maturing securities for some time, maintaining its highly accommodative stance of policy.
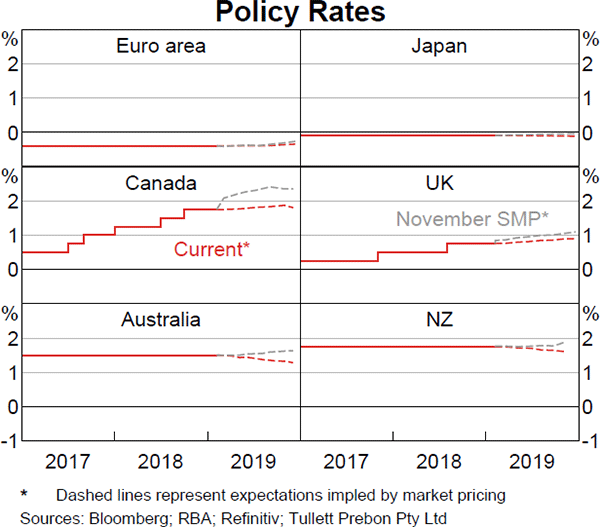
- The Bank of Japan (BoJ) continues to provide monetary stimulus by maintaining very low interest rates and expanding its balance sheet. Ten-year Japanese government bond yields have declined to the BoJ's target level of around zero per cent. The BoJ and market participants expect the current policy stance to be maintained for an extended period.
- The Bank of England (BoE) and the Bank of Canada expect to continue to gradually increase their policy rates, with the pace of increases reflecting economic developments. The outcome of Brexit negotiations remains a significant source of uncertainty for the BoE.
- The Reserve Bank of New Zealand has stated that it expects to leave its policy rate unchanged through to 2020.
… prompting declines in government bond yields and a depreciation of the US dollar
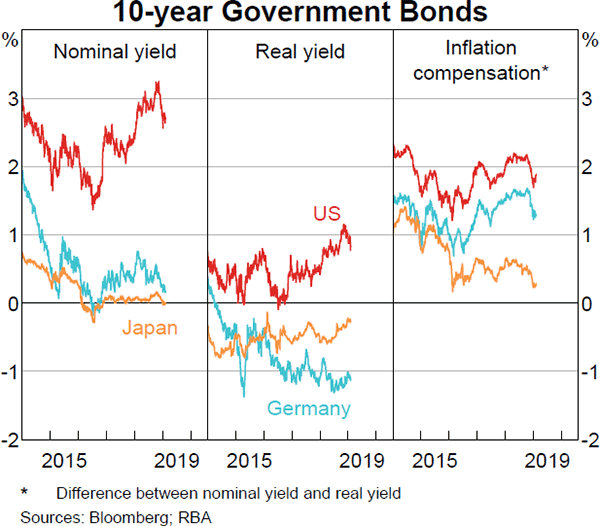
Government bond yields in advanced economies fell sharply towards the end of 2018, particularly in North America, although they have since risen a little. The falls primarily reflected a decline in compensation for future inflation across major markets, consistent with the recent declines in oil prices (Graph 1.12). In North America, a decline in real yields has also contributed, consistent with the shift in the expected stance of monetary policy. Term premiums remain low across major markets.
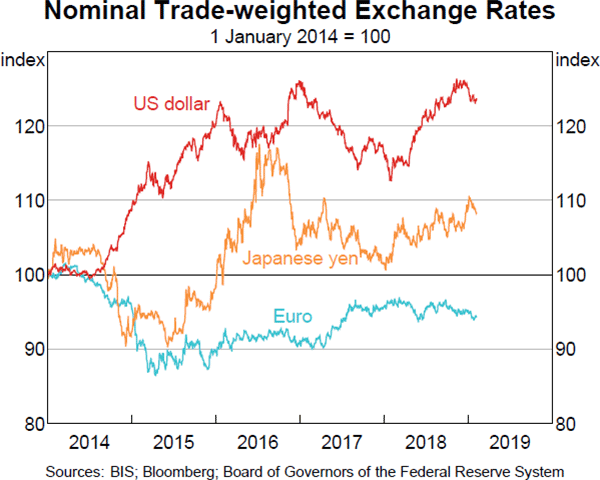
The US dollar has depreciated a little in recent months, consistent with the more pronounced shift in the outlook for monetary policy in the United States than in other major economies. This follows a sustained appreciation for much of the previous year (Graph 1.13). The depreciation has been relatively large against the Japanese yen, as often occurs during periods of increased risk aversion in financial markets. The yen is now around its highest level for the past two years on a trade-weighted basis. In early January, temporary market dislocation led to a very sharp, but short-lived appreciation in the yen, which also affected the Australian dollar (see ‘Box B: The Recent Japanese Yen Flash Event’).
But financial market conditions have tightened somewhat, after being accommodative for a prolonged period
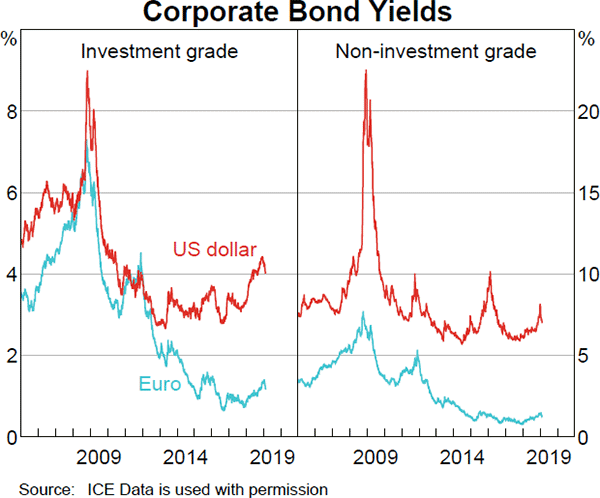
In net terms, the cost for corporations of raising funds in long-term debt markets has increased in recent months, particularly for lower-rated borrowers. There has also been a slowing in bond market issuance, although it has picked up of late. These developments appear to reflect some investor concern around the outlook for the corporate sector, against a backdrop of higher corporate leverage and evidence of declining lending standards in recent years. Nonetheless, analysts continue to expect corporate default rates to remain low over the next couple of years. Overall borrowing costs for corporations remain quite low as a result of low government bond yields (Graph 1.14).
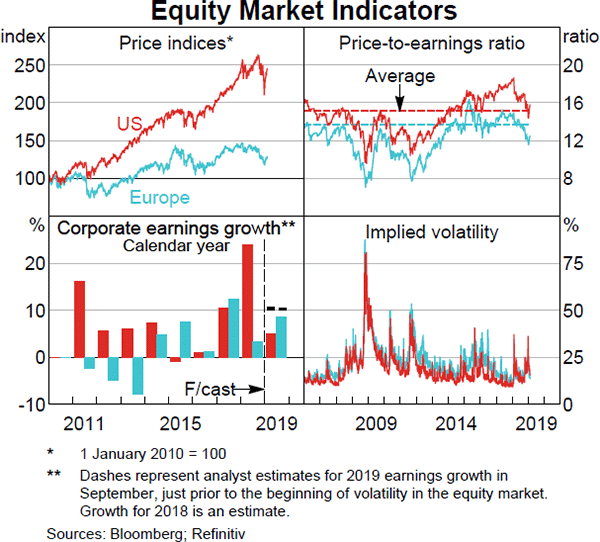
Equity markets in advanced economies are around 5–10 per cent below their September peaks, having declined by as much as 20 per cent in late 2018 before rebounding somewhat in 2019. The decline in equity prices reflects slightly lower expectations for corporate earnings growth in the coming years and a rise in the risk premium demanded by equity investors, consistent with an increase in investor uncertainty about the economic outlook (Graph 1.15). However, earnings growth is expected to remain around or above its historical average in major markets. Equity valuations are no longer expensive relative to historical averages.
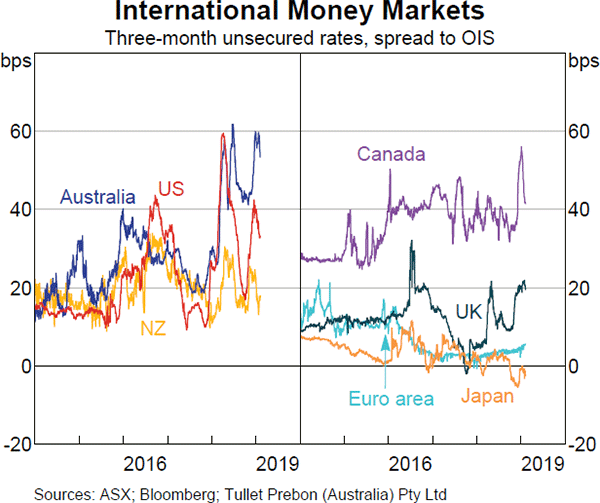
Spreads in short-term US dollar funding markets (over and above expected policy rates) increased towards the end of 2018 (Graph 1.16). This repeats the pattern of recent years because regulatory factors provide incentives for large banks in the United States and Europe to reduce intermediated lending activity over the year-end period. Conditions in short-term money markets have eased a little in the new year but spreads remain elevated in a number of countries.
In China, growth has slowed further …
In China, real GDP growth eased to 6.6 per cent in 2018, down from 6.8 per cent in 2017. However, a range of more disaggregated official indicators, such as fixed asset investment and retail sales, suggest a more pronounced slowing over the past year (Graph 1.17). The impact of trade tensions on exports was initially cushioned as export orders were brought forward in expectation of higher future tariff rates, but in recent months, exports have declined noticeably. Merchandise imports fell in the second half of the year as the effects of weaker domestic demand began to be felt. In a speech to provincial leaders in January, President Xi Jinping signalled heightened concern about economic risks and instructed officials to increase their sense of urgency, plan ahead and take effective measures to mitigate major threats to economic stability.
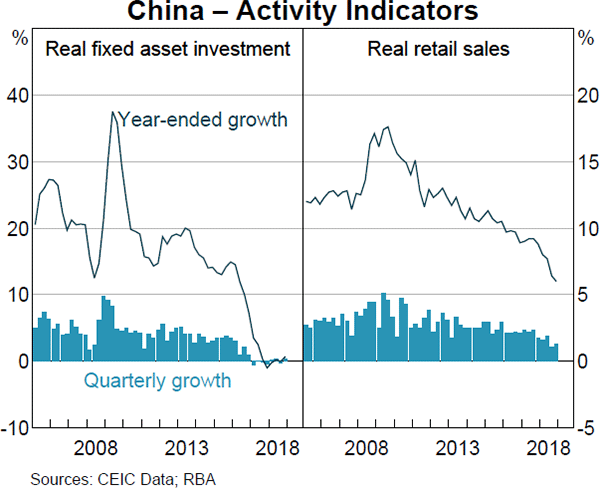
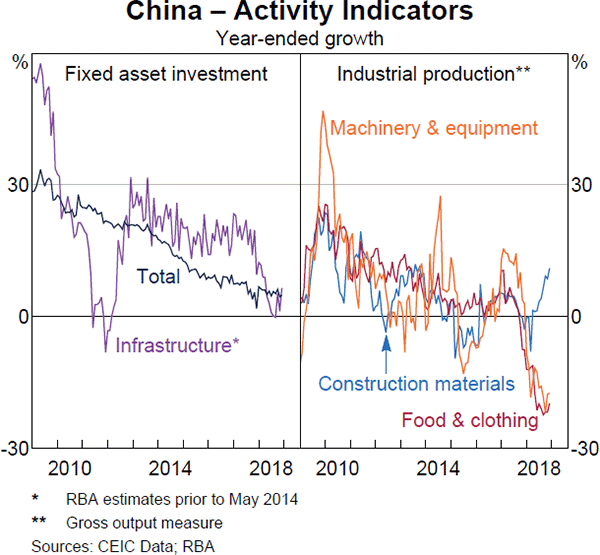
The investment slowdown through most of 2018 was driven largely by lower spending on infrastructure (Graph 1.18). Partly as a result of subdued investment growth, output of a wide range of industrial products fell over the year, and survey measures of Chinese manufacturing conditions declined. However, policies to boost investment, including a series of new approvals for transport projects, have underpinned a rebound in public infrastructure investment in recent months. Stronger spending on infrastructure has, in turn, supported production of construction materials, such as steel, despite localised efforts to cut winter production for environmental reasons.
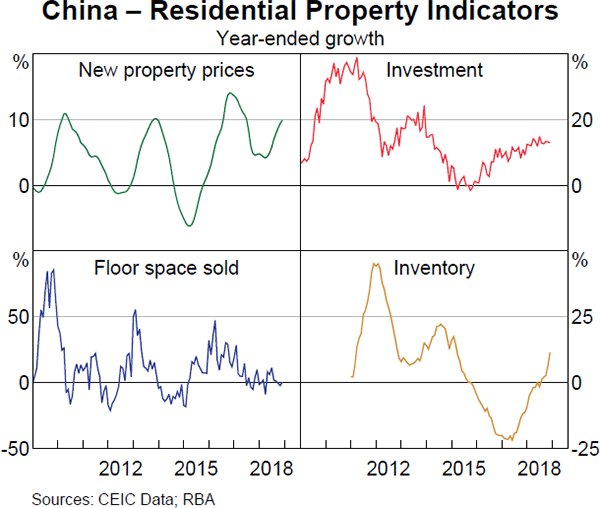
Conditions in Chinese property markets have remained mixed (Graph 1.19). Housing prices have increased further in most cities. Growth in real estate investment has remained strong, but apartment sales have slowed and inventories have begun to accumulate again. Measured growth of real estate investment continues to be mostly driven by growth in spending on land purchases, but spending on construction and fittings has increased a little in recent months. Although some commentators have speculated that the government may loosen property purchase restrictions and loan-to-value ratios in 2019 to help offset weakness in other parts of the economy, the government has not signalled any material relaxation of property regulations.
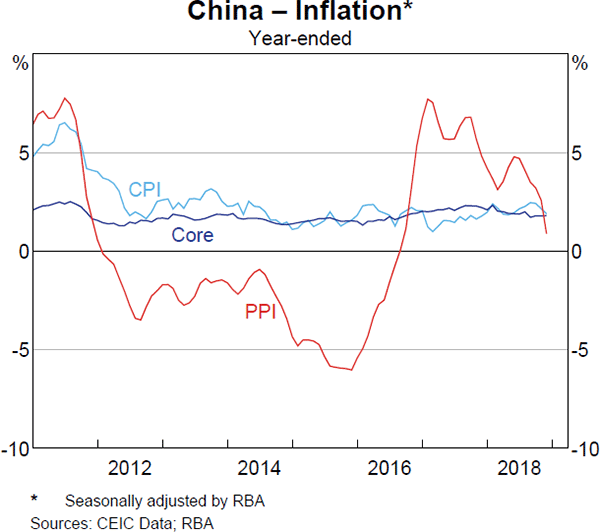
As a result of sluggish demand in the industrial sector and falling global oil prices, producer price index (PPI) inflation has fallen further in recent months (Graph 1.20). The weakness in producer prices has been broad-based; PPI inflation has eased noticeably in the manufacturing, mining and raw material sectors. Core consumer price inflation has been stable but headline inflation has eased, reflecting falling retail fuel prices and the unwinding of weather-related increases in vegetable prices earlier in the year. Food prices may experience some upward pressure in coming months as a result of expected increases in pork prices, reflecting the ongoing spread of the African swine flu.
… partly because availability of finance has tightened
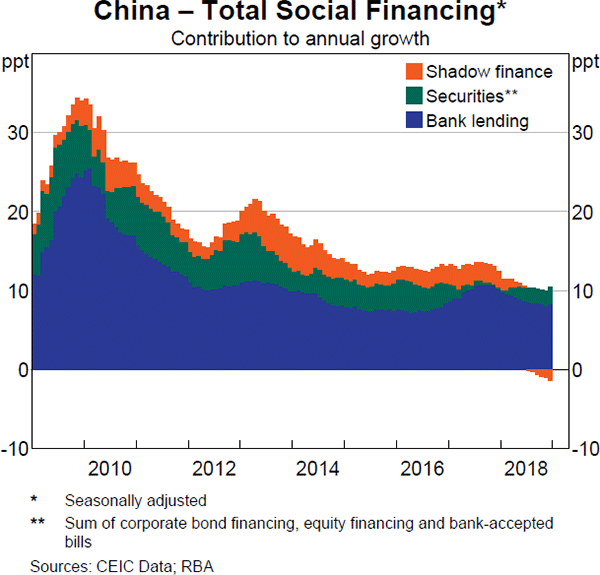
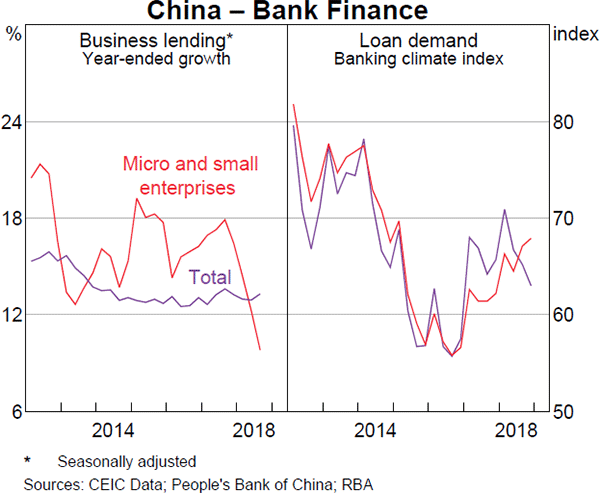
Availability of finance has been tightened in China over recent years as the government has sought to strengthen oversight of risky financial practices and prevent an unsustainable build-up in economy-wide leverage. Together with the structural factors weighing on growth, this has been an important driver of slowing momentum in the Chinese economy. In particular, ‘shadow finance’ has continued to contract, following a tightening of regulatory scrutiny over the past year (Graph 1.21). While bank lending has been solid overall, driven by lending to households, growth in lending to businesses has fallen, mainly due to a sharp deceleration in lending to micro and small-sized enterprises (MSEs). The slowing in lending to MSEs has reflected banks' more general reluctance to lend to higher-risk borrowers, especially in the private sector, following authorities' efforts to reduce risks in the financial system. According to the People's Bank of China's (PBC) banking climate index, MSEs' demand for credit has increased over the past year, while loan demand from medium and large enterprises has declined (Graph 1.22).
Policy is responding with targeted easing measures
Chinese policymakers have introduced further targeted measures to support weaker areas of the economy. In recent months, the central government has approved a series of rail expansions and other transport infrastructure projects. The authorities have also foreshadowed a substantial increase in the issuance of local government special bonds to finance infrastructure investment. The State Council approved a partial quota for local government bond issuance in 2019, which has allowed local governments to bring forward their bond issuance by several months. In addition to boosting fiscal spending, in recent months the government has increasingly focused on tax cuts as a means of supporting growth. In January, the State Council announced a package of new measures to reduce the income tax and value-added tax burden on smaller and private firms.
A number of policies have focused on improving financing conditions for the private sector and, in particular, MSEs. The authorities have called for at least half of all new bank loans to businesses to be allocated to private enterprises within three years (double the current share of outstanding business loans to private firms). They have also instructed banks to lower interest rates for MSEs. The PBC has established a new targeted medium-term lending facility, which provides access to funding on attractive terms for banks that lend to MSEs.
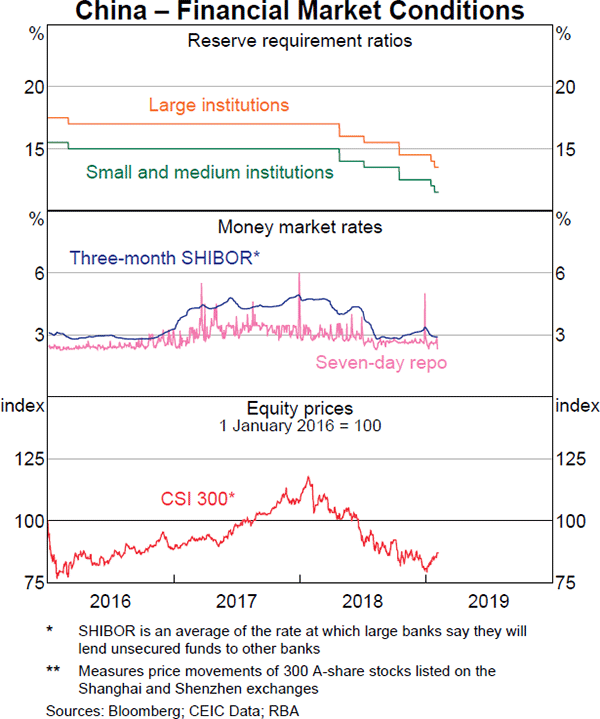
More generally, the PBC has sought to ensure that there is ample liquidity in the financial system. In January, it announced two unconditional 50 basis point reductions in banks' reserve requirement ratios (Graph 1.23). Money market rates have remained at low levels. Bond yields on government and higher-quality corporate debt have declined, in part reflecting the authorities' easing measures and amid continued slowing in domestic growth and inflation. Meanwhile, Chinese equity prices have been little changed on balance since early December, following large declines earlier in 2018.
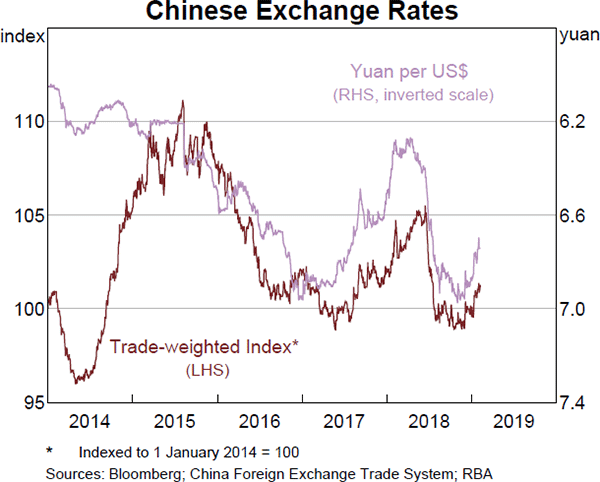
The Chinese renminbi has appreciated a little since the beginning of the year alongside signs of some progress on US–China trade negotiations and a modest but broad-based depreciation of the US dollar (Graph 1.24). The renminbi depreciated last year amid concerns about economic growth and trade tensions, as well as a narrowing of differentials between Chinese Government bond yields and those of advanced economies. China's foreign exchange reserves have remained stable at around US$3 trillion and private capital outflows have remained modest compared to the period of significant depreciation of the renminbi in 2015–16.
Financial conditions in emerging market economies have stabilised, but risks remain
In recent months, emerging market currencies have appreciated somewhat, equity prices have risen, bond yields have declined and capital outflows have moderated (Graph 1.25). These developments have reflected lower policy rate expectations in the United States and elsewhere, a modest depreciation of the US dollar, a slight easing in US–China trade tensions and the decline in oil prices (which benefits those economies that import oil). Political risks to fiscal positions have also eased in some places, with newly elected administrations in Brazil and Mexico emphasising fiscal responsibility.
Some emerging markets with relatively acute vulnerabilities have continued to undergo significant macroeconomic adjustment following the bout of financial stress last year. In Turkey and Argentina, sharp currency depreciations in 2018 added to inflationary pressures and increased the financing burden associated with unhedged foreign currency debt, leading policymakers to significantly tighten monetary policy. Argentina also received an IMF financial package on the condition of a significant fiscal tightening. In turn, economic growth has slowed sharply in both countries and current account deficits have narrowed.
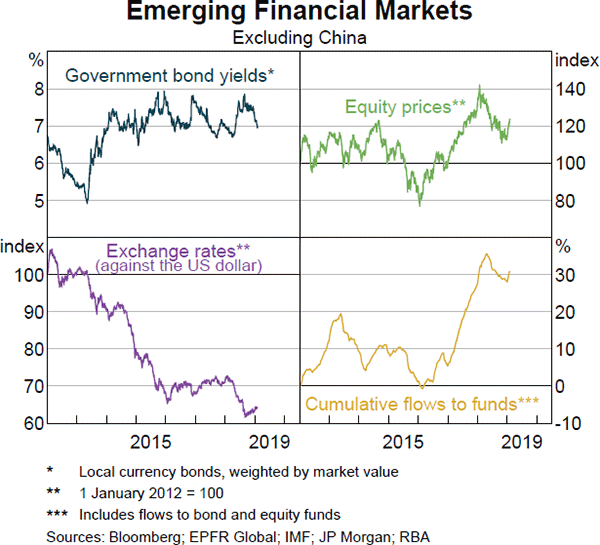
For many other emerging economies, the tightening of financial conditions over 2018 has had a more limited flowthrough to the real economy. In particular, growth in emerging market economies in Asia has remained relatively resilient. For these economies, the tightening in financial conditions has been less pronounced than in some more vulnerable emerging markets. This resilience reflects low external financing vulnerabilities, generally strong institutional frameworks, sustainable fiscal positions and low and stable inflation.
Nevertheless, there remains a risk that financial conditions in emerging markets could tighten further in the period ahead. Concerns persist over trade tensions and that there could be a more marked slowdown in global growth, particularly in China. Emerging markets in Asia may be more exposed to these risks given their integration into global supply chains, which often include China. Political developments are also likely to remain a focus in the year ahead because elections are expected in a number of emerging markets, including in Asia.
Growth in east Asia eased a little over 2018
In the east Asian region, softer external demand has weighed on growth in most high- and middle-income economies. Export growth, while still strong, has eased and surveyed new export orders have fallen sharply to below-average levels in much of the region (Graph 1.26). Industrial production growth and surveyed business conditions have also declined in recent months, but remain around average.
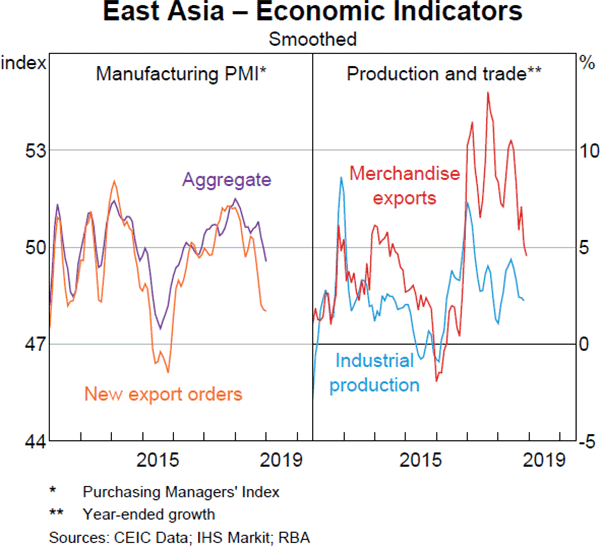
In Korea, weaker external demand, particularly for semi-conductors, has weighed on the business sector. Business investment fell over 2018, largely because previous investment initiatives to increase productive capacity in the electronics sector were completed. Construction investment also fell in 2018, following changes to real estate and property taxes aimed at cooling the housing market. Moreover, there has been a considerable decline in Korean consumer confidence, following the sharp weakening in private sector employment growth since early 2018. Despite this, the preliminary estimates point to year-ended GDP growth picking up in the December quarter, partly due to stronger growth in public spending, which follows the introduction of targeted stimulus measures to support business investment (Graph 1.27). Investment growth has generally been strong in the rest of the region.
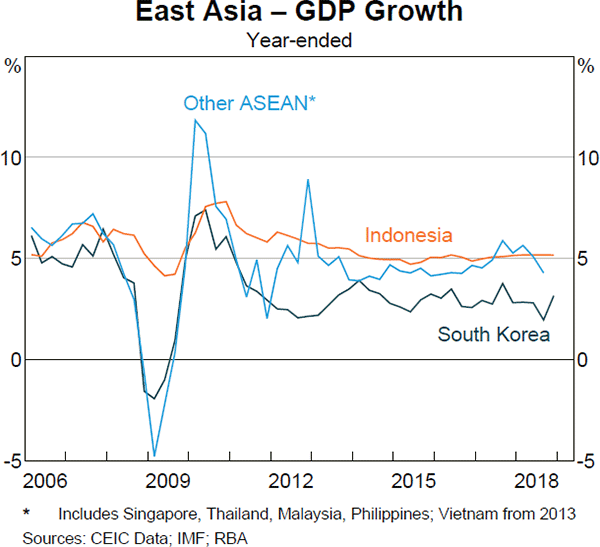
In contrast to the rest of the region, growth in Indonesia has been steady, driven by consumption growth and a broad-based increase in investment growth for both machinery & equipment and buildings & structures. Indonesia undertook a range of measures over 2018 to support capital inflows and stabilise the rupiah exchange rate. An increase in the policy rate has had a very limited pass-through to banks' lending rates, and therefore has not weighed much on domestic activity.
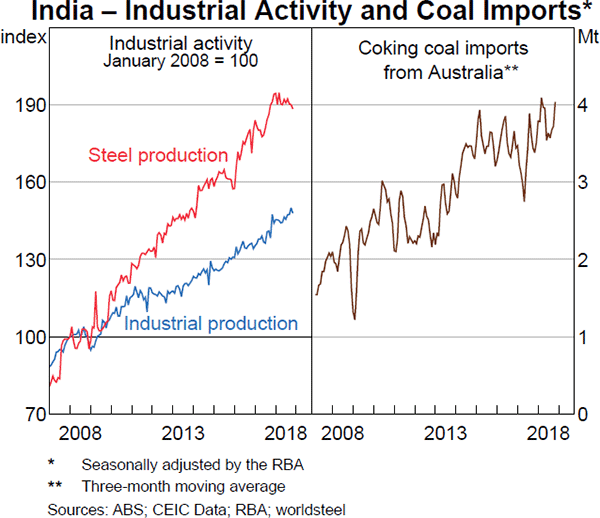
Indian growth remains robust, but conditions have softened at the margin
Growth in India has eased in recent quarters. Private consumption growth has declined a little, partly due to earlier increases in fuel prices, and despite a reduction in the GST on a range of household goods. In contrast, investment growth remains strong and continues to support industrial production (Graph 1.28). Crude steel production in India has moderated a little in recent months, but output remains at high levels, which is supporting coking coal imports from Australia. The merchandise trade deficit narrowed a little in the December quarter, reflecting falls in both oil and non-oil imports. Indian export shipments have grown solidly over the past year, but have moderated a little in recent months, possibly related to the slowdown in global trade.
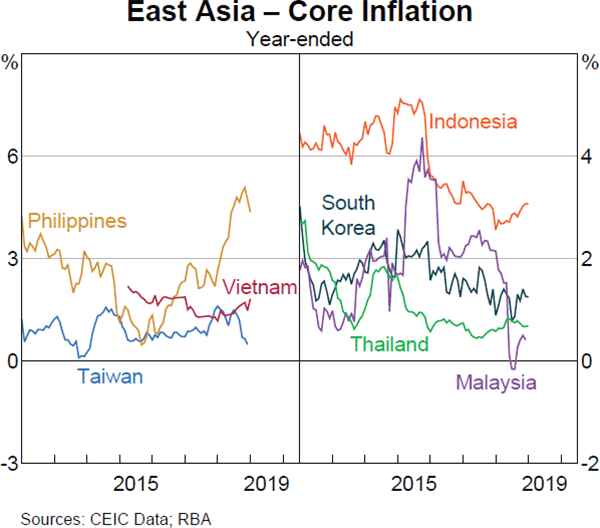
Inflation is generally subdued in Asia
Inflation remains generally subdued in Asia, other than in the Philippines and India. Inflation in the Philippines has eased, following substantial monetary tightening since the start of the year, although it remains above the central bank's target as a result of domestic demand pressures (Graph 1.29). Inflation has been volatile in Malaysia due to changes in consumption taxes and has been quite low in recent quarters.
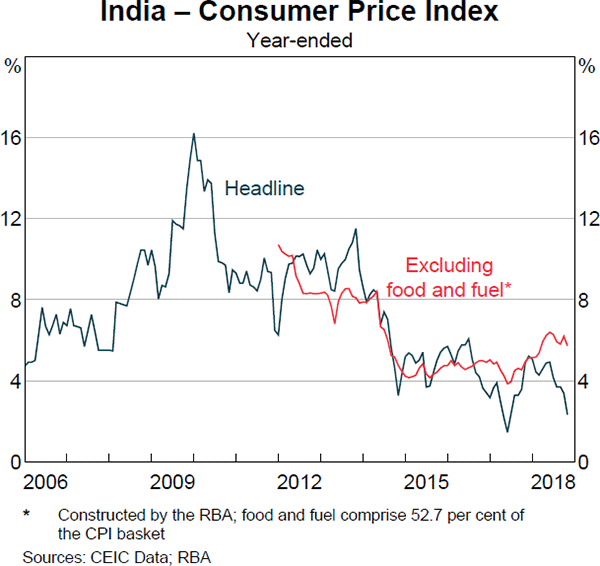
Indian CPI inflation moderated further in November as a result of falling food prices and easing retail fuel price inflation (Graph 1.30). The Reserve Bank of India expects headline inflation to remain below its target of 4 per cent (+/−2 per cent) until the second half of 2019, but has warned that recent food price falls could reverse quickly. Core inflation has also eased but remains elevated.
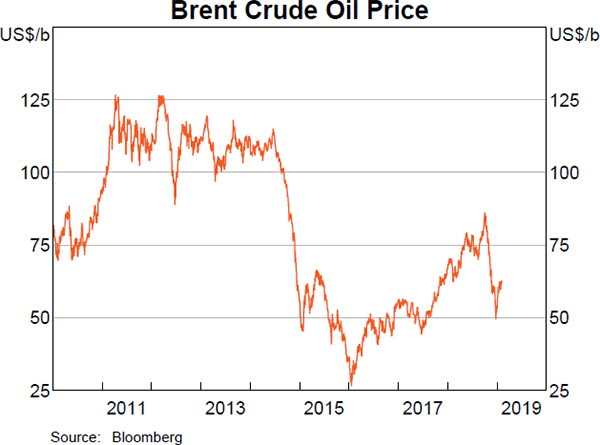
Oil prices have declined significantly in recent months
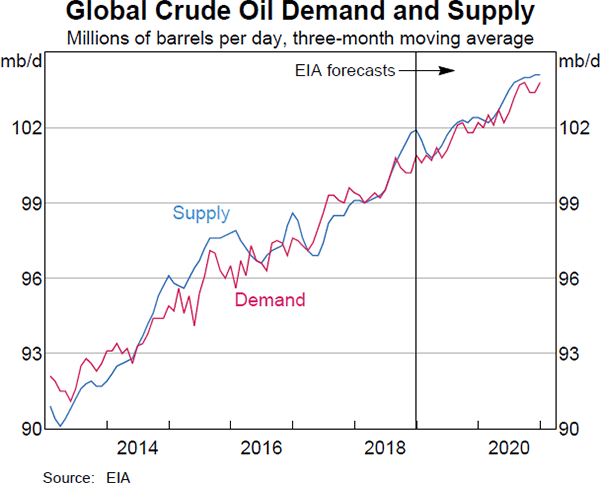
Oil prices have fallen significantly since the previous Statement, but have increased somewhat in recent weeks (Graph 1.31). The global supply of oil increased over the second half of 2018 because production increased in a number of countries, particularly in the United States (Graph 1.32). At the same time, expectations for more moderate global growth have weighed on the outlook for global oil demand. In response to recent falls in oil prices, OPEC and a number of non-OPEC countries agreed in December to cut production by 1.2 million barrels per day. However, global production is expected to be sustained at high levels. Over recent weeks, prices have been supported by Saudi Arabia increasing its commitment under the OPEC production cuts.
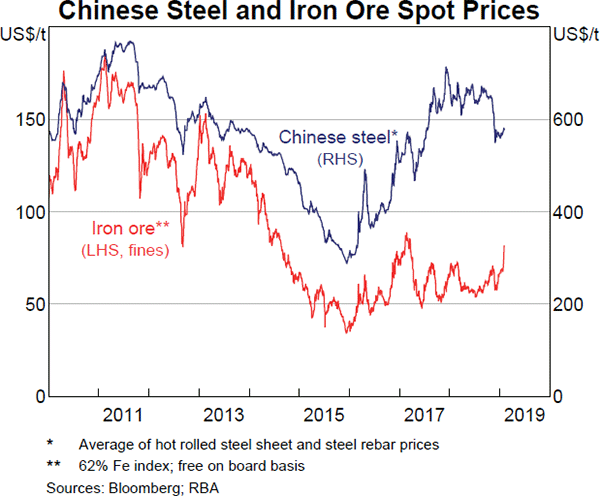
Iron ore prices have increased sharply but other commodity prices have been mixed
The benchmark iron ore spot price has increased strongly since the previous Statement (Graph 1.33; Table 1.1). Iron ore prices had declined in mid November, alongside a sharp decline in Chinese steel prices, but received some support late in the year as Chinese steel makers increased their demand for iron ore ahead of a seasonal pick-up in production. More recently, however, prices have increased sharply after a tailings dam collapse resulted in the closure of a number of iron ore mines in Brazil. Collectively these mines account for around 4½ per cent of global seaborne supply. While increased production at other Brazilian mines may offset some of this production loss, there remains significant uncertainty around the outlook for seaborne iron ore supply and prices, particularly with iron ore markets currently closed for Chinese New Year.
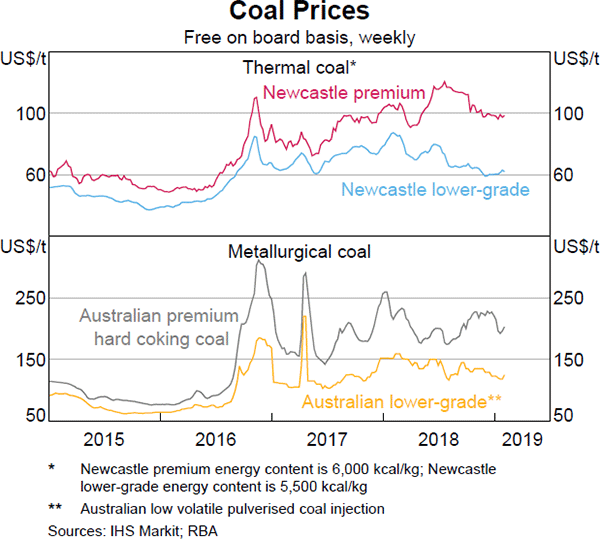
Coal prices have declined since the previous Statement (Graph 1.34). Nonetheless, the spot price of Newcastle premium thermal coal remains elevated, reflecting relatively steady growth in demand and limited growth in supply. Market reports suggest that one factor supporting prices for higher-quality thermal coal has been a shift in demand towards higher-calorific low-ash coal as countries look to reduce pollution and achieve more stringent environmental targets. This shift has contributed to a wider price differential between premium and lower-quality thermal coal. The spot price for premium hard coking coal is lower than its recent peak in early December, reflecting some easing in supply constraints; the constraints were mainly due to Australian port maintenance.
Base metal prices are little changed since the previous Statement. Rural prices have increased because dry conditions in Australia and abroad have reduced the supply of a number of rural commodities.
| Since previous Statement | Over the past year | |
|---|---|---|
| Bulk commodities | 8 | 10 |
| – Iron ore | 21 | 21 |
| – Coking coal | −5 | −2 |
| – Thermal coal | −2 | 0 |
| Rural | 4 | 5 |
| Base metals | 1 | −10 |
| Gold | 8 | 4 |
| Brent crude oil(b) | −11 | −8 |
| RBA ICP | 1 | 5 |
| – Using spot prices for bulk commodities | 4 | 9 |
|
(a) Prices from the RBA Index of Commodity Prices (ICP); gold, oil and
bulk commodity prices are spot prices Sources: Bloomberg; IHS Markit; RBA |
||
Australian export prices (including the prices of non-commodity exports) are expected to have increased in the December quarter. Export prices are still likely to decline over the next few years as Chinese demand for bulk commodities eases and further global supply comes online; bulk commodities represent around one-third of Australia's total export values. The value of Australia's oil-related exports, including LNG exports, now exceeds the value of oil-related imports; the fall in oil prices therefore reduces Australia's terms of trade. Nonetheless, the terms of trade are expected to remain above their early 2016 trough (see ‘Economic Outlook’ chapter).