RBA Annual Conference – 1995 The Determinants of Long-Run Growth Steve Dowrick
1. Introduction
Discussions of economic growth usually focus on differences in growth performance. The rapid growth of the 1960s is typically contrasted with the slowdown of the 1970s and 1980s. We contrast the super growth of Asia with the sluggish growth of the European and North-American economies and the economic regression of Africa. In Australian policy discussions, it is particularly common to contrast our comparatively modest rate of economic growth over the past 20 years with the dynamic performance of the leading East-Asian economies. From this perspective, it is natural to examine the institutional and policy differences between countries in order to isolate those features that mark the successful growth economies. From there it is typically a short, albeit courageous step, to advocating adoption of those policies and institutions that appear to be stamped with the hallmark of success.
I want to suggest that it is also possible to view the post-war evidence in a rather different light, one that emphasises similarities rather than differences. It is possible to view a substantial part of the development record over the past 40 years, in particular the growth experience of the Asian, European and OECD economies, as following a common development path of take-off, acceleration and subsequent maturation and slowdown. Of course, at any one time, countries and regions are at different stages of development, but there are strong similarities in the rate of progress along the path of industrialisation and technical progress.
From this perspective, many of the growth differentials between countries and between periods are seen to be what I loosely term semi-exogenous. Part of observed growth rates are exogenous inasmuch as they are influenced by the initial conditions, particularly the level of productivity from which the economy is starting. Of course, the initial conditions do not fully determine subsequent growth. There are many policy choices and economic decisions (as well as truly exogenous acts of nature and fortune) that will influence growth. These endogenous elements will then influence the starting point for the subsequent period. It is in this sense that I refer to the initial conditions as semi-exogenous.
The past decade has been the occasion of substantial development in the theorising and testing of explanations for economic growth. We have progressed far enough to be able to roughly allocate the observed variation in growth rates into three camps. Approximately one third of the variation is attributable to the initial conditions, or the position on the development path: this is the semi-exogenous element of growth. Another third of the variation, perhaps a little more, is explicable in terms of economic decisions, policies and institutions: this is the endogenous element of growth which is capable of theoretical and empirical explanation. It is the terrain over which both theoreticians and applied economists dispute with their rival models and explanations. Occasionally these disputes lead to provisional claims on some part of the previously unchartered territory, but the final third of the variation in growth remains largely unexplained. This miracle or disaster element constitutes the area of ignorance to the national accountant; it is the residual in the regression of the econometrician. Unexplained growth is of course grist to the mill of the politician or public commentator who can claim that the key to economic performance lies in their pet love or hate, whether it be the breakdown of the family or the culture of Confucionism or the cure-all properties of microeconomic reform.
Indeed, many commentators attempt to stake out additional territory for their pet claims by ignoring the first of these fields of explanation – the extent to which growth is semi-exogenous and dependent on the stage of development of the economy. This can lead to potentially misleading and harmful conclusions. For example, naive comparisons of Australia's current rate of economic growth with that of the fast-growing economies can lead to suggestions that we should be aiming at macroeconomic policies consistent with Australia growing at a similar rate, ignoring the evidence that a substantial part of the super-growth rates (in the region of 5–10 per cent per annum) of the newly-industrialising economies is attributable to catch-up in technology and factor accumulation which no developed industrial economy can hope to emulate. Such naive comparisons can also be used to argue for inappropriate policies and institutions, mistaking association with periods of high growth for causes of growth. Moreover, these naive comparisons can lead to unduly alarmist conclusions from commentators in the advanced industrial countries. If we project current growth rates forward over 30 years or more, it is easy to conclude that the newly-industrialising economies will both dominate world output and also outstrip the current leaders in productivity and living standards. Such analyses ignore the evidence of slowdown in both population growth and productivity growth as industrialised economies mature. The historical evidence suggests that whilst leadership in productivity and living standards does indeed change hands, the time-scale for such change is typically centuries rather than decades.
In Australia this type of inappropriately naive comparison is frequently made with respect to the neighbouring economies of East Asia, currently the most dynamic growth area in the world economy. Accordingly, I focus a substantial part of my introductory analysis on the thesis that a large part of the current development phase in Asia mirrors the previous growth experience of countries which embarked earlier on the path of industrialisation. In focusing on these common elements I am seeking to identify the strength of the semi-exogenous elements of growth, so that we can more clearly and accurately identify the endogenous contributions to growth in both the developed and fast-developing economies. Having identified the semi-exogenous and endogenous determinants of successful growth paths, we can attempt both to make realistic predictions about future development paths and also draw some policy conclusions.
The empirical analysis presented and surveyed here is related principally to post-1950 growth in Europe, Asia, North America and Australasia. Analysis of this comparatively successful experience of industrialisation and growth sheds some light on the relatively poor performance of the African and Latin American economies, but I do not attempt to tackle the thorny issues of severe underdevelopment and economic mismanagement.
2. Some Stylised Facts on Economic Growth
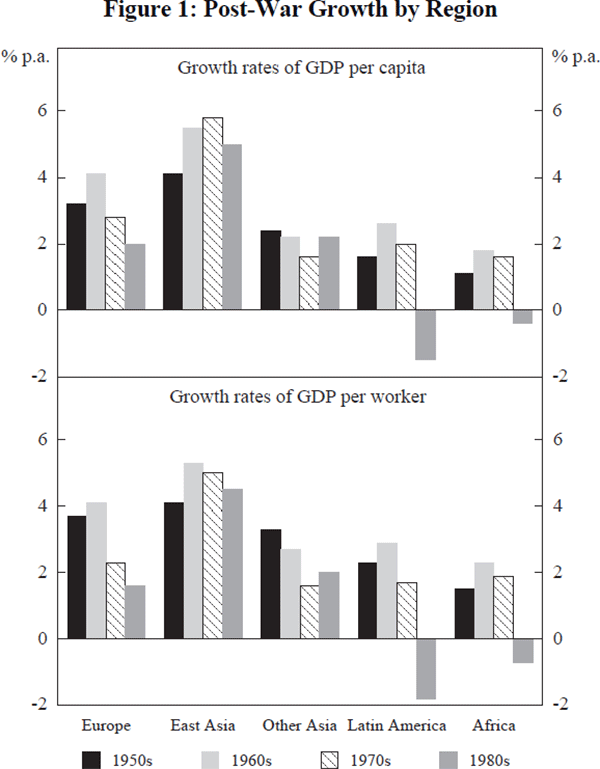
Before presenting evidence of a common development path, I will first set out some of the evidence as it is usually displayed to emphasise differences amongst regions and differences across time. For instance, a dominating feature of world economic growth over the last half century has been the acceleration of growth in the 1960s and the subsequent slowdown. An equally prominent feature of post-war development has been the existence of consistent and substantial differentials in rates of growth by region and by development grouping. Both of these patterns are evident from Figure 1, which displays decade average rates of growth for major geographic and development groupings. The data, by decade and regional grouping, are set out in Table 1. Although the Europe/OECD grouping is somewhat arbitrary, it can be thought of as the group of relatively advanced, ‘Western’, market economies.[1] In some of the diagrams to be shown, this group is labelled ‘Europe’, sacrificing geographic accuracy to save space.
| Initial levels of output per capita and per worker | Growth rates over decade | Investment | Residual growth | |||||||
|---|---|---|---|---|---|---|---|---|---|---|
| RGDP | RGDPW | Pop. % | RGDP % | RGDPW % | Expenditure/GDP | Relative prices | ||||
| Europe and other OECD (27 countries) | ||||||||||
| 1950 | 4,249 | 9,775 | 1.1 | 3.2 | 3.7 | 21.4 | 0.93 | −0.1 | ||
| 1960 | 5,251 | 12,694 | 1.0 | 4.1 | 4.1 | 24.7 | 0.92 | 0.0 | ||
| 1970 | 7,599 | 18,251 | 0.8 | 2.8 | 2.3 | 25.8 | 0.96 | 0.0 | ||
| 1980 | 9,820 | 22,213 | 0.6 | 2.0 | 1.6 | 23.0 | 0.96 | 0.0 | ||
| 1990 | 11,904 | 25,829 | ||||||||
| 1950–90 | 7,764 | 17,753 | 0.9 | 3.0 | 2.9 | 23.7 | 0.90 | 0.0 | ||
| High-performing East Asia (8 countries) | ||||||||||
| 1950 | 1,144 | 2,099 | 1.8 | 4.1 | 4.1 | 20.3 | 1.44 | 0.0 | ||
| 1960 | 1,503 | 3,486 | 2.5 | 5.5 | 5.3 | 21.0 | 1.20 | 1.0 | ||
| 1970 | 2,886 | 6,286 | 2.0 | 5.8 | 5.0 | 28.8 | 1.19 | 1.0 | ||
| 1980 | 5,082 | 10,242 | 1.5 | 5.0 | 4.5 | 30.1 | 1.16 | −0.8 | ||
| 1990 | 8,288 | 16,070 | ||||||||
| 1950–90 | 3,780 | 7,636 | 1.9 | 5.1 | 4.7 | 25.1 | 1.30 | 0.7 | ||
| Rest of Asia (7 countries) | ||||||||||
| 1950 | 651 | 1,587 | 2.1 | 2.4 | 3.3 | 13.2 | 1.68 | 0.3 | ||
| 1960 | 804 | 2,114 | 2.4 | 2.2 | 2.7 | 16.8 | 1.71 | −1.1 | ||
| 1970 | 982 | 2,764 | 2.3 | 1.6 | 1.6 | 18.9 | 1.82 | −1.2 | ||
| 1980 | 1,153 | 3,196 | 2.1 | 2.2 | 2.0 | 22.6 | 2.08 | −1.2 | ||
| 1990 | 1,391 | 3,786 | ||||||||
| 1950–90 | 996 | 2,689 | 2.2 | 2.1 | 2.4 | 17.9 | 1.80 | −0.8 | ||
| Latin America (19 countries) | ||||||||||
| 1950 | 1,906 | 5,380 | 2.8 | 1.6 | 2.3 | |||||
| 1960 | 2,239 | 6,743 | 2.6 | 2.6 | 2.9 | |||||
| 1970 | 2,876 | 8,999 | 2.3 | 2.0 | 1.7 | |||||
| 1980 | 3,484 | 10,410 | 2.1 | −1.5 | −1.8 | |||||
| 1990 | 3,066 | 8,839 | ||||||||
| 1950–90 | 2,714 | 8,074 | 2.5 | 1.2 | 1.3 | 20.1 | 1.30 | −1.2 | ||
| Africa (42 countries) | ||||||||||
| 1950 | 876 | 2,125 | 2.6 | 1.1 | 1.5 | |||||
| 1960 | 913 | 2,162 | 2.4 | 1.8 | 2.3 | |||||
| 1970 | 1,139 | 2,877 | 2.6 | 1.6 | 1.9 | |||||
| 1980 | 1,410 | 3,657 | 2.8 | −0.4 | −0.7 | |||||
| 1990 | 1,428 | 3,577 | ||||||||
| 1950–90 | 1,153 | 2,880 | 2.6 | 1.0 | 1.2 | 19.8 | 2.42 | −1.2 | ||
| World (103 countries) | ||||||||||
| 1950 | 1,765 | 4,193 | 2.1 | 2.5 | 3.0 | 18.3 | 1.40 | 0.1 | ||
| 1960 | 2,142 | 5,440 | 2.2 | 3.2 | 3.4 | 20.8 | 1.30 | 0.0 | ||
| 1970 | 3,096 | 7,836 | 2.0 | 2.8 | 2.5 | 24.5 | 1.30 | −0.1 | ||
| 1980 | 4,190 | 9,944 | 1.8 | 1.5 | 1.1 | 25.2 | 1.40 | −0.1 | ||
| 1990 | 5,215 | 11,620 | ||||||||
| 1950–90 | 3,282 | 7,806 | 2.0 | 2.5 | 2.5 | 22.2 | 1.30 | 0.0 | ||
| Note: RGDP is real GDP per capita in 1985 int$; RGDPW is real GDP per member of the labour force; Pop. is population; investment shares are in local current prices; relative prices refer to the implicit price deflator for investment relative to that for GDP. The centrally-planned economies and the middle-eastern oil exporters have been excluded. All measures are unweighted country averages. | ||||||||||
The upper panel in Figure 1 refers to the growth of real output per head of population, the most commonly used measure of development in recent studies of economic growth. The data are taken from the most recent version (PWT5.6a) of the Penn World Tables, as described by Summers and Heston (1991). The principal feature of these data is that cross-country comparisons of GDP levels are evaluated at a common set of international prices, avoiding the well-documented phenomenon by which exchange rate comparisons of less-developed economies consistently under-value the non-traded goods sector, especially labour-intensive and relatively cheap services. This relative price effect can be very significant. For example, an exchange rate conversion in 1985 would have placed Indian GDP around US$300 per capita, less than 2 per cent of US income. The purchasing power parity comparison, measuring GDP at international prices, gives a measure over int$900, more than 6 per cent of US GDP levels.[2]
International price measures of growth rates, on the other hand, are typically fairly close to the national accounting measures of real growth, based on domestic prices (see Nuxoll (1994) for a detailed discussion). The PWT growth rates differ from domestic measures of real growth principally because they attach different weights to the growth components of private consumption, government consumption and total investment. In most cases, however, there is relatively little difference between PWT growth rates and domestic constant price measures.
One case where PWT growth rates do differ very substantially from national accounts is the case of China. The PWT estimate of the real annual growth rate of GDP over the 1980s is 4.5 per cent whereas the IMF report a real growth rate of over 8 per cent. The difference here is less to do with relative price weights than with the PWT authors' disbelief in the system whereby ‘… production units often report their own estimates of real output. These estimates usually begin with the current price increase in output and then decide on how much of this is due to output growth including quality improvements and new products. It is thought that this reporting system leads to overstatement of output growth …’. They have accordingly reduced reported investment growth rates by 40 per cent and consumption growth by 30 per cent, leaving growth rates in exports and imports unchanged.
The lower panel in Figure 1 refers to labour productivity, measured here as real output per member of the labour force. The latter measure is more relevant to economic explanations of growth which are largely based on supply-side theories of productivity growth. The analysis that follows will concentrate on the productivity measures. In most cases, the growth of per capita GDP is very close to the growth of labour productivity. The principal exceptions occur in those countries undergoing a demographic transition whereby falling birth rates lead to lower dependency rates and increased rates of labour-force participation. In these cases, productivity measures are a better measure of technological development than per capita incomes. Unfortunately, data on hours of work are not available for this spread of countries and years, so labour productivity is measured on a per capita rather than per hour basis.
The productivity data display a consistent pattern of acceleration followed by deceleration over the four post-war decades. Nearly all countries experienced a surge in productivity growth in the 1950s and, especially, the 1960s. Having experienced per capita growth rates of around 4 per cent per annum for the two post-war decades, the industrialised nations were typically dismayed to find that growth slowed down to 2 per cent or less in the 1970s and 1980s.
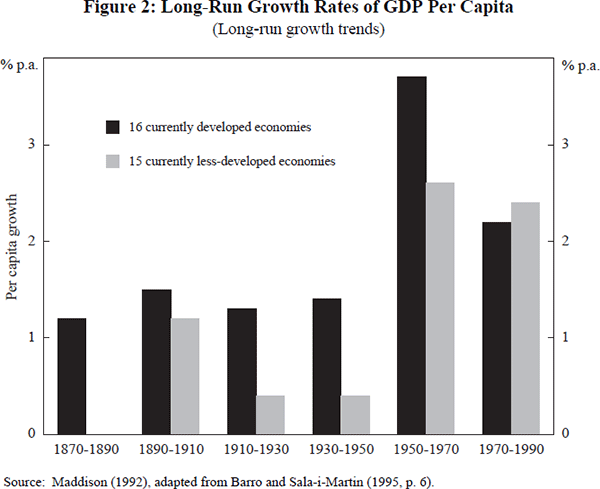
At the time, the productivity slowdown was variously blamed on the OPEC oil exporters who had succeeded in raising the real price of oil tenfold and also, in Europe and Australia especially, on trade unions and a range of government policies. In retrospect, however, it is apparent that post-1974 growth is still somewhat above historically normal rates. Maddison's (1992) data on long-run growth trends over the past 120 years suggest that growth of just over 1 per cent per year is the norm rather than the exception. His data are summarised in Figure 2. Whilst the current rates of growth in the industrialised economies seem slow both in relation to the 1960s, and in relation to the much vaunted growth rates of 6–8 per cent of some newly-industrialised economies, it should be borne in mind that 2 per cent growth still leads to a doubling of real output and income over a generation of 35 years.
The post-war acceleration and subsequent slowdown were very noticeable, and subject to much anguished analysis, in the advanced economies of Europe, North America and Australasia. The slowdown has also been pronounced in the less-developed economies of Asia, Latin America and Africa. Even the high-growth economies of East Asia have experienced a levelling off or slight diminution in growth rates in the 1980s, and a substantial slowdown in the case of Japan.
Whilst patterns of accelerating and then decelerating growth have been common trends amongst almost all geographic and development groupings, Figure 1 shows that the East-Asian economies have consistently grown faster than the industrialised economies of Europe and the OECD, and Latin America and Africa have consistently grown slower. This means that the income gap between the richest and poorest groups of nations – Europe and Africa – has increased over the past 40 years, whilst the Asian economies have overtaken Latin America and have started to close the gap with Europe and North America, very dramatically in the case of the most successful East-Asian economies.
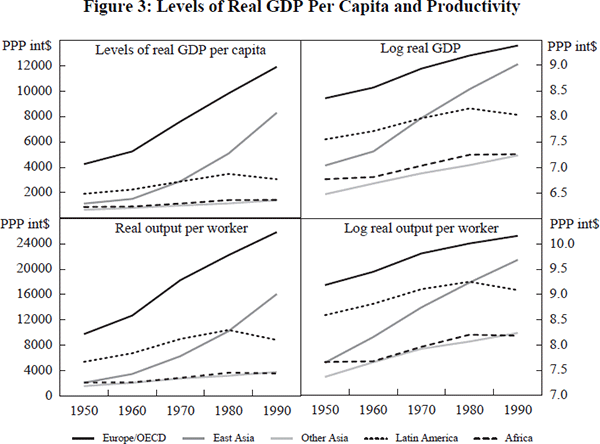
Figure 3 displays per capita income and productivity in real dollars for the major regional groupings. The most pronounced feature of these figures is the dramatic rise of the successful East-Asian economies. Average East-Asian income levels have reached those typical of Europe in the mid 1970s, whilst productivity levels are now typical of Europe in the mid 1960s (the difference reflecting higher labour-force participation in these Asian economies). Income and productivity are also shown on a logarithmic scale to give an indication of proportional differences (and proportional rates of growth).
The picture with respect to the distribution of world income has been one of disparate development. The overall dispersion of world income has increased as the world's poorest economies, predominantly in Africa, have fallen even further behind the industrialised nations and the middle-income Latin American economies struggled to grow even in the boom-time of the 1960s and collapsed into negative growth in the 1980s. On the other hand, at the upper end of the world income distribution, particularly amongst the relatively advanced economies of Europe and North America (and Oceania), convergence has been the predominant trend.
This pattern of divergence at the lower end of the income distribution, and convergence at the upper end of the distribution, is evident in the relationship between the starting level of productivity and the subsequent rate of growth. A positive relationship indicates that the poorer countries are falling behind and that income levels are diverging. A negative relationship indicates that the poorer countries are catching up and that, ceteris paribus, levels of productivity and income are converging.[3]
Figure 4 displays the levels/growth relationship for the four major regional groupings of Africa, Asia, Latin America and Europe/OECD. Growth in Africa and Latin America is highly variable, with many episodes of negative growth, but displays no evidence of any systematic relationship with starting levels of productivity. A consistent pattern of within-group catching-up is clearly evident only amongst the advanced industrialised economies. Given this strong trend of catching-up, it is apparent from Figure 4 that Australia's modest rate of productivity growth, averaging 1.6 per cent per year since 1950, is in fact fairly typical for a high-productivity economy.[4]
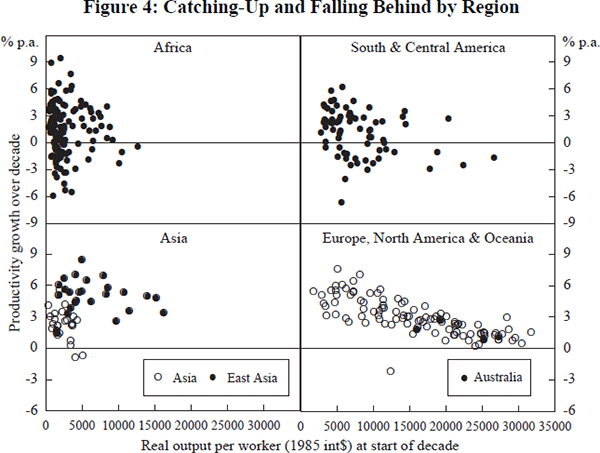
It is likely that some part of the measured productivity slowdown as economies mature is due to problems of national accounting measurement. For instance, people may take the benefits of higher productivity and living standards in the form of early retirements, shorter working weeks, longer holidays, and a more pleasant working environment. None of these changes will typically show up in standard national accounting measures of economic output. Moreover, as output of the advanced economies becomes more and more concentrated in the service sector, problems of measuring improvements in the quality of output typically become more severe. We can expect these biases to understate the rate of growth of the more advanced economies, and hence to overstate the true rate of convergence. (For a detailed discussion of these issues, see Castles in this Volume.)
However, the magnitude of the understatement of true growth is not likely to exceed one percentage point in annual growth. Furthermore, any such bias is also likely to affect developing economies. So it seems unlikely that the bias is of sufficient magnitude as to undermine the evidence that catch-up growth is highly significant for the Europe/OECD group.
Figure 4 also shows an interesting relationship between productivity levels and growth for the Asian economies. There appears to be some falling-behind at the lower end of the distribution and catching-up at the higher end, with the fastest rates of growth occurring at annual productivity levels around int$5,000 per worker. But as the high-performing Asian economies achieve higher productivity levels there is evidence, strongest in the case of the development leader, Japan, that growth rates are slowing towards rates more typical of the advanced industrial economies of the OECD. Indeed, over the past five years, which are not included in the data set used here, Japanese productivity growth has slowed to under 2 per cent.
This raises the important question of whether the current super-growth of the East-Asian economies is bound to slow. It is instructive to compare the performance of the Asian economies with Europe's experience of economic development. All of the Asian economies are now at a level of development similar to that achieved by European/OECD economies one or more decades ago. For instance, Thailand has by now reached a level of development, as measured by real labour productivity of around int$16,000 per worker, similar to that of Ireland and Spain in the 1950s, Greece and Yugoslavia in the 1960s, and Turkey in the 1970s. Aggregate productivity levels in Japan and Singapore at the beginning of the 1980s were around int$16,000 per worker, comparable to those experienced in Italy in 1970 and Germany some ten years earlier.
How does the impressive growth performance of the East-Asian economies compare with that of the European/OECD economies at a similar stage of development? Figure 5 combines the growth data of the Asian economies with that of the European/OECD group, again relating growth over a decade to the starting level of productivity. There is a fairly strong pattern of moderate growth for the low-productivity economies, those starting below int$4,000 per worker typically growing around 3 per cent per year. Rapid acceleration is common when annual output per worker reaches somewhere between int$4,000 and int$10,000, with growth rates typically around 5 per cent. Then a slowdown occurs at higher levels of development, tailing off towards growth rates of between 1–2 per cent.
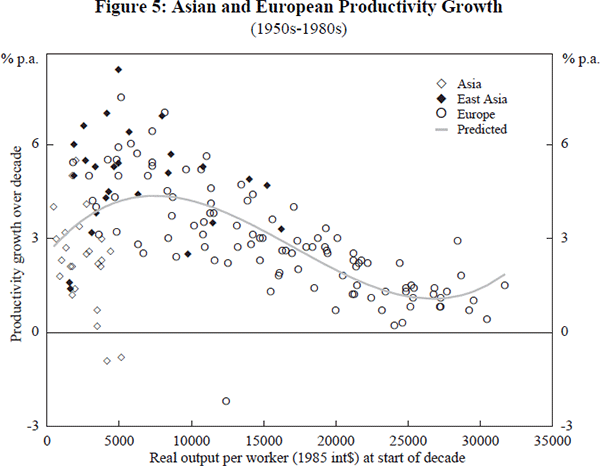
This pattern is consistent with the notion of a take-off stage of economic development. Arguments from a wide range of authors including Abramovitz (1986) and Lucas (1988) suggest that, at some point in economic development, the advantages of backwardness are outweighed by the disadvantages. The advantages consist primarily of the availability of a pool of advanced technological knowledge that has been researched, trialed and developed in the advanced economies and is available to the laggard economies either as free public knowledge or else as technology embodied in capital goods. The disadvantages of backwardness, on the other hand, consist of the fact that modern technologies are strongly complementary with local capital stocks, both physical and human. Physical infrastructure such as communications networks, equipment repair facilities and reliable power supplies are essential prerequisites. So too may be the existence of a well-educated and trained labour force. But the high fixed costs of providing this basic physical and human infrastructure renders the advantages of technology transfer inaccessible to the poorest economies.
This notion of a development threshold and subsequent slowdown is related also to stages of industrialisation, particularly the transfer of labour and capital from agriculture into industrial production and then increasingly into the services sector. Those developing economies which are able to invest in the pre-conditions for rapid industrialisation are enabled to grow very rapidly. But as they continue to siphon the pool of technology transfer and begin to operate on the leading edge, they have to increasingly look to their own research and development and growth must inevitably slow down.
The hypothesised pattern of development can be modelled very simplistically by expressing
growth as a cubic function of the level of productivity. Using pooled data
for 15 Asian economies and 27 European/OECD economies, a cubic regression is
estimated in which real labour productivity at the beginning of the decade,
y0, is regressed on average annual growth in the subsequent
decade,  . The results are
reported in Table 2.
. The results are
reported in Table 2.
| Estimation method | OLS |
|---|---|
| n | 155 |
| Regression coefficient (t-statistics): | |
| y0 | 5.5 (4) |
 |
−4.7 (−5) |
 |
−0.9 (5) |
| Constant | 2.5 (6) |
| Summary statistics: | |
 |
0.35 |
| s.e. | 1.48 |
| Note: t-statistics are corrected for heteroscedasticity. | |
This relationship is also plotted in Figure 5. It is of course a highly stylised description of the post-war pattern of development. In particular, the turning-up of the regression line above productivity levels of int$30,000 per worker is a spurious artifact of the cubic functional form. The actual data show a levelling off of growth rather than any turning-up. This description also ignores many important influences on growth such as differences in savings rates, education, openness to trade, changes across decades in the underlying rate of technical progress, etc. These important influences on growth will be discussed in subsequent sections. For the moment, however, it demonstrates that the simple notion of a non-monotonic development path is capable of explaining approximately one-third of the observed variance in rates of growth. Moreover, it helps a preliminary assessment of the extent to which the ‘East-Asian miracle’ of the past few decades has in fact been exceptional.
It is certainly the case that most of the East-Asian observations displayed in Figure 5 lie above the regression line. But so do many of the observations for European economies at a similar level of development. For every fast-growing East-Asian economy, there is a European/OECD counterpart which exhibited equally rapid growth at a comparable level of development, a decade or two earlier. Moreover, as the East-Asian economies have matured, particularly in the case of Japan, there is evidence that their rates of growth have begun to tail off.[5]
A possible conclusion is that the recent growth of the high-performance East-Asian economies simply parallels that of the more successful European economies during the period of post-war reconstruction and catch-up. On the other hand, this ‘parallel development’ might be overly influenced by changes in exogenous rates of technical progress, with the rapid European growth of the 1950s and 1960 owing more to exogenous technical progress than to any consistent pattern of development. We can attempt to test for this possibility by extending the simple regression analysis to include fixed-decade effects, capturing common exogenous shifts in technical progress, as well as regional dummies. The decade dummy variables are defined as D50=1 for the 1950s, etc. and the regional dummies are also set to unity. The results of the growth relationship are reported in Table 3.
| Estimation method | OLS |
|---|---|
| n | 155 |
| Regression coefficient (t-statistics): | |
| y0 | 1.6 (1.0) |
|
−2.4 (−2.1) |
|
0.5 (2.4) |
| D50 | 0.4 (0.9) |
| D60 | 0.9 (2.5) |
| D70 | 0.1 (0.2) |
| East Asia | 0.7 (1.8) |
| Other Asia | −2.1 (−3.8) |
| Constant | 3.8 (5.0) |
| Summary statistics: | |
|
0.54 |
| s.e. | 1.25 |
| Note: t-statistics are corrected for heteroscedasticity. | |
The suggested relationship between growth and level of development is actually quite similar to that previously estimated, with growth predicted to peak at 4.1 per cent per annum for a European/OECD country with productivity around int$4,000 per worker, tailing off to growth of 1.1 per cent per annum at productivity levels around int$20,000. Although the individual t-statistics are lower than in the previous regression, the productivity variables are jointly highly significant (F3,146=22; p<0.00000).
It is surprising to find that only one of the period dummies is statistically significant. This implies that exogenous technical progress, unrelated to the level of development, was roughly the same in the 1950s as in the 1970s and 1980s. Furthermore, the magnitude of the acceleration and subsequent slowdown in exogenous technical growth in the 1960s is estimated to be substantially smaller than the raw data suggest, the purely exogenous part of the slowdown being less than one percentage point on annual rates of growth. The suggestion here is that most of the slowdown in world economic growth since the 1960s, in particular the slowdown amongst OECD economies of the order of magnitude of over 2 percentage points per annum, can be explained by diminishing opportunities for technological catch-up. As more and more economies slide down the technology-gap curve in Figure 5, average rates of growth have inevitably declined.
Much of the difference between Asian and European growth rates can also be explained as the consequence of being at different stages of development. Taking all Asian economies together, there is little discernible difference in Figure 5 between their pattern of development and that of the post-war economies of Europe and the OECD. Indeed a dummy intercept term for Asia is completely insignificant, with a point estimate of 0.08 and a t-statistic of 0.2.
We can get significant regional differences if we divide the Asian economies into two groups, the high-performing East-Asian economies which have attracted so much attention of late, and the sample of other Asian economies for which productivity data were available. The latter group was a consistently poor performer through the 1960s and 1970s, whilst the former group has exhibited strong growth for 40 years. That these sub-regional dummy variables are significant in the results reported above is not surprising, since the groupings have been made ex post in terms of observed differences in performance. What is perhaps surprising is that even when we bias the groupings to emphasise regional differences, the estimated unique component of East-Asian miracle growth is less than one percentage point of annual growth. More than half of the difference between European and East-Asian growth (a gap of nearly 2 percentage points over the past four decades) is explicable in terms of the far greater opportunities for the Asian economies in relation to technological transfer.
Although the ‘other’ Asian economies experienced much slower growth in the 1960s and 1970s, there was evidence of the beginnings of acceleration in the 1980s, particularly in India, Sri Lanka and Bangladesh. This increase in growth occurred as productivity levels in these countries approached the development threshold of int$3,000–4,000 per worker. More recently of course, and not included in the data used here, have been reports of take-off growth in China over the past few years.
Much of the variation in growth rates in Asia and the OECD can be explained by the simple model of technology transfer and threshold levels of development outlined above. The real puzzle of post-war development is, from this perspective, not one of why the East-Asian economies have been performing so well, since they have to a large extent been following the well-established technological footsteps of the more advanced industrial economies. Nor is the poor economic performance of Africa so inexplicable, given that few of their economies appear to have reached the threshold level of development, although there are many important issues about severe underdevelopment with which this simple analysis does not attempt to grapple.
Rather the major puzzle is why the Latin-American economies failed to capitalise on the opportunities given them by the relatively privileged start they had in the post-war race for development. They started in 1950 with annual income levels more than double those of East Asia. Moreover, their productivity starting point was exactly in the income range which has proved to provide the potential for rapid growth in both Europe and Asia. But there have been only a few sporadic success stories such as Brazil and Ecuador, and even there the successful growth only lasted up until 1980 and has been followed by negative growth. After four decades of mis-managed development, Latin America finds its position in relation to East Asia reversed – it is now the Asian worker who produces twice the annual output of her Latin-American counterpart.
3. Economic Explanations of Growth: Old Theories in New Models
The past ten years have seen an eruption of models of the growth process. These were sparked off by Romer's (1986) demonstration that it was possible to devise mathematical models where the spillover benefits of investment were sufficient to stop growth grinding to a halt against the boulder of diminishing returns without sacrificing the general equilibrium properties of models based on neoclassical technologies and individual optimising behaviour. This technical breakthrough in economic modelling has revived academic interest in the analysis of growth as the product of deliberate investment (with or without spillover benefits) rather than viewing long-run growth as the technological equivalent of manna from heaven.
Romer has turned more of late to emphasise the public good nature of knowledge, rather than spillovers from physical investment, as the primary source of growth. His 1990 paper presents a vivid image, particularly appealing to academic researchers, of investment in knowledge not only generating useful ideas for current production, but also aiding the generation of further knowledge. Knowledge stocks increase through a continuous feedback loop which provides the economy with an ever increasing supply of blueprints for new products and processes.
Many other models of endogenous growth have been proposed. Lucas (1988) and others have emphasised the role of human capital as a complementary input into production alongside physical capital. Rebelo (1991) has proposed a two-sector model where increasing returns in the production of capital goods are sufficient to overcome the growth-inhibiting effects of decreasing returns in the production of final output. Jones and Manuelli (1990) have generalised the idea, due to Pitchford (1960), that decreasing returns may be asymptotically equivalent to constant returns and hence capable of sustaining long-run growth, if there is sufficient substitutability between reproducible capital and fixed factors of production. Yang has proposed, in a series of papers, that growth is driven by increasing returns to specialisation, limited only by the costs of transactions and by opportunities to trade.[6]
Hammond and Rodriguez-Clare (1993) have proposed an encompassing mathematical model of growth. I will borrow a presentation from Dowrick (1994b), but stick to their notation whereby two types of capital are involved: H and K denote capital stocks which can be interpreted as human and physical capital, respectively. However, it is important to bear in mind that these notations are essentially arbitrary. What is important from the point of view of modelling is that K is associated with spillovers and H is associated with feedback. Endogenous growth occurs in three distinct situations.
Case 1: Capital flexibility generates long-run growth
A general production technology with constant returns to scale is capable of generating long-run growth without either feedback or spillover as long as the elasticity of substitution between factors is greater than unity. This case is, for instance, analysed by Pitchford (1960) and more recently by Jones and Manuelli (1990).
Output, Y, is a function of H, K and the amount of labour time devoted to production of final output, L, which is multiplied by a labour efficiency factor, E, to give EL efficiency units of labour. Lower case letters denote per capita values. The output of a representative agent is given by a CES production function with the elasticity of substitution σ:

In order to concentrate on the capital flexibility argument, for this case I ignore the feedback and spillover mechanisms, assuming that h and E are fixed. Physical capital, k, grows according to the amount of consumption foregone. The question is whether it is possible (and desirable) to accumulate capital sufficiently quickly to generate long-run growth despite the fixity of the other factors of production.
Long-run growth is not feasible if increasing capital intensity drives the marginal product of capital to zero (the Inada condition). This occurs if capital is not readily substituted for labour (σ≤1), for example in the case of a Cobb-Douglas production function where σ=1. Labour is ‘essential’ in production, in the sense that the marginal product of capital approaches zero as the ratio of capital to labour rises. In the absence of feedback or spillover the long run growth of output is constrained by the growth of the labour supply and by the growth of the exogenous technology parameter A. Agents can accumulate human capital and physical capital as much as they like, but they will always run aground on the rock of diminishing returns in the long run; hence the ‘investment pessimism’ traditionally associated with the Solow-Swan model.
If, on the other hand, the elasticity of substitution, σ, exceeds unity, then the marginal product of investment no longer declines to zero; labour is no longer ‘essential’. In effect, robots can replace humans on the production line; they can even replace humans in the production of further robots. Of course, labour is still required to organise and direct the production process; but the essential point is that if there is sufficient substitutability between capital and labour, then investment will always contribute to growth.
As long as the return on investment is above the inter-temporal discount rate, then rational agents should choose to invest and the economy will keep on growing. Specifically, let agents' instantaneous utility depend on current consumption, c, such that:

where ε is a constant rate of relative risk aversion, capturing the extent to which agents are prepared to pay to smooth out consumption. Each agent seeks to maximise lifetime utility, discounted at rate ρ. The choice for the agent is between current and future consumption. A rational agent will allocate labour time and investment in such a way that output, consumption and capital grow at a steady rate, g, given by:

There are two requirements, then, for conventional investment models to generate
long-run growth. The first is that capital should be sufficiently flexible
that it can be substituted for other factors, in particular that it can replace
those non-reproducible factors which would otherwise constrain growth. This
is the technical condition that σ > 1. The second is the economic
condition that agents should perceive the benefits of increased future consumption
as worth the sacrifice of current consumption, i.e. that the long-run marginal
productivity of capital,  , should exceed the discount rate, ρ.
Case 2: Investment feedback generates long-run growth
Feedback might occur where the representative agent chooses to devote a proportion, r, of their labour time to research/education. This research activity increases the individual's stock of knowledge or human capital, h. Crucially, the larger the stock of knowledge, the easier it is to increase it. Better educated and more knowledgeable people learn faster and develop new ideas more easily. The underlying idea is appealing – existing knowledge and understanding, combined with further education and research, generate further knowledge. This is an example of the feedback effect. Mathematically, this relationship is represented as:

where  represents the rate of change of knowledge/human
capital which depends on both the labour time spent on research and on the
existing stock of human capital. The proportional rate of growth of knowledge
is given by:
represents the rate of change of knowledge/human
capital which depends on both the labour time spent on research and on the
existing stock of human capital. The proportional rate of growth of knowledge
is given by:

If there are decreasing returns to the stock of knowledge, γ < 1, then although knowledge may continually increase, its rate of growth must decline. But if γ is exactly equal to unity, then the rate of growth of knowledge is θr.
It is, then, possible that the stock of knowledge, h, may exhibit constant positive growth. But under what circumstances will this translate into long-run growth of output and consumption? To answer this question, we need to specify the production technology. To simplify matters, consider the case where the production function is Cobb-Douglas. Conventional investment is not sufficiently flexible to augment the fixed factors such as labour, so the long-run growth of Case 1 is not possible.

With consumer preferences between current and future consumption as defined in the previous section, the optimal allocation of resources to research/education will yield a balanced growth rate of output and consumption given by:
where the production shares of human capital/knowledge and labour are assumed to be approximately equal. This simply tells us that long-run growth will occur if the feedback mechanism is sufficiently strong (γ=1 in equation 4), and if the return to investment in research/education exceeds the discount rate (θ>ρ).[7]
Case 3: Investment spillovers generate long-run growth
The idea here is that the productivity of fixed factors, such as labour, may be enhanced by spillover benefits from the capital accumulation of other agents. There are several features of investment which may produce such spillovers. The public good qualities of knowledge are a prime example, suggesting spillovers from R&D or from learning-by-doing. A simple mathematical formulation has the efficiency of labour enhanced by the aggregate capital accumulation of other agents, represented by upper case K:

The solution for the growth of this economy is typically complex. But there is a
simple steady state growth rate in the special case where ε=1 and the
externality parameter  . With equal factor shares in output this
would imply φ=2. Normalising the labour input to unity and writing the
aggregate capital stock as K=nk, the Cobb-Douglas production
function is y = Ahα
kβ (nk)1−β
which exhibits constant returns to k. The market determined growth
rate is:
. With equal factor shares in output this
would imply φ=2. Normalising the labour input to unity and writing the
aggregate capital stock as K=nk, the Cobb-Douglas production
function is y = Ahα
kβ (nk)1−β
which exhibits constant returns to k. The market determined growth
rate is:

In this case, growth is generated by private investment where agents ignore the spillovers which benefit others. Only if the positive externalities of private capital accumulation are sufficiently strong, and if agents are sufficiently patient (ρ not too high), is it possible for decentralised investment decisions to generate long-run growth.[8]
Not surprisingly, private investment decisions which ignore spillover benefits generate a sub-optimal rate of growth. A social planner facing a representative production function y = Ahα kβ k1−β = Ahα k would choose higher investment to generate a steady state rate of growth g = Ahα − ρ.
It is still debatable as to whether these new models of endogenous growth are actually better at explaining the observed patterns of economic development, in comparison with the older Solow-Swan model. One of the motives for developing the new theories has been the observation that the world's poorest economies are not catching-up to the leading economies, whereas a simple version of the traditional growth model suggests that all economies should be converging on a unique steady state. The more backward economies with lower capital intensity should face a higher return to capital and should therefore be growing faster for a given rate of investment. Moreover, given a capital share in income of about one-third, the marginal product of capital should fall rapidly as capital intensity rises, causing rapid convergence. Indeed, conventional parameterisation of the Solow-Swan dynamics suggests that the gap between current and steady-state output should shrink at a rate of about 5 per cent per year, giving convergence a half-life of about 14 years. In fact, though, even where we do observe convergence – amongst the OECD countries since 1950 – the estimated half-life is over 30 years.
By way of contrast, models of endogenous growth do not typically predict that convergence need occur at all, since they are based on returns to investment failing to diminish. Indeed, the new models are capable of predicting virtuous cycles of cumulative growth as well as low-growth traps, so divergence of income and productivity is a possible outcome. So the evidence of the previous section that world productivity levels have been diverging over the past four decades is prima facie evidence in favour of the endogenous growth models.
An influential paper by Mankiw, Romer and Weil (1992) has suggested, however, that this is too simplistic a test of the traditional model. First, we should allow for different rates of savings which imply that each country has its own, unique steady-state level of output per capita on which it is converging – allowing a rich country to grow faster than a poor country if the rich country is relatively further behind its own target steady state. In other words, convergence between countries should be measured conditional on their savings rate. Second, allowing for heterogeneous capital stocks, in particular distinguishing between physical capital and human capital, yields substantially larger empirical estimates of the share of capital. In their estimation, raw labour, human capital and physical capital contribute equally to production so, when broadly defined, capital's share is around two-thirds and the predicted rate of convergence is much closer to that we observe. Moreover, allowing for the importance of human capital implies that the savings rate in the conditional convergence regression should be defined to include investments in schooling. When they so specify their model, they find support for conditional convergence across a much wider group of countries than the OECD.
The evidence on conditional convergence can also be interpreted in terms of the simple technology transfer/threshold model discussed in the previous section. Given a threshold level of complementary physical infrastructure and human capital, the observation that economies with relatively low initial levels of productivity grow relatively fast, might reflect opportunities for advancing towards the frontier of the advanced production technology rather than a move along the frontier driven by capital deepening. Unfortunately, to distinguish between these two explanations, or to establish their relative contributions to growth if they are both significant, we need to have reliable capital stock data. Such data are typically unreliable even within one country, let alone in the context of international comparisons. So, for the moment, the relative explanatory power of diminishing returns and technology transfer are difficult to disentangle.
The debate between exogenous and endogenous growth models is far from over. Mankiw et al. (1992) have shown that some of the principal facts of recent growth can be interpreted in terms of the dynamics of the traditional model a long way off its steady state. But if the steady state is so far off, and presumably technological shocks will be continually moving it yet further away, then it is probably going to prove very difficult to distinguish empirically between the traditional model and the new theories in which there exists steady-state growth but no steady-state level. Indeed, from a practical and policy point of view, such distinctions may be rather unimportant. In both classes of models, policy intervention is justified in terms of efficiency criteria only to the extent that market failure can be demonstrated. Moreover, both sets of theories point to the importance of investment – whether in physical or human or knowledge capital – for growth in the short and medium run. If we are all dead in the long run, that is probably good enough for us!
Probably the most important attribute of the new theories is that they have refocused the attention of many economists on the importance of long-run growth and its potential for rational economic explanation.
4. Evidence on the Determinants of Growth
A substantial body of evidence on the determinants of growth has been accumulating over the past decade. Most studies have relied on cross-country comparisons, essentially examining a cross-section of countries for correlations between their medium-term growth performance, over say 1960–85, and a range of measures of policies and institutional features. The relatively neglected dimension of empirical research has been the time-series analysis of the causes of growth. Some attempts have been made to recognise time variation by treating the data as a panel of short to medium-run observations on (typically five or ten year averages). The big advantage of this approach is that it not only gives many more observations of time-varying variables, but also it allows control for non-observed and time-invariant country effects, perhaps related to each country's history and culture and institutional setup, which might otherwise induce spurious correlation between growth and other endogenous variables. It also allows consideration of the possibility that the growth relationship is not the same at different stages of development.
There are two major challenges for empirical work on growth over the next few years. One challenge is to attempt a reconciliation between, on the one hand, the traditional time-series analysis of macroeconomic variables and the business cycle and, on the other hand, the cross-sectional analysis of growth. The second challenge is to develop the theoretical modelling in order to come up with precisely specified tests between the range of competing models. For the moment, however, we have to treat the current range of econometric analysis as suggestive rather than definitive.
It is well established that post-war economic growth shows strong partial correlations with initial levels of income (vis-à-vis the convergence/divergence discussion of the previous section) and also with rates of investment. Additional correlates which have been put forward include measures of schooling or stocks of human capital, distinguishing between different forms of physical investment, openness to trade, intervention in capital markets, R&D policy, population growth and fertility, monetary policy, government consumption and investment expenditures, and the occurrence of wars and revolutions.
A rather unhelpful paper by Levine and Renelt (1992) dismisses most of these potential explanators as ‘fragile’ to extreme bounds analysis. In other words, they found it possible to construct an OLS regression of growth in a single cross-section of countries where inclusion of some sub-set of these explanatory variables could render statistically insignificant the partial correlation between growth and any one of these variables. This approach seems to amount to data undermining. Given that many of these potential explanatory variables are endogenous and/or in turn related to other missing variables, it is hardly surprising that the variables are not all orthogonal and that it is therefore sometimes difficult to precisely identify their individual contributions to growth.
A more positive approach to the modelling problems is to try to identify structural relationships between the various explanators and estimate the growth relationship accordingly. It is certainly a weakness of much of the recent empirical literature that problems of endogenity and simultaneous causation have often been ignored. Nevertheless, at least some of the studies discussed here have attempted to deal with these problems, usually by estimating suspected endogenous relationships by instrumental variable methods or, what amounts to much the same thing, using lagged values of the variables to predict subsequent growth.
Here I will summarise my view of the recent empirical literature. I will concentrate on those areas where the most compelling or interesting evidence has been assembled: the initial conditions; the growth of capital and labour inputs; fertility and labour supply; education and human capital; government expenditures; and research and development.
4.1 Initial Conditions: Catching-Up and Falling Behind
Almost all cross-country studies have found that initial conditions – represented by various measures of the level of development such as output per capita, labour productivity, stocks of physical capital or stocks of human and knowledge capital – have very significant predictive power over subsequent growth.[9] The most common finding is one of conditional catch-up – low initial stocks or productivity levels predict relatively rapid growth. However, for some variables (such as human capital) and for some samples (such as the least developed economies) the opposite is the case – a low starting point inhibits subsequent growth, implying that relatively poor economies fall behind or are caught in a low-development trap.
In the previous section I have demonstrated that a simple quadratic or cubic function of a single development variable, real labour productivity, can predict approximately one-third of the variation in subsequent rates of growth. There is a clear pattern of threshold development levels, growth take-off and subsequent slowdown as development matures. This is akin to Rostow's (1971) description of stages of development. I have interpreted this evidence principally in terms of opportunities for technology transfer and capabilities to exploit such opportunities. Alternative explanations can be found in variations on the standard neo-classical growth model, in terms of a systematic relationship between the level of development and both returns to capital and the desire to save (Sarel 1994), or in terms of endogenous growth models with market failures and investment coordination problems (Gans 1995; Murphy et al. 1989) which imply the existence of multiple equilibria and low-growth traps.
There are many other explanations for growth, some complements and some substitutes for the level of development explanations. I will go through some of the principal explanators in turn.
4.2 The Contributions of Capital and Labour Growth
Traditional explanations for growth have centred on the growth of physical capital and the growth of the labour force. If we augment the earlier regression of Table 2 with measures of population growth, GP, and per capita investment rates, Inv/GDP, we can interpret the results either in terms of a traditional growth accounting exercise – augmented by our non-monotonic technology transfer function – or else in terms of the dynamics of a Solow-Swan model in the way that Mankiw et al. (1992) have done. The results for our sample of Asian and European/OECD economies are shown in Table 4.
| Estimation method | OLS |
|---|---|
| n | 155 |
| Regression coefficient (t-statistics): | |
| y0 | 2.2 (1.3) |
|
−2.8 (−2.6) |
|
0.6 (3.0) |
| D50 | 1.1 (2.8) |
| D60 | 1.4 (3.6) |
| D70 | 0.1 (0.3) |
| Inv/GDP | 0.12 (3.6) |
| GP | −0.33 (−2.3) |
| Asia | 0.2 (0.4) |
| Constant | 0.6 (0.9) |
| Summary statistics: | |
|
0.48 |
| s.e. | 1.32 |
| Note: t-statistics are corrected for heteroscedasticity. | |
The negative coefficient on population growth implies diminishing returns to labour input, holding investment rates constant. The size of the coefficient, −0.33, is exactly what we would predict in a growth-accounting model with labour having a two-thirds share in national income. The coefficient on the share of investment in GDP is plausible, if somewhat high, in that it implies a gross rate of return on investment of 12 per cent per year. Barro and Lee (1993) suggest that somewhat lower estimates in the range of 5–8 per cent are obtained if instrumental variables are used and if other control variables such as life expectancy are included in the regression. Nevertheless, it is of interest to examine the contribution of capital deepening to growth using these perhaps overestimates of returns to investment.
From the data given in Table 1, we can deduce the extent to which investment has contributed to the rapid growth of the high-performing Asian economies compared with Europe/OECD. In the 1980s, for example, East Asia invested some 30 per cent of national income, whereas Europe/OECD invested only 23 per cent. This difference is predicted to add 7 x 0.12 = 0.8 percentage points to growth. At the same time, slightly higher population growth in East Asia is predicted to have lowered productivity growth by 0.9 x−0.3 = −0.3. So overall capital deepening explains 0.5 points of the 2.9 percentage points difference. Another 1.6 points difference is attributable to the East-Asian ‘advantages of backwardness’, or opportunities for technology transfer. The residual or ‘miracle’ element of annual East-Asian growth is estimated to be significant but, at 0.7 of a percentage point, substantially less than the much publicised raw growth differential in total GDP which is more than 3 percentage points.
Indeed, country breakdowns suggest that much of this ‘miracle’ effect, or unexplained increase in technical productive efficiency, has been displayed over the past 20 years only by three countries: Hong Kong, Korea and Taiwan. High growth rates in Japan and, especially, in Singapore have been the product largely of very high rates of investment. Japan has invested over 30 per cent of national income, and Singapore over 40 per cent.
I do not go so far as Krugman (1994) who cites evidence from Young (1992) that technical efficiency in Singapore has not increased at all. That evidence depends crucially on the estimation of notoriously unreliable capital stock figures. Rather, the evidence presented here uses the much more reliable data on investment flows. Of course, the interpretation of the resultant regression residual as a measure of technical efficiency relies on the appropriateness of the imposed functional form, which here implies a locally flat marginal return to investment. If we can accept this assumption, the regression results suggest that efficiency in Singapore has benefited from technological diffusion at just the rate to be expected of economies at intermediate levels of development, taking the European/OECD experience as our benchmark. There has been little productivity miracle beyond that. As Krugman concludes:
The newly industrialising countries of the Pacific Rim have received a reward for their extraordinary mobilisation of resources that is no more than what the most boringly conventional economic theory would lead us to expect. If there is a secret to Asian growth, it is simply deferred gratification, the willingness to sacrifice current satisfaction for future gain.
(Krugman 1994, pp.78)
Whilst I judge Krugman's analysis to be broadly correct for most of East Asia, there is still a substantial unexplained ‘miracle’ evident in the residuals the regression for Hong Kong, Taiwan and Korea. The element of their growth which is unexplained by conventional factor accumulation and technology transfer is about 2 per cent per year. Some part of this unexplained growth is probably due to human capital accumulation and other factors which are discussed later, but it is still important to recognise the existence of these unexpectedly high rates of growth in these three countries whilst keeping a realistic assessment of the order of magnitude of ‘the miracle’. It is also worth noting that Germany, Italy, Greece, Spain, Turkey and Japan enjoyed periods of equivalent ‘miracle’ growth in earlier decades.
Both the econometric and historical evidence suggest that we can expect growth rates of productivity in East Asia to subside, in the same way as European and Japanese growth has done, as opportunities to take advantage of technological diffusion dwindle. High growth of per capita incomes will depend on continued rapid growth in human and physical capital, as potential for increased labour force participation is probably limited. Indeed, as countries approach the living standards of the advanced OECD economies we may expect to see – as is happening now in Japan – moves to enjoy the fruits of economic success through more leisure and shorter working hours or working years.
For the rest of Asia, relatively low investment rates go a long way to explaining why they grew so much slower than their East-Asian counterparts over the first three decades of post-war growth. A substantial pick-up in investment (particularly in India and Sri Lanka) in the 1980s has been accompanied by a decline in rates of population growth. Together, the consequent capital deepening seems to explain a mild recovery in growth in these economies. This recovery has been sufficient to push most of these economies (with the exception of Myanmar) to the threshold level where rapid-take-off growth is at least a possibility.
This simple accounting exercise can also be applied to the Latin American and African economies. Over the four decades from 1950 to 1990, Latin American economies have displayed low rates of investment and high rates of population growth. Accordingly, capital intensity has failed to grow at the rate experienced in the European/OECD group. This relative capital dilution is estimated, using the coefficients reported in Table 4, to have reduced Latin-American annual growth by one percentage point. Their failure to increase technical efficiency at the rate of the European and Asian economies at a similar stage of development accounts for another 1.2 percentage points shortfall over their potential growth rate.
Low rates of investment against a background of high, and increasing, population growth also account for about half of the growth shortfall in Africa. As with Latin America, however, their failure to improve technical efficiency at the rate observed in Asian economies at a similar level of development suggests that other important influences must be at play. Equally important is to explain why investment rates have been so much lower than in the East-Asian economies.
4.2.1 Explaining variations in rates of investment
The World Bank's (1993) report on The East-Asian Miracle contains valuable, if controversial, insights into the factors that have contributed to high savings rates and high investment rates in East Asia. A consistent theme in their analysis is that market forces alone are often not sufficient to produce the institutions which will generate confidence in savings, nor to overcome the coordination problems in directing investment, especially when major development pushes require complementary investments across varied sectors of the economy. Moreover, they recognise that is feasible (though they do not take it as fully established) that myopic household behaviour which ignores positive investment externalities may lead to sub-optimal savings rates even when financial institutions are well developed. It is worth quoting part of their conclusion (p. 242):
… Efforts to improve the institutional framework for capital market development came later in the process and were not responsible for takeoff. In some cases well-functioning development banks were a positive but not a determining factor. More selective interventions – forced savings, tax policies to promote (sometimes very specific) investments, sharing risk, restricting capital outflow, and repressing interest rates also appear to have succeeded in some HPAEs, especially Japan, Korea, Singapore and Taiwan and China.
and to take note of their warning:
But the potential costs of these more selective interventions if misapplied can be very high in terms of consumer welfare, and strong institutional capability is necessary. They would not have succeeded without the important monitoring and disciplinary roles performed by the banks and public institutions of these economies.
Another very important factor in explaining high rates of investment in East Asia relative to Latin America and Africa is that the price of investment goods, relative to the overall price level, has been substantially lower. Brander and Dowrick (1994) have established that the price of investment goods relative to consumption goods is indeed highly significant in explaining real levels of investment. Average price levels (relative to the price of GDP) for the regions are shown in Table 1. There is a consistent tendency for the relative price of investment goods to rise as income levels fall, reflecting in part the need for less developed economies to import their capital goods at exchange rates which are undervalued relative to purchasing power parity for GDP. Nevertheless, a point emphasised by De Long and Summers (1991) is that part of the success of the East-Asian economies has been their ability to manage relative prices so as to keep the price of capital goods relatively low.
4.2.2 Investment in equipment rather than structures
De Long and Summers (1991, 1992) have examined the mix of investment across a sample of OECD and developing economies over the period 1960–85. They suggest that the gross annual rate of return on investment in machinery and equipment is much higher than that on investment in dwellings and structures. Taking account of the faster rate of depreciation of equipment, they find that the net social return is still about twice as high as the net return on structures. They suggest that there may be significant beneficial spillovers from equipment investment which result from the transfer of ideas and experience gained by workers who learn new techniques and ideas as a result of implementing and adapting the technologies embodied in new equipment.
Critics such as Auerbach et al. (1993) have questioned both the empirical robustness of the De Long and Summers results and also their economic interpretation. There is some suggestion that their sample of countries may not be representative. Some have argued that their results may simply reflect differences in the timing of investments or the fact that rapid economic growth induces high rates of investment in equipment.
Part of the evidence that investment in equipment causes faster economic growth is derived from econometric testing for endogeneity of both quantities and prices. This approach is illustrated by comparative case studies of Argentina and Japan. Peronist policies in the 1950s, continued through later decades by successor governments, had the effect of over-valuing the Argentine exchange rate and raising the relative price of machinery and equipment. De Long and Summers argue that Japanese policies had the effect of lowering the relative price of investment goods. Monopolistic high prices in the consumer goods sectors have been encouraged by Japan's Liberal Democratic Party and LDP-client bureaucracies. On the other hand, the Ministry of International Trade and Industry has focused on achieving value for the purchasers of capital goods – blocking the effects of ‘politics as usual’ in the investment goods markets. Hence, Japan's relative price structure favours equipment investment.
4.3 The Contribution of Fertility, Population Growth and Labour Supply
An often virulent debate has raged concerning the arguments of the neo-Malthusians (or anti-natalists as their opponents like to label them) who suggest that high rates of population growth are likely to reduce living standards through capital and resource dilution. Opponents of this position have pointed to the lack of a significant negative correlation between growth rates of GDP per capita and of population. This was the position of Kelley (1988) in an influential survey based on available data up to 1980. Using data up to 1990, and controlling for level of development, however, we do find a significant capital dilution effect, as reported above.
More recent work of Kelley's supports this position. It is amplified by Brander and Dowrick (1994) who suggest that it is not only the rate of population growth that matters but also the rate of acceleration or deceleration. In particular, those countries such as Japan, Hong Kong and Taiwan which reduced fertility sharply have experienced a substantial drop in dependency rates and a consequent sharp increase in labour-force participation. This has contributed in turn to higher incomes per head of population.
The magnitude of these labour-supply effects has been estimated by Dowrick (1995a) for a selection of Asian economies. The estimated contributions to per capita growth are listed in Table 5. Increasing the working age share of the population has a direct impact through a proportional increase in labour-force participation augmented by reduced dependency rates and increased participation of women. This has had the effect of raising annual per capita income growth by around one per cent in Hong Kong, Singapore and South Korea, which have undergone a radical demographic transition. In those countries where the demographic transition is less advanced, the labour-supply effect has been less strong but can be expected to increase in the future.
| Growth of working age proportion of the population % points |
Population growth % points |
Net demographic impact on growth % points |
|
|---|---|---|---|
| Advanced demographic structure | |||
| Australia | 0.4 | 0.0 | 0.4 |
| Japan | 0.3 | 0.2 | 0.5 |
| Full demographic transition | |||
| Hong Kong | 1.1 | −0.2 | 0.9 |
| Singapore | 1.3 | 0.0 | 1.3 |
| Korea | 0.9 | −0.1 | 0.9 |
| Early demographic transition | |||
| China | 0.7 | −0.1 | 0.7 |
| Thailand | 0.7 | −0.3 | 0.4 |
| Indonesia | 0.1 | −0.1 | 0.0 |
| PNG | −0.1 | −0.2 | −0.2 |
| Philippines | 0.3 | −0.3 | 0.0 |
| Malaysia | 0.6 | −0.2 | 0.4 |
| Fiji | 0.9 | −0.2 | 0.7 |
| Note: Using coefficient estimates from Dowrick (1995a). The impact of population growth is measured relative to Australia's growth rate. The net impact is the sum of the first two columns. | |||
One of the major factors causing fertility to fall is rising living standards. So fertility reduction and the growth of GDP per capita can exert positive feedback effects. These have been an important part of the rapid economic and demographic transition of East Asia. Also significant has been the sharp rise in education in Asia, as shown in Table 6. In particular, Barro and Lee (1993) have provided strong evidence that female education reduces fertility. So the virtuous growth cycle has been reinforced where additional resources have been channelled into female education, as has been the case in East Asia.
| Latin America | East Asia | |||
|---|---|---|---|---|
| Average years of schooling | ||||
| Male | Female | Male | Female | |
| 1960 | 3.3 | 2.7 | 4.7 | 2.4 |
| 1970 | 3.7 | 3.1 | 5.6 | 3.4 |
| 1980 | 4.6 | 4.1 | 6.7 | 4.5 |
|
Source: Barro and Lee (1994). |
||||
4.4 The Contribution of Education
Barro and Sala-i-Martin (1995) summarise extensive testing of the impact of investment in human capital on growth. They find that educational expenditures by governments have a very strong positive impact. Using instrumental variable techniques to control for simultaneous causation, their regressions suggest that the annual rate of return on public education is of the order of 20 per cent.
They also use data from Barro and Lee (1993) on the educational attainment of the adult population and appear to find increasing returns to levels of education – the marginal effect on growth of increasing years of primary schooling is small, the effect of an additional year of secondary schooling is substantial, whilst the largest effect appears to come from increasing higher education. Surprisingly, these effects seem to be confined to male education. The estimated impact of increasing female education is negative in their regression model. This is perhaps a result of collinearity between female education and other measures of development, such as life expectancy and fertility, which are included in the regression. Also, where many women are involved in domestic rather than market economic activity, the educational enhancement of their contribution to economic welfare may not be picked up directly by standard measures of GDP.
I find the Barro and Sala-i-Martin evidence on disaggregated educational attainment unconvincing. There are strong arguments and evidence for instance that primary education is vital for economic development. The World Bank's (1993) study suggests that high levels of public support for universal primary education in particular have been vital for East-Asian success. The apparent relatively low rate of return in the cross-country studies on primary education, relative to higher levels of education, may reflect the fact that there is relatively little variation across the successfully developing and developed economies in rates of primary education. A safe conclusion seems to be that investment in education does indeed create the pre-conditions for successful growth, but data and modelling problems do not yet allow any clear conclusion concerning the allocation of educational investment between different sectors.
4.5 The Contribution of Government Expenditures
Barro has consistently claimed to find strong empirical evidence that government consumption expenditures, excluding the education component, are negatively correlated with growth. His empirical modelling is at odds, however, with the theoretical modelling of his 1990 paper which suggests a non-linear relationship.
His simple model of endogenous growth has government size contributing to growth in a double-edged manner. Government activity is taken to be a productive input into private sector production, albeit with a decreasing effect on private sector marginal productivity. In other words, ceteris paribus an increase in government activity will increase the marginal product of capital, providing the incentive for increased private investment which produces higher long-run growth. Everything else is not, however, equal. In particular, government has to finance its activities. In Barro's model, financing requires distortionary taxation. Tax drives a wedge between private returns to investment and social returns, reducing the incentive for private agents to invest and thus reducing the long-run growth rate of the economy. A country will find that it faces a hump-shaped relationship between government size and economic growth. If government is very small, the positive effect of government on private-sector productivity dominates the distortionary tax effect, so the marginal net effect of government is positive. Beyond a certain point, however, the tax effect dominates and the net marginal effect of government is negative. Choice of government size to maximise the discounted utility of the representative consumer does not necessarily coincide with the size of government which maximises growth, but optimal government size is certainly positive.
The Barro argument continues by noting that if government size were the result of a random draw, then we should expect to observe this hump-shaped relationship between government and growth. In practice, however, we observe a monotonic negative relationship. Rather than rejecting the Barro model, this evidence may be taken to suggest that government size is not chosen randomly, rather that it at least approximates the optimal size for each country. We expect countries to have different needs for government services, reflecting perhaps inter-country variation in the problems of public goods and externalities due to geographical, climatic and cultural factors. A country with, say, a high population density and an individualistic culture may need relatively more government intervention to overcome problems of externalities in interactions between individual consumers and producers. If so, it will have to rely more heavily on distortionary taxation which reduces incentives for private investment. A country which faces substantial market failure will exhibit both a large government sector and a slow growth rate relative to some other country with less need for public intervention.
In the Barro model, then, if all countries choose their level of government optimally, cross-section observation will find a negative correlation between government size and growth. But this will reflect an equilibrium relationship, not a direct causal relationship. The equilibrium relationship is driven by underlying and probably unobserved variation in the extent of market failure.
This argument is illustrated in Figure 6 where it is assumed for simplicity that welfare optimisation equates with growth maximisation. Country A faces a government/growth trade-off represented by the solid line A, and it chooses a level of government represented by the point a*. Similarly for country B. The negative cross-section relationship, illustrated by the dotted line a*b*, should not be interpreted to imply that government in B is too large. Indeed, a reduction in government to the level found in country A, moving to the point b', would actually reduce growth and welfare in country B.
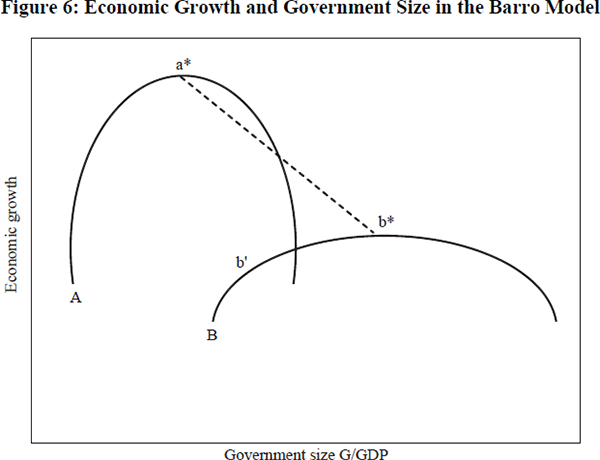
In some recent work, Dowrick (1995b), I have attempted to test this model of the relationship between government and growth. I note that the price of government services relative to GDP varies considerably over time and across countries, so it is possible to distinguish empirically between the real level of government activity and the size of the financing requirement. I also use panel data to control for fixed-country effects, allowing for unobserved differences in the underlying extent of market failure. The results give support for the Barro model, at least amongst the more advanced capitalist economies, finding that ceteris paribus government activity does indeed stimulate growth, whilst ceteris paribus taxation reduces growth. The marginal impact of government consumption expenditures on growth is at first positive, up to a level around 12 per cent of GDP, but negative thereafter. This evidence should be regarded as preliminary in terms of its point estimates of growth-maximising government expenditures, but strongly supportive of the position that at least some portion of current government expenditures are indeed growth enhancing.
Another important consideration is the distinction between public and private investment. The investment data typically used in empirical studies combine both public and private sectors. There are reasons to suppose, however, that public investment might be less productive at the margin if it is mis-directed according to political, rent-seeking objectives; on the other hand, to the extent that market investment is sub-optimal due to coordination problems or free-rider problems, public investment might be more productive.
Recent time series analysis of data from the US (Aschauer 1989; Munnell 1992; Lynde and Richmond 1992), the UK (Lynde and Richmond 1993) and Australia (Otto and Voss 1994) suggests that public investment is indeed complementary to private investment and attracts a higher marginal rate of return, particularly since the widespread cuts to public investment programs in the US and elsewhere over the past 20 years. This evidence is still rather controversial, and has not been accepted by, for example, the recent EPAC report on infrastructure provision in Australia. Nevertheless, there is independent support from the cross-country regression analysis of Easterly and Rebelo (1993) which finds that public investments in transport and communication networks are indeed important ingredients in promoting growth. Moreover, they find that such public investment does not crowd out private investment (whereas public investment in agriculture, for example, does tend both to crowd out private investment and have a net negative effect on growth).
This conclusion is broadly supported by the World Bank's (1993) analysis of East-Asian growth which they suggest has been strongly supported by public investment in infrastructure. Overall, the cumulation of evidence from different sources – time-series, cross-country and case studies – presents a convincing case for the value of public investment in a core infrastructure of modern transport and communication.
4.6 The Contribution of Research and Development
R&D expenditures typically constitute, for advanced economies, only around 2 per cent of GDP (around 1.5 per cent in Australia) – approximately one-tenth of the expenditure devoted to traditional investment in physical equipment and structures. In a standard growth accounting framework, it may then seem that variations in research effort should explain very little of the differences in growth rates between countries.
Of course, knowledge creation can occur outside the research laboratory, and so will not always be fully captured by conventional measures of R&D. For instance, Young (1993) and De Long and Summers (1992) argue that there is likely to be substantial learning and innovation involved in the implementation of new ideas, especially when new technology is embedded in capital equipment.
But we do not necessarily have to rely on non-measured research and learning to highlight the importance of knowledge in growth. The point of much of the new growth theory is precisely that if the hypothesised channels of knowledge spilling over to other productive activities are found to be substantial,[10] then even relatively small resources devoted to the production of knowledge may result in substantial economic growth. For instance, Grossman and Helpman (1991) calibrate their model to roughly match the US growth experience. They predict that business investment should be around 10 per cent of GDP whilst R&D – the engine of growth in their model – need comprise as little as 1.6 per cent to generate annual GDP growth of 2.5 per cent.
Lichtenberg (1992) has produced one of the first attempts at studying the cross-country evidence on the impact of R&D expenditures on both the level and the rate of growth of real GDP. Using a sample of 74 countries, and treating the observed GDP levels of 1985 as a steady-state outcome, he finds the national rate of return on private R&D investment to be seven times as large as the return to investment in equipment and structures. He does, however, recognise that this interpretation of the steady-state relationship requires that investment rates are determined independently of productivity – a highly questionable assumption. The cross-country correlation between levels of GDP per capita and R&D expenditures is indeed very strong, the less-developed countries typically devote less than half of one per cent of GDP to R&D compared with over two per cent for developed countries, but this may reflect nothing more than ‘ability to pay’. Evidence of a causal link requires more detailed examination.
Lichtenberg's estimation of the relationship between R&D and the growth of GDP is probably less liable to endogeneity bias. Here the rate of return on R&D is still higher than that on physical capital, but by a margin of two rather than seven. I am still concerned that he does not take account of the likelihood that the relationship between research and growth may be substantially different for developed economies compared with the less developed economies, so his results must be treated with caution. Nevertheless, his estimate of returns to R&D being approximately double the returns to physical investment are broadly consistent with the estimates from microeconomic studies.
Nadiri (1993) summarises evidence on international technology flows. He concludes that:
The transfer of technology is taking place much faster than before and the multinational firms are the main propagators of technology diffusion … in most cases, it is the R&D intensive multinational corporations that are the main actors in the technology transfer market … and are likely to be increasing sources of new spillovers.
(Nadiri 1993, pp. 32–33).
A working paper by Coe and Helpman (1993) tries to quantify the magnitude of international R&D spillovers. They seek to explain variation in the annual growth of total-factor productivity for 21 OECD countries plus Israel over the period 1970–90. They find that the stock of knowledge in one country, proxied by cumulated R&D expenditures, raises productivity in foreign countries as well as in the own country. For the large G7 economies, the international spillover is approximately one quarter of the domestic rate of return.
Coe and Helpman produce unrealistically large estimates of the domestic rate of return on R&D – over 100 per cent in the G7 economies and 85 per cent in the smaller economies. These estimates are so much larger than those produced by microeconomic studies that one must question whether they have taken adequate account of reversed causation, whereby increases in income in a country allow it to increase its expenditure on R&D.[11] This problem is less likely to apply, however, to estimation of the spillover effects – so it may well be the case that international spillovers constitute more than one-quarter of the domestic returns.
A further interesting result is that spillover benefits are larger for countries with a high ratio of trade to GDP. Since trade shares are strongly correlated (inversely) with population, it is not clear whether it is really trade which enhances technology transfer or whether simply reflects the fact that a country with a small population and a small domestic R&D stock will rely disproportionately on spillover from the international stock of knowledge.
These macro studies of aggregate R&D, technology transfer and growth necessarily miss out on the fine detail of policies and institutions. A comprehensive survey of recent microeconomic studies into returns to R&D is provided by Nadiri (1993) who encompasses an earlier survey by Griliches (1991). For firms, own rates of return on R&D in the US, Canada, Japan and Europe are typically found to be between 20 per cent and 30 per cent. Such high rates of return incorporate, presumably, a premium to compensate for the inherently risky nature of research. Direct own rates of return tend to be higher for firms and industries where research is financed privately rather than publicly; own rates of return also tend to be higher for process rather than product R&D. Lower direct returns on public funds could be taken to imply that firms are better equipped than government to identify productive lines of research, but it could also reflect government choice of projects where most of the benefits do not accrue to the innovating firm.
There is consistent evidence from a wide range of studies to suggest that knowledge transfers are important. Nadiri concludes that the indirect or spillover rate of return is often at least as high as the direct own return, implying social rates of return to R&D of around 50 per cent. This evidence creates a strong presumption that R&D is under provided by the private sector. In particular, spillover benefits are strong in industries which are themselves active in R&D. This latter result supports the view that the diffusion of technological spillover is not a passive process, but requires own research activity if a firm is to benefit from the activities of others.
There is evidence from the technology flow studies that spillover is stronger between firms which are technologically close and geographically close, explaining clustering of high-tech industries. Spillovers are also found to be strong from university research to industry, but not vice versa. This supports the argument by Feldman (1993) that location matters because of a combination of the uncertainty and complexity of the innovation process, its reliance on university research, the importance of learning by doing and the cumulative character of knowledge. There is some suggestion that small firms are more innovative than larger firms. Acs and Audretsch (1993) suggest that small mobile firms are more adept than large firms at exploiting the spillover benefits from both the research of other firms and, especially, from university-based research. Geroski (1991) reports that in Britain technology spillovers are strongest with inventions emanating in the engineering sector flowing through to the user industries. This finding, that technology flows are stronger between firms in vertical rather than horizontal relationships, is mirrored in some of the cost function studies reported below.
An interesting recent study by Suzuki (1993) investigates R&D spillovers within and between the Japanese keiretsu – the groups of sub-contracting firms arranged around a core manufacturer. The study looks at the Japanese electrical machinery industry. It concludes that there are substantial spillovers within the keiretsu groups. Interestingly, it also finds that there are also significant spillovers to the core firms of other keiretsu. The results are summarised here as Table 7.
| Private returns | R&D spillovers | |||
|---|---|---|---|---|
| Physical capital % |
R&D capital % |
Accruing to other keiretsu % |
Accruing to sub-contractors within keiretsu % |
|
| Investment by: | ||||
| Core firms | 13 | 20 | 3.6 | 8 |
| Subcontracting firms | 12 | 15 | ||
|
Source: Suzuki (1993, Table 3). |
||||
Not only are privately appropriated returns to R&D half as high again as for physical capital, but spillovers to other firms, particularly within the keiretsu, are substantial. (Note that because Suzuki is dealing with rates of return net of capital depreciation his estimates are lower than those of other researchers who report gross rates of return.)
The large spillovers within the industrial groupings are, presumably, one of the prime reasons for the existence of the keiretsu. Although US trade negotiators have attacked such industrial arrangements as anti-competitive, Suzuki's evidence supports the argument that such long-term institutional arrangements may in fact be desirable in order to internalise knowledge spillovers and to promote innovation.
Weder and Grubel (1993) expand this point in their discussion of ‘Coasean’ institutions which operate in various countries to internalise knowledge spillovers and promote technical progress. In particular, they cite the occurrence of three sorts of institutions:
- industry associations such as the Japanese Keiretsu or Swiss Verbande;
- conglomerate corporations, including multi-national enterprises; and
- geographic clustering of industries, such as Silicon Valley or the Northern Italian networks.
They point particularly to the Swiss and Japanese examples, where voluntary associations, supported by public policy, encourage long-run relationships between vertically related firms and encourage joint ventures and cooperation including joint research and training schemes.
4.7 Other Contributions to Growth
Many other theories have been put forward to explain variations in rates of growth, although the empirical evidence put forward in their favour has tended to be partial, not tested against competing hypotheses. So much of this evidence should be regarded as tentative and suggestive.
For instance, there is substantial, but not universal, evidence that barriers to trade tend to impede growth (Lee 1993), perhaps through limiting opportunities to exploit economies of specialisation in manufacturing (Backus, Kehoe and Kehoe 1992). In a paper written for last year's Conference (Dowrick 1994a), I quantified the potential gains from trade liberalisation for Australia as of the order of magnitude of half of one percentage point per year. At the same time, I warned that trade liberalisation also increases the risk of inappropriate specialisation compounded by market failures in the accumulation of complementary factors of production such as human and knowledge capital.
Economic and social institutions also affect growth. There is some evidence that inequality in income distribution tends to reduce growth through social divisiveness (Persson and Tabellini 1994) whilst sophisticated financial institutions (King and Levine 1993) and either competitive or inclusive systems of industrial relations (Dowrick 1993; Dowrick and Spencer 1994) and cooperative industrial organisation (Weder and Grubel 1993) have also been put forward as conducive to productivity growth. Not surprisingly, civil disturbances and wars are found to be disruptive to growth, at least in the short to medium term, although Olson (1971) has argued that by breaking up narrow distributional coalitions such disturbances may have a beneficial impact on longer-run growth.
Barro and Sala-i-Martin (1995) test some, though not all, of these theories in their regression model. Whilst they have not produced definitive tests between the various theories, an important finding is that various combinations of these variables are capable of explaining the very substantial differences in rates of growth between continents and between development groupings. In their full model, dummy variables for East Asia, Africa and Latin America are individually and jointly insignificant. The dramatic variations in rates of growth with which we introduced this paper are largely capable of economic explanation through both the semi-exogenous ‘initial conditions’ and the endogenous policy and behavioural choices, even if we are not yet in a position to clearly disentangle all the individual explanations.
5. Concluding Comments: Some Implications for Australia
Most of the analysis of this paper has been positive in the sense that it has tried to establish the determinants of growth without normative judgment. Estimation of a simple catch-up and factor-accumulation model supports the previous conclusions of Dowrick and Nguyen (1989), following the work of Gruen (1986), that productivity growth in Australia, at least since 1960, has proceeded at very much the rate to be expected of a mature, industrialised economy – levelling off at a rate of about one per cent per annum.
Whilst investment rates in the 1980s were slightly higher (by 1.7 percentage points) than average for European/OECD economies, so too was the rate of increase in population and labour force (by about 1 percentage point), partly through natural increase and partly through a major immigration program. The net effect on simple factor accumulation is probably that population and labour force growth have outweighed the investment factor, so capital intensity in Australia has probably grown slightly less rapidly than in other advanced economies. The growth accounting relationships of the final regression suggest that this capital dilution effect has probably reduced Australian labour-productivity growth over the 1980s by around 0.1 percentage points. Residual productivity growth has, however, increased slightly since the 1970s. It is probable that the large increases in educational attainment over the past 15 years, especially amongst females, have contributed to this mild pick-up in productivity growth.
Of course, to say that Australian growth performance has been average suggests that there is plenty of room for improvement – as well as plenty of opportunity for deterioration. Most obviously, we would expect an increase in savings and investment to increase growth. Current moves to achieve this through compulsory superannuation might well be successful, following the example of other compulsory savings schemes in Asia, if they are not offset by reductions in public saving and in voluntary private saving.
Even if compulsory superannuation does increase saving, investment and growth there remains the question of whether such strategies are necessarily welfare improving. A higher rate of growth does not necessarily mean that we are better off if we have to sacrifice current consumption and if we discount the future. Of course, there are arguments about myopia and about growth externalities and imperfect capital markets which can be used to justify compulsory savings schemes. But it is simply not sufficient to justify policies solely in terms of their impact on growth.
The savings/superannuation debate also raises important questions about the direction of investment. If savings are extracted compulsorily one can argue that there is additional obligation on government, reinforcing its standard public interest duties, to ensure that the institutional and taxation framework are set up to maximise social returns.
The De Long and Summers' findings on above average returns to investment in equipment, rather than investment in buildings and structures, confirm popular prejudice against the apparent predilection of the financial system for ‘speculative’ investment in property. There are important implications for Australian policy. Not only do Australian producers face relatively high prices for equipment investment compared to other OECD producers, but also the tax system strongly favours investment in housing and offices. There is a strong case that tax and tariff policies should be amended to prevent the diversion of resources away from investment in equipment and machinery.
Pender and Ross (1993) found that despite major reforms to the Australian tax system over the last decade, there remain substantial distortions. For instance, with an annual inflation rate of three per cent, the effective tax rate for a local corporation investing in equipment is nearly double that on investment in buildings and nearly four times the effective tax rate for investment in owner-occupied housing. These rates are listed in Table 8.
| Ownership | Asset | Real effective tax rates % |
|---|---|---|
| Owner-occupier | housing | 11.4 |
| Negatively geared rental | housing | −0.8 |
| Locally-owned company listed on the ASX | machinery | 42.5 |
| Locally-owned company listed on the ASX | buildings | 27.6 |
|
Source: Pender and Ross (1993, Tables 5 and 6). |
||
Another important argument about the direction of investment concerns the provision of infrastructure of modern communications and transport. There is compelling evidence from a wide range of studies that such investments typically attract high rates of social return and are important in promoting growth. This makes the picture of declining public investment, as illustrated in Figure 7, a matter for concern.
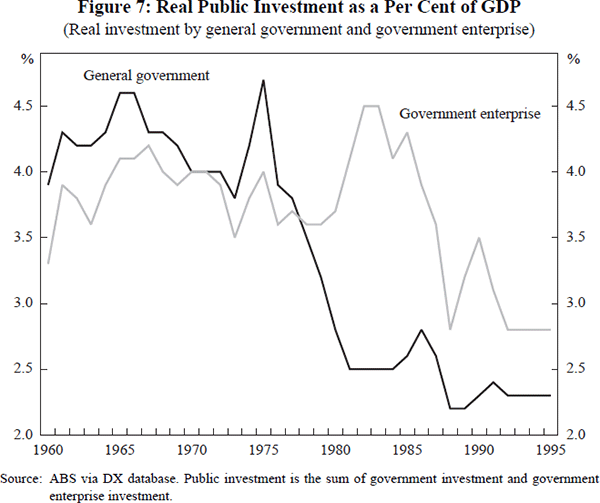
Of course it can be argued that private investment in infrastructure can substitute for public provision. But the economics of public good provision militate against that, and international evidence suggests that on average public infrastructure is complementary to rather than a substitute for private investment. Moreover, to the extent that network externalities are important in industrial development – vis-à-vis the high growth areas of Silicon Valley, Northern Italy and the growth poles of East Asia – it can be argued that the tyranny of distance and scale in Australia call for better than average infrastructure. So it is of particular concern that current levels of government investment are well below those of most OECD countries, as illustrated in Figure 8.
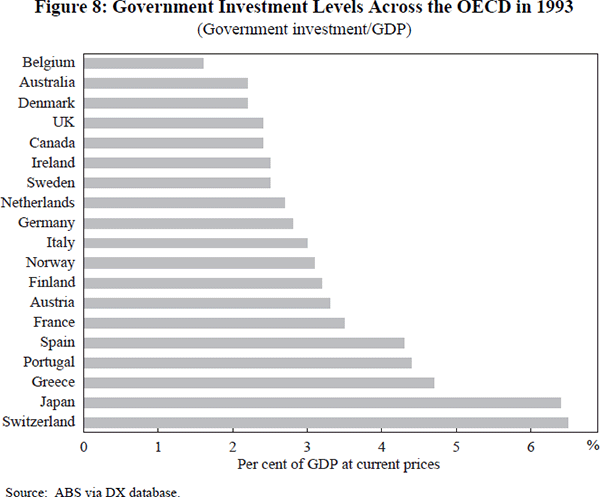
Arguments about the growth potential of public infrastructure also support the need for efficient operation of that infrastructure, implying that there may be a growth dividend to microeconomic reform in the infrastructure sector, over and above the short-term efficiency gains. EPAC's (1995) recent call for better planning and selection of infrastructure projects is certainly to be applauded, but this does not weaken the case for increasing aggregate spending on public investment.
It seems likely that one of the constraints on government which has contributed to the decrease in public investment has been a perceived imperative for fiscal restraint and balanced budgets. This imperative is debateable for areas of public consumption expenditures. There appears to be a trade-off between current tax-financed consumption and future growth, at least at the relatively high levels of public consumption current in Australia (about 19 per cent of GDP). Although there is no presumption that growth maximisation should dominate current benefits from public consumption, there is certainly a reasonable case in terms of inter-generational equity that current consumption should be financed out of current taxation.
When it comes to public investment, however, there is no such evidence that current public expenditures are at the expense of growth prospects, rather the opposite. Since many of the direct and indirect benefits are likely to be long-lived, nor is there any presumption that public investments should be financed out of current receipts any more than private investment should be financed out of current income.
One important and potentially very beneficial policy move would be to separate out the current consumption and public investment components of the government budget in order to promote separate debates on appropriate levels of expenditure and sources of funding, and to move away from the economically vacuous obsession of commentators and markets alike with the composite ‘bottom line’ of current cash flow. Such a move could create the conditions for an informed and rational debate about the level and direction of public investment and borrowing. Such a debate would be greatly helped if at least some of the current macro-modelling of fiscal policy would recognise the widespread evidence of private-sector productivity gains arising out of public-sector investment.
An important part of this debate should concern the extent to which public expenditure on education should be seen as contributing to private benefits as opposed to external effects and social returns. The econometric and case study evidence suggests high social returns to investment in human capital, and important demographic and social consequences resulting from women catching up on male educational attainment. There is as yet insufficient evidence from the aggregate growth studies to distinguish clearly between the different levels and types of educational investment. Nevertheless, it seems clear that continued improvement in the educational attainment of Australians is a vital ingredient in both current welfare and future growth prospects.
When it comes to research policy, it is much less clear what should be appropriate public policies for a relatively small population in a resource rich country. Whilst feedback loops in the development of the world's knowledge stock may well be the driving force behind much of what we loosely term technological progress, it is less evident that a country like Australia need be at the forefront of this knowledge creation. A free-riding strategy might well be optimal. On the other hand, there is substantial microeconomic evidence that the ability to absorb appropriate knowledge does depend to some extent on maintaining one's own research capability and research networks. There appear to be compelling arguments that one important way of maintaining such a research capability is to facilitate cooperative research ventures and industry-wide research boards.
Footnotes
The regional groupings of Africa, Asia and Latin America are self-explanatory. They are also groupings which have been found in a range of econometric studies to have distinctive post-war growth patterns. The African grouping is often broken down into sub-and super-Saharan, countries. However, since I have little to say about development in either of these groupings the distinction is not important for this paper. I have omitted the oil-exporting economies of the Middle East, since most of their growth performance over the past 20 years needs to be explained in terms of the OPEC cartel. I have also omitted the centrally-planned economies of Eastern Europe. There is a residual group of 27 countries for which consistent data on productivity are available. This group consists of 22 countries from Europe, two from North America, two from Australasia plus Israel. I refer to this grouping as ‘Europe/OECD’. A strict geographic grouping would drop out the last five. Current or past membership of the OECD would eliminate three (Malta, Cyprus and Israel). But all countries can claim some homogeneity as market economies with historical, political and cultural links to ‘the West’ and also through a level of development by 1950 represented by real per capita incomes of at least one thousand dollars (1985 US$). [1]
Where int$ are values measured at international prices, normalised to the 1985 US$ value of US GDP. [2]
Quah (1993) has explained Galton's ‘fallacy’, pointing out that regression to the mean, in this context a tendency for poorer countries to grow faster than richer countries, is a necessary condition for convergence – but it is not sufficient. If random disturbances to growth are sufficiently high, dispersion measured by the variance of log GDP per capita may increase even though individuals tend on average to move towards the mean. [3]
This is a well-established result. See, for instance, Dowrick and Nguyen (1989). [4]
In fact, Sarel, in this Volume, challenges the view that East-Asian growth performance has been miraculous. [5]
See, for example, Yang and Borland (1991). [6]
The result is worryingly sensitive to the assumed parameters. If γ is only slightly less than unity, then the feedback mechanism is not strong enough on its own to generate long-run growth; diminishing returns will set in. If γ exceeds unity, even slightly, then growth may become explosive. Romer (1994) suggests that this is more a problem for mathematical modelling than for economic analysis. [7]
Once again, however, we have a situation where the model generates steady-state growth only with a very precise combination of parameter settings. [8]
Sarel, in this Volume, also assigns a major role to initial conditions. [9]
Especially if knowledge has a substantial feedback effect so that the larger the stock of knowledge, the easier it is to expand that stock. [10]
Coe and Helpman claim to have dealt with such endogeneity by using the stock of R&D knowledge at the beginning of the year to predict the subsequent year's level of productivity. But the very strong persistence of both series makes such a procedure of doubtful use. [11]
References
Abramovitz, M. (1986), ‘Catching Up, Forging Ahead, and Falling Behind’, Journal of Economic History, 46(2), pp. 385–406.
Acs, Z.J. and D.B. Audretsch (1993), ‘Innovation and R&D Spillovers’, CEPR Discussion Paper No. 865, Centre for Economic Policy Research, London.
Aschauer, D.A. (1989), ‘Is Public Expenditure Productive?’, Journal of Monetary Economics, 23(2), pp. 177–200.
Auerbach, A.J., K.A. Hassett and S.D. Oliner (1993), ‘Reassessing the Social Returns to Equipment Investment’, NBER Working Paper No. 4405.
Backus, D.K., P.J. Kehoe and T.J. Kehoe (1992), ‘In Search of Scale Effects in Trade and Growth’, Journal of Economic Theory, 58(2), pp. 377–409.
Barro, R.J. (1990), ‘Government Spending in a Simple Model of Endogenous Growth’, Journal of Political Economy, 98(5:2), pp. S103–S126.
Barro, R. and J.W. Lee (1993), ‘International Comparisons of Educational Attainment’, Journal of Monetary Economics, 32(3), pp. 363–394.
Barro, R. and J.W. Lee (1994), ‘Sources of Economic Growth’, Carnegie-Rochester Conference Series on Public Policy, 40(2), pp. 1–46.
Barro, R. and X. Sala-i-Martin (1995), Economic Growth, McGraw-Hill, New York.
Brander, J. and S. Dowrick (1994), ‘The Role of Fertility and Population in Economic Growth’, Journal of Population Economics, 7(1), pp. 1–25.
Coe, D.T. and E. Helpman (1993), ‘International R&D Spillovers’, IMF Working Paper WP/93/84.
De Long, J.B. and L. Summers (1991), ‘Equipment Investment and Economic Growth’, Quarterly Journal of Economics, 106(2), pp. 445–502.
De Long, J.B. and L.H. Summers (1992), ‘Equipment Investment and Economic Growth: How Strong is the Nexus?’, Brookings Papers on Economic Activity, 2, pp. 157–199.
Dowrick, S. and D.T. Nguyen (1989), ‘OECD Comparative Economic Growth 1950–85: Catch-up and Convergence’, American Economic Review, 79(5), pp. 1010–1030.
Dowrick, S. (1993), ‘Wage Bargaining Systems and Productivity Growth in OECD Countries’, EPAC Background Paper No. 26, AGPS, Canberra, pp. 1–49.
Dowrick, S. (1994a), ‘Openness and Growth’, in P. Lowe and J. Dwyer (eds), International Integration of the Australian Economy, Reserve Bank of Australia, Sydney, pp. 19–41.
Dowrick, S. (1994b), ‘The Role of Research and Development in Growth – A Survey of the New Theory and Evidence’, Conference on Research and Development and Economic Growth, conference proceedings, Industry Commission, Canberra, pp. 1–30.
Dowrick, S. (1995a), ‘Demographic Change, Investment and Growth’, Asia-Pacific Economic Review, 1(1) (forthcoming).
Dowrick, S. (1995b), ‘Estimating the Impact of Government Consumption on Growth’, Empirical Economics (forthcoming).
Dowrick, S. and B.J. Spencer (1994), ‘Union Attitudes to Labor-Saving Innovation: When are Unions Luddites?’, Journal of Labor Economics, 12(2), pp. 316–344.
Easterly, W. and S. Rebelo (1993), ‘Fiscal Policy and Economic Growth’, Journal of Monetary Economics, 32(3), pp. 417–458.
EPAC (1995), Private Infrastructure Task Force: Commissioned Studies, AGPS, Canberra.
Feldman, M.P. (1993), ‘An Examination of the Geography of Innovation’, Industrial and Corporate Change, 2(3), pp. 451–470.
Gans, J.S. (1995), ‘Industrialisation Policy and the Big Push’, paper presented at Australian Economic Theory Workshop, University of New South Wales, Sydney.
Geroski, P. (1991), ‘Innovation and the Sectoral Sources of UK Productivity Growth’, Economic Journal, 101 (409), pp. 1438–1451.
Griliches, Z. (1991), ‘The Search for R&D Spillovers’, NBER Working Paper No. 3768.
Grossman, G.M. and E. Helpman (1991), Innovation and Growth in the Global Economy, The MIT Press, Cambridge, Massachusetts.
Gruen, F.H. (1986), ‘How Bad is Australia's Economic Performance and Why?’, Economic Record, 62 (177), pp. 180–193.
Hammond, P.J. and A. Rodriguez-Clare (1993), ‘On Endogenizing Long-Run Growth’, Scandinavian Journal of Economics, 95(4), pp. 391–425.
Jones, L.E. and R. Manuelli (1990), ‘A Convex Model of Equilibrium Growth: Theory and Policy Implications’, Journal of Political Economy, 98(5), pp. 1008–1038.
Kelley, A. (1988), ‘Economic Consequences of Population Change in the Third World’, Journal of Economic Literature, 26(4), pp. 1685–1728.
King, R.G. and R. Levine (1993), ‘Finance, Entrepreneurship, and Growth’, Journal of Monetary Economics, 32(3), pp. 513–542.
Krugman, P.R. (1994), ‘The Myth of Asia's Miracle’, Foreign Affairs, 73(6), pp. 62–78.
Lee, W.J. (1993), ‘International Trade, Distortions, and Long-Run Economic Growth’, IMF Staff Papers, 40(2), pp. 299–328.
Levine, R. and D. Renelt (1992), ‘A Sensitivity Analysis of Cross-Country Growth Regressions’, American Economic Review, 82(4), pp. 942–963.
Lichtenberg, F.R. (1992), ‘R&D Investment and International Productivity Differences’, NBER Working Paper No. 4161.
Lucas, R.E. (1988), ‘On the Mechanics of Economic Development’, Journal of Monetary Economics, 22(1), pp. 3–42.
Lynde, C. and J. Richmond (1992), ‘The Role of Public Capital in Production’, Review of Economics and Statistics, 74(1), pp. 37–44.
Lynde, C. and J. Richmond (1993), ‘Public Capital and Total Factor Productivity’, International Economic Review, 34(2), pp. 401–414.
Maddison, A. (1992), ‘A Long Run Perspective on Saving’, Scandinavian Journal of Economics, 94(2), pp. 181–196.
Mankiw, N.G., D. Romer and D.N. Weil (1992), ‘A Contribution to the Empirics of Economic Growth’, Quarterly Journal of Economics, 107(2), pp. 407–437.
Munnell, A.H. (1992), ‘Policy Watch: Infrastructure Investment and Economic Growth’, Journal of Economic Perspectives, 6(4), pp. 189–198.
Murphy, K.M., A. Shleifer and R.W. Vishny (1989), ‘Industrialization and the Big Push’, Journal of Political Economy, 97(5), pp. 1003–1026.
Nadiri, M.I. (1993), ‘Innovations and Technological Spillovers’, NBER Working Paper No. 4423.
Nuxoll, D.A. (1994), ‘Differences in Relative Prices and International Differences in Growth Rates’, American Economic Review, 84(5), pp. 1423–1436.
Olsen, M. (1971), The Logic of Collective Action: Public Goods and the Theory of Groups, Harvard University Press, Cambridge, Massachussetts.
Otto, G. and G.M. Voss (1994), ‘Public Capital and Private Sector Productivity’, Economic Record, 70(208), pp. 121–132.
Pender, H. and S. Ross (1993), Income Tax and Asset Choice in Australia, EPAC Research Paper No. 3, AGPS, Canberra.
Persson, T. and G. Tabellini (1994), ‘Is Inequality Harmful for Growth’, American Economic Review, 84(3), pp. 600–621.
Pitchford, J.D. (1960), ‘Growth and the Elasticity of Factor Substitution’, Economic Record, XXXVI(76), pp. 491–504.
Quah, D. (1993), ‘Galton's Fallacy and Tests of the Convergence Hypothesis’, Scandinavian Journal of Economics, 95(4), pp. 427–443.
Rebelo, S. (1991), ‘Long-Run Policy Analysis and Long-Run Growth’, Journal of Political Economy, 99(3), pp. 500–521.
Romer, P.M. (1986), ‘Increasing Returns and Long-Run Growth’, Journal of Political Economy, 94(5), pp. 1002–1037.
Romer, P.M. (1990), ‘Endogenous Technological Change’, Journal of Political Economy, 98(5:2), pp. S71–S102.
Romer, P.M. (1994), ‘The Origins of Endogenous Growth’, Journal of Economic Perspectives, 8(1), pp. 3–22.
Rostow, W.W. (1971), The Stages of Economic Growth, Cambridge University Press, Cambridge.
Sarel, M. (1994) ‘On the Dynamics of Economic Growth’, IMF Working Paper WP/94/138.
Summers, R. and A. Heston (1991), ‘The Penn World Table (Mark 5): An Expanded Set of International Comparisons 1950–1988’, Quarterly Journal of Economics, 106(2), pp. 327–368.
Suzuki, K. (1993), ‘R&D Spillovers and Technology Transfer Among and Within Vertical Keiretsu Groups: Evidence from the Japanese Electrical Machinery Industry’, International Journal of Industrial Organisation, 11, pp. 573–591.
Weder, R. and H.G. Grubel (1993), ‘The New Growth Theory and Coasean Economics: Institutions to Capture Externalities’, Weltwirtschaftliches Archiv, 129(3), pp. 488–513.
World Bank (1993), The East-Asian Miracle: Economic Growth and Public Policy, Oxford University Press, Oxford.
Yang, X. and J. Borland (1991), ‘A Microeconomic Mechanism for Economic Growth’, Journal of Political Economy, 99(3), pp. 460–482.
Young, A. (1992), ‘A Tale of Two Cities: Factor Accumulation and Technical Change in Hong Kong and Singapore’, NBER Macroeconomics Annual 1992, The MIT Press, pp. 13–54.
Young, A. (1993), ‘Invention and Bounded Learning By Doing’, Journal of Political Economy, 101(3), pp. 443–472.