RBA Annual Conference – 1995 Growth in East Asia: What We Can and What We Cannot Infer From It Michael Sarel[*]
In a world full of countries desperately trying to get richer, the winners become influential models for the rest. But exactly what is it that accounts for their success? This isn't merely an abstract academic debate. The consensus tends to get built into the policies of dozens of ambitious countries, affecting patterns of world trade and much else’ (Washington Post 1995).
1. Introduction
It is now widely accepted that many countries in East Asia achieved a remarkable record of high and sustained economic growth. This achievement is possibly one of the most important economic developments in the past generation. Explaining East Asia's success is extremely important, for at least two reasons. First, such an explanation might show the way to replicate this success in other regions of the world. Second, even if East Asia's success is not replicable elsewhere, there is an urgent intellectual need to solve the puzzle of the phenomenal East-Asian growth rates. After all, not being able to explain such an important economic phenomenon would be a major defeat for the economics profession.
Despite the impressive number of research papers, books and articles published in recent years about the high-performing East-Asian economies, there is very little agreement on the main determinants of their success. Many economists describe the growth performance of the East-Asian economies – in particular, of Hong Kong, Korea, Taiwan and Singapore – as ‘miraculous’. Ironically, they also offer plenty of possible explanations for these miracles. These various explanations are diverse and use different categories of arguments. They are, if nothing else, a testimony to the creativity and cleverness of their authors.
The abundance of literature on the East-Asian miracle created a number of independent (and sometimes contradictory) explanations, feeding an ideologically charged debate that crosses many interdisciplinary boundaries. The number of these explanations vastly exceeds the number of miracles that have to be explained. To put it differently, there is a severe problem with the number of observations that can be used to discriminate between the different theories. Accordingly, the main objective of this study is not to present new evidence or theories on East Asia's success. Instead, it attempts to critically review the different arguments and the main points raised by the studies that have already addressed these issues, presenting some of their most important arguments and counter-arguments. The few original arguments in this study highlight problems associated with the existing analysis of East-Asian success.
The attempt to analyse some of the views in this debate inevitably concentrates only on some of its most important dimensions leaving out many interesting aspects.[1] In this study, the debate is classified along four main dimensions:
- the debate about the nature of economic growth in the fastest-growing Asian economies – that is, whether it was driven by productivity growth or massive factor accumulation;
- the debate about the role of public policy in general and, in particular, the role of selective interventions in promoting growth;
- the debate about the role of high investment rates and a strong export orientation as possible engines that drive the rapid economic growth in East Asia; and
- the debate regarding the importance of the initial conditions in economic growth and their relevance for policy.
Accordingly, the paper is organised as follows: after a very quick review of the main facts about growth in East Asia, it deals in turn with each one of the four dimensions of the debate. Finally, it offers some concluding remarks.
2. The Facts
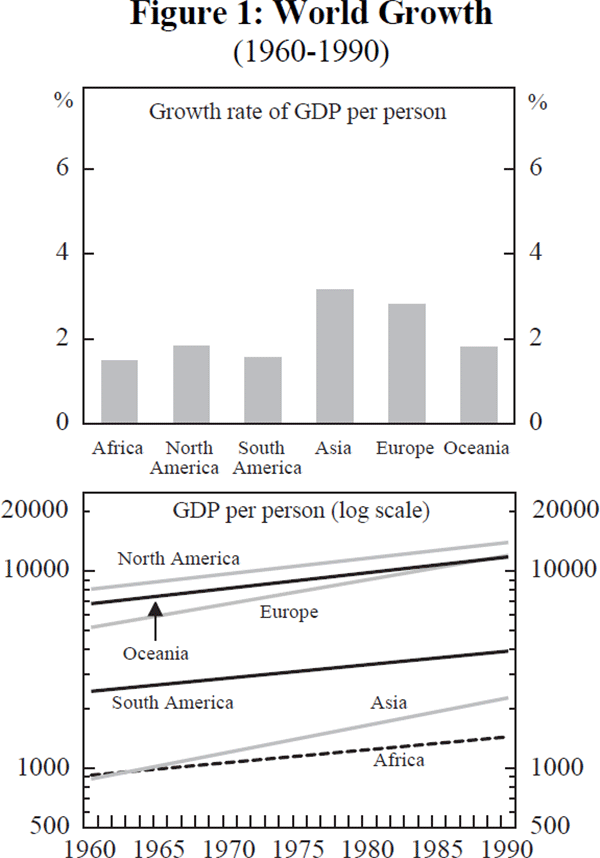
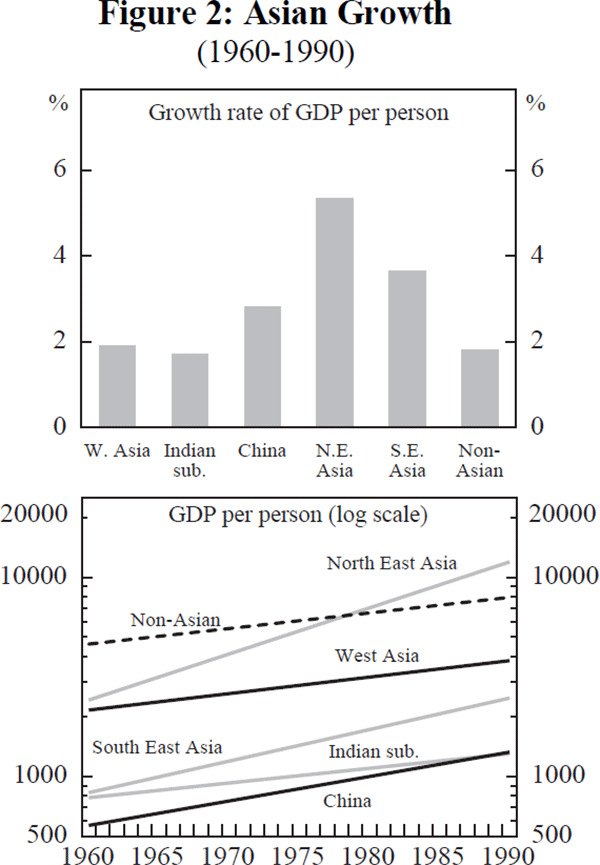
The growth experience of Asian countries during the past generation is quite remarkable. As Figure 1 shows, the average growth rate achieved by the Asian continent is higher than the growth rates of any other region in the world. Since Asia is by far the largest and the most populous continent, it is natural to divide it into smaller regions and to compare the growth performance across the Asian countries. Figure 2 shows that the higher growth rates of the Asian economies (relative to the non-Asian economies) is fully explained by the superior performance of the eastern half of Asia, a region that includes the following ten countries: China, Hong Kong, Japan, Korea, Taiwan, Indonesia, Malaysia, the Philippines, Singapore and Thailand. The western part of Asia, as well as the Indian sub-continent, experienced rates of growth that are very similar to those of non-Asian countries.
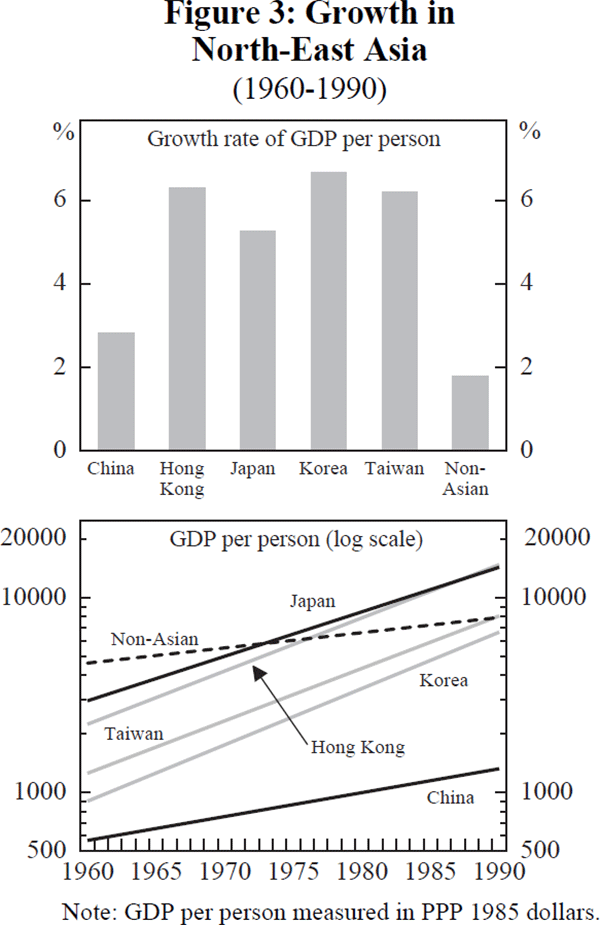
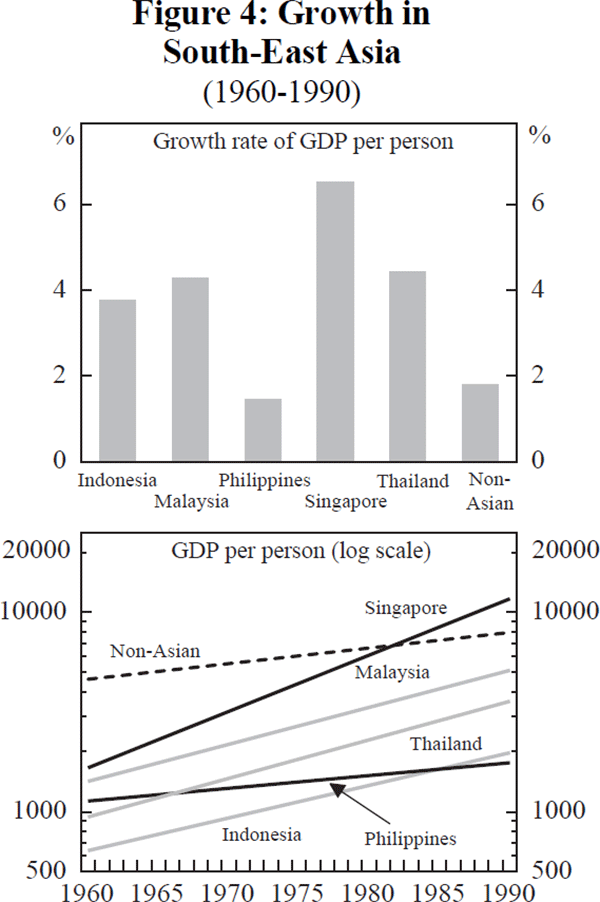
Figures 3 and 4 go one step further and show the growth performance of each of the ten countries in East Asia. Here we can observe a large degree of variation between the individual economies. The worst performing country in this region, the Philippines, experienced a growth rate similar to the non-Asian economies, less than 2 per cent per year. Five of the countries (China, Japan, Indonesia, Malaysia and Thailand) achieved growth rates of around 3–5 per cent. These excellent growth rates are quite impressive, but are still modest in comparison with the phenomenal growth rates experienced by Hong Kong, Korea, Taiwan and Singapore. These countries, which came to be known as the ‘Four Tigers’, were the strongest performers, all four having similar annual growth rates of output per person, well in excess of 6 per cent. One simple reading of these results can show why these growth rates, sustained over a 30-year period, are simply amazing: while the average resident of a non-Asian country in 1990 was 72 per cent richer than his parents were in 1960, the corresponding figure for the average Korean is not less than 638 per cent.
3. The Nature of Growth: Productivity or Factors Accumulation?
This section presents the big debate about the nature of the growth process in East Asia, and in particular in Hong Kong, Korea, Taiwan and Singapore. This debate has profound implications about the future of the growth process in East Asia. It also raises difficult questions regarding the aspiration of other countries to imitate the East-Asian success. But first we have to introduce the basics of growth accounting, a simple method used to decompose growth rates, which lies at the centre of the arguments presented in this debate.
3.1 Some Simple Growth Accounting
The Cobb-Douglas production function is defined as:

where Y is the amount of output, A is a technological constant, K is the amount of capital used as input, L is the amount of labour used as input, t is a time subscript and α is a parameter with a value between 0 and 1.
This production function, with a value of α around one-third, is often used to approximate the production possibilities of the economy. The reason is that it has many properties that we tend to observe in the national economies, such as constant returns to scale and constant factor income shares (with a capital share of α and a labour share of 1-α).
Dividing equation (1) by the population size, we get:

where y is the output per person, k is the capital per person and l represents labour per person (or the labour participation rate).
Equation (2) is a static equation. It represents the amount of output, as a function of inputs, in any specific period t. But from it, we can derive a dynamic version that describes how output per person increases over time:

Equation (3) decomposes the growth rate of output per person into three elements: the first element describes the growth rate of productivity (this term is also called the growth of total-factor productivity (TFP), the rate of technological progress, or the Solow residual); the second element describes the contribution of the capital stock per person growth rate; and the third element describes the contribution of the labour participation growth rate.
The decomposition done in equation (3) has a very important empirical application. We have a good idea about the magnitude of the parameter α (about one-third), it is easy to measure the growth rate of output per person, and it is possible, in principle, to measure the capital per person and the labour participation growth rates (the second and the third terms in (3)). Therefore, we can estimate the growth rate of technology (or productivity) and calculate the proportion of output growth per person attributable to this technological progress.
The growth decomposition in equation (3) also leads to an interpretation that plays a fundamental role in understanding long-run growth. It points out that a significant and sustained rate of technological progress is the only possible way, in the long run, for an economy to achieve a sustained rate of growth of output per person. The intuition for this result is that the labour participation rate can only increase for a while, but obviously cannot increase without bounds in the long run. Furthermore, higher growth in capital than in labour will lead to diminishing returns to capital with output growth falling over time, even if capital growth is maintained. Therefore, in order to achieve permanent growth, an economy must continuously improve its technology. This kind of growth is called ‘intensive growth’. In contrast to intensive growth, increasing output by increasing inputs (‘extensive growth’) can work only for a limited period, but it cannot last too long.
In a famous study, Solow (1956) conducted a growth accounting exercise such as the one suggested by equation (3). Not surprisingly, he found that technological progress accounts for most of the growth of output per person, while accumulation of capital and changes in the participation rate play only a minor role. Since then, many other studies confirmed again and again that technological progress plays the major role in long-run economic growth. Accordingly, the traditional view about the success of the East-Asian countries emphasised the role of technological progress in the high growth rates achieved by these economies, and indeed most of the attention focused on the fast ‘technological catch-up’ in these economies.
3.2 A Contrarian View: The Extensive Growth Hypothesis
The collapse of the Soviet economy around 1990, after its apparent success in the previous decades, caught most people by surprise. Among many economists, the favourite explanation of this economic collapse is the ‘Extensive Growth Hypothesis’. Easterly and Fischer (1994), among others, argue that the Soviet economy ran into inevitable diminishing returns after many decades of extensive growth caused by massive accumulation of capital not accompanied by technological progress, just as predicted by the growth-accounting framework.
This extensive growth hypothesis raises serious concerns about other economies that invested heavily during the past decades, and in particular some of the East-Asian countries. This comparison is explicitly made by Krugman (1994, p. 70):
The newly industrialising countries of Asia, like the Soviet Union of the 1950s, have achieved rapid growth in large part through an astonishing mobilisation of resources. Once one accounts for the role of rapidly growing inputs in these countries' growth, one finds little left to explain. Asian growth, like that of the Soviet Union in its high-growth era, seems to be driven by extraordinary growth in inputs like labour and capital rather than by gains in efficiency.
These dramatic conclusions convey a very pessimistic message:
- The process of economic growth in the most successful economies in East Asia is not at all miraculous: it is just the expected outcome of massive accumulation of inputs.
- The path of growth that these economies followed in the past 30 years is not sustainable. Sooner or later, they will experience a dramatic decrease in their growth rates.
- The societies in these countries paid a huge price for achieving these impressive growth rates: they sacrificed a large amount of consumption and of leisure. Therefore, even if their so-called success can be replicated in other countries, it is probably not wise to do so.
The main issue, of course, is if the nature of the East-Asian growth process is indeed extensive, as Krugman concludes, or rather intensive. The ‘extensive’ view is based mainly on the research of Young (1992, 1994a and 1994b) and of Kim and Lau (1994). Young (1994b), for example, documents the fundamental role played by factor accumulation in explaining the extraordinary post-war growth of Hong Kong, Singapore, South Korea and Taiwan. His main conclusion is that ‘… one arrives at total factor productivity growth rates, both for the non-agricultural economy and for manufacturing in particular, which are well within the bounds of those experienced by the OECD and Latin American economies over equally long periods of time. While the growth of output and manufacturing exports in the newly industrialising economies of East Asia is virtually unprecedented, the growth of total factor productivity in these economies is not’ (Young 1994b, p. i).
In a different study, Kim and Lau (1994) compare the sources of economic growth of the Four Tigers (Hong Kong, Korea, Taiwan and Singapore) with those of the G5 industrialised countries (the United States, Japan, West Germany, France and the United Kingdom). In this study, Kim and Lau use a new empirical methodology for estimating the relationship between aggregate output and inputs, including technical progress, from inter-country data, called the ‘meta-production function’. Their conclusion is that ‘… the hypothesis that there has been no technical progress during the post-war period cannot be rejected for the four East-Asian newly-industrialised countries. By far the most important source of economic growth of the East-Asian newly-industrialised countries is capital accumulation, accounting for between 48 and 72 per cent of their economic growth, in contrast to the case of the Group-of-Five industrialised countries, in which technical progress has played the most important role, accounting for between 46 and 71 per cent of their economic growth’. Furthermore, they found that ‘[a]n international comparison of the productive efficiencies of the G5 countries and the East-Asian newly-industrialised countries indicates no apparent convergence between the technologies of the two group of countries’ (Kim and Lau 1994, pp. 235–236).
The results of the two studies just described can have a large impact on the views of many economists on the nature of the growth process in East-Asian countries, and on their role as models for others. But how conclusive are these results? Given the simplicity of the growth-accounting theory, it appears that there should be no significant problems associated with this type of exercise. But in practice things tend to become very complicated. In general, as the next section will demonstrate, the conclusions based on these kind of studies are not very robust, but rather sensitive to the specific assumptions of each particular study.
The main reason for this sensitivity is the estimation process of the capital stock growth rate during the period studied. It is extremely difficult to estimate the capital stock in the base period, especially in the case of countries like the Four Tigers, for which there are no good data before 1960. Such an estimation is usually based on heroic assumptions regarding the depreciation rate of the capital stock and the investment flows in the period that precedes the beginning of the period studied. For example, what are the depreciation rates of the different types of capital? Are they equal across countries and across industries, or are they higher in the case of the fastest-growing economies? What method of extrapolation is being used to estimate the investment flows in the past? And what is the period that is used as reference for this extrapolation?
Additional significant problems are estimating the income share of capital (α) and the amount of labour per person (l). For example, should α be allowed to differ across countries and across industries? Should the official statistics regarding the labour participation be trusted? Is the amount of effective work proportional to the number of hours that people work, or does working extra hours lead to diminishing returns? And should the different types of labour be summed together? Most importantly, how should human capital be treated?
Even the most clever solutions to these problems cannot provide a categorical and irrefutable answer regarding the nature of the growth process, certainly not in the context of the East-Asian economies. Therefore, the results presented in studies such as those just described should not be regarded as definitive. Instead, they should be viewed as interesting, but only suggestive. More research, and certainly more time-series data, are required before reaching significant conclusions about this important issue.
3.3 Back to Growth Accounting: Some Counter-Contrarian Evidence
In this section, we conduct a growth-accounting exercise along the lines suggested by Young (1994a). Our database is the (PWT5.6a) update for the Summers and Heston (1991) database, and the period studied is 1960–90. The values for the different parameters and the method of extrapolation are conventional: the log of total investment during this period is extrapolated backwards, up to 1900; the capital stock is assumed to be 0 in 1900, and to subsequently increase by the investment flows, less depreciation; the values of the depreciation rate and of α are assumed to be, respectively, 0.04 and one-third; and we estimate the growth rate of the capital stock (and of productivity) only for the period 1975–90, trying to reduce the problems associated with the estimation of the capital stock in the base period.
The growth-accounting exercise conducted in this section does not attempt to improve upon or to compete with the results obtained by Young (1994b) and by Kim and Lau (1994). Both these studies are excellent exercises, carefully conducted and presented. The only intention of this exercise is to demonstrate the general fragility of conclusions about the nature of the growth process in East Asia.
Figures 5 to 8 describe the results of this growth accounting exercise. Figure 5 compares the growth rates of output per person of the Four Tigers with those in the rest of the world during the periods 1960–75 and 1975–90. The first four bars in this figure describe the growth rates of Hong Kong, Korea, Taiwan and Singapore. The fifth bar describes the simple average of the growth rate during the same period of other 100 countries, representing the rest of the world (‘row’). The sixth bar represents the mean of the growth rate in the rest of the world, plus 1.96 standard deviations (‘row+1.96sd’). Assuming a normal statistical distribution, 95 per cent of the growth observations are expected to be found within 1.96 standard deviations of the mean value. Accordingly, there is a statistical chance of only 2.5 per cent that an economy will experience a growth rate higher than the value represented by the sixth bar. We define growth rates as ‘high’ if they are above ‘row’ but below ‘row+1.96’, ‘very high’ if they are around the ‘row+1.96sd’ value, and ‘outstanding’ if they exceed this value. Figure 5 shows that the growth rates of Hong Kong, Korea and Taiwan were ‘very high’ in the 1960–75 period and ‘outstanding’ in the 1975–90 period, while the growth rate of Singapore displayed the opposite pattern. (Therefore, the growth rates of the Four Tigers during the extended period 1960–90 do indeed deserve to be described as miraculous.)
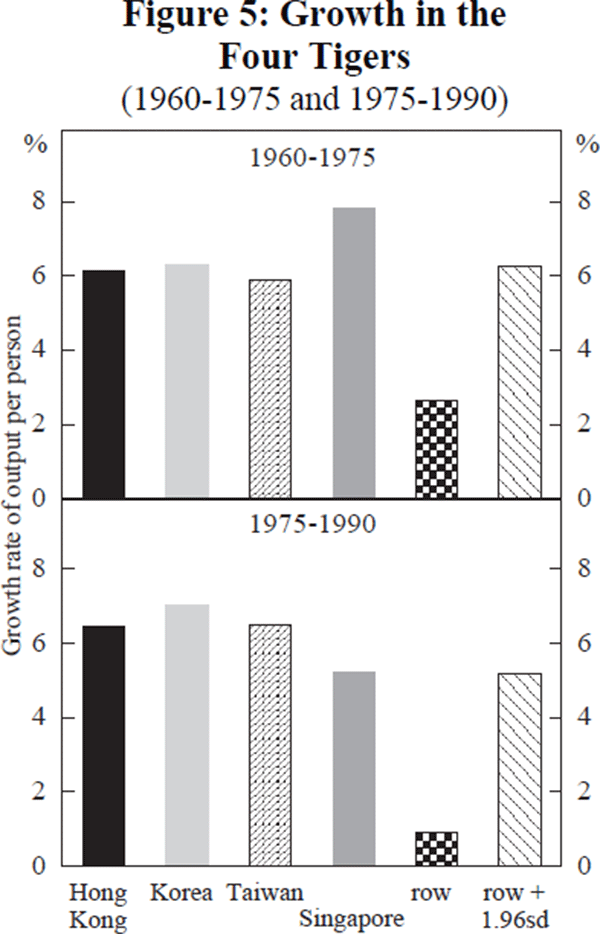
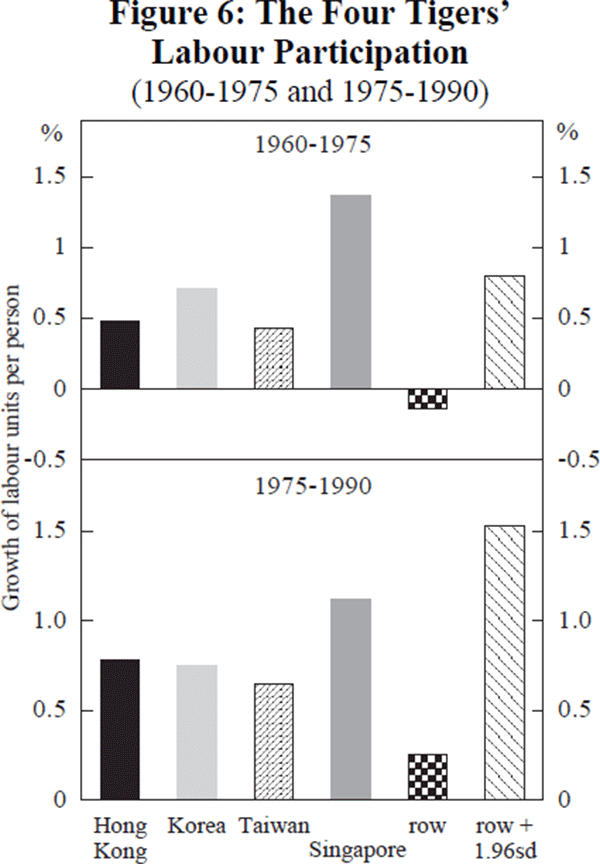
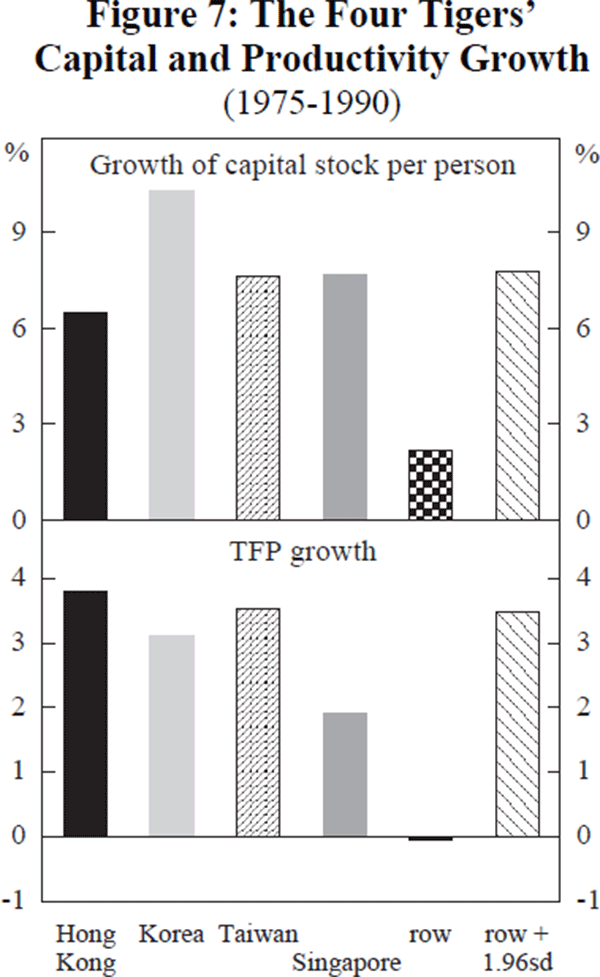
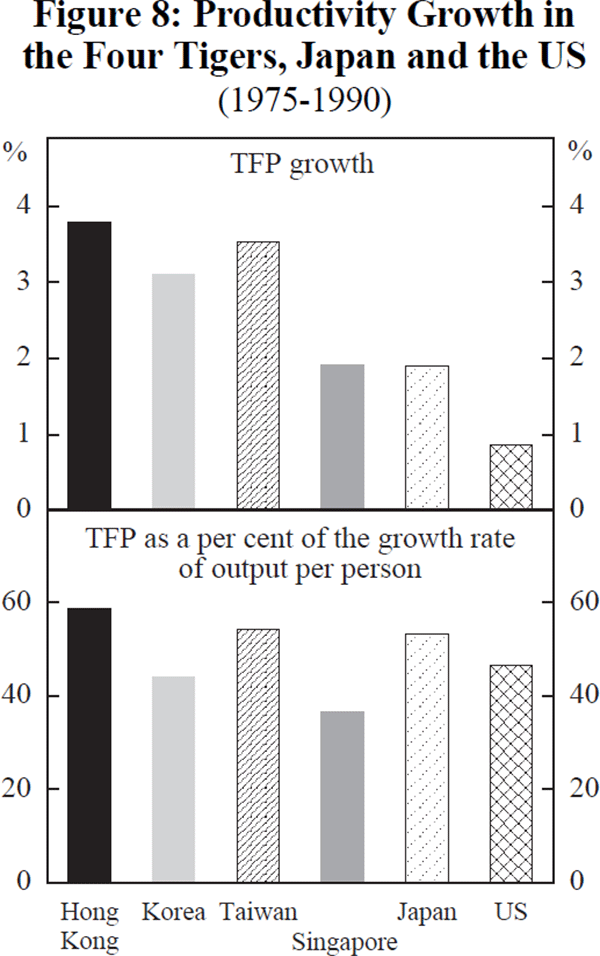
Figure 6 describes, in the same manner, the growth of labour participation. The growth of labour participation was in general ‘high’ for the Four Tigers in both periods, and was ‘outstanding’ only for Singapore in the period 1960–75. In Figure 7, the first panel describes the growth rate of capital per person during the period 1975–90.[2] The rate of capital accumulation was ‘high’ in Hong Kong, ‘very high’ in Taiwan and Singapore, and ‘outstanding’ in Korea. The second panel of Figure 7 describes the final result of this growth accounting exercise: the estimated rate of productivity growth during the period 1975–90. We find this rate to be ‘outstanding’ for Hong Kong, ‘very high’ for Taiwan, something between ‘high’ and ‘very high’ for Korea, and ‘high’ for Singapore.
Figure 8 compares the productivity growth rates in the Four Tigers during 1975–90 with those achieved by Japan and the United States during the same period. The first panel shows that the productivity growth in all Four Tigers exceeded by far the productivity growth in the United States. Three of the four (except Singapore) also experienced higher productivity growth than Japan. The second panel of Figure 8 describes the proportion of growth of GDP per person that is explained by productivity growth. It demonstrates that, in the case of the Four Tigers, this proportion was not systematically different from those of Japan and the United States: for Hong Kong and Taiwan it was slightly higher, while in the case of Korea and Singapore it was slightly lower.
The conclusion that emerges is the following: although the Four Tigers accumulated capital and increased labour participation at a much faster rate than other economies, the increase in these two factors far from fully explains their exceptional growth rates; productivity growth also accounts for a significant fraction. In the case of Hong Kong, Korea and Taiwan, their productivity growth rates are as outstanding as their growth rates. In the case of Singapore, the productivity growth is less spectacular, but is still much above the world average. As a percentage of the growth rates of GDP per person, the productivity growth rates in these four economies are roughly similar to those in Japan and in the United States.
It would be interesting to check how sensitive these findings are to changes in the main parameters of the growth-accounting exercise. Table 1 presents the results of such a sensitivity analysis. The first row of the table shows the average-productivity growth rate among the Four Tigers, obtained by using the baseline parameter values (α = 0.333333, depreciation rate = 0.04, reference period used for extrapolation = 1960–90, estimation period = 1975–90 and beginning of capital accumulation = 1900). The other rows of Table 1 show the average-productivity growth for the same countries that is obtained by changing the values of the different parameters, one at a time.
| Parameter values used in the growth-accounting exercise |
Average rate of productivity growth Hong Kong, Korea, Taiwan, Singapore |
|---|---|
| Baseline parameters | 0.0308 |
| α = 0.25 | 0.0368 |
| α = 0.45 | 0.0224 |
| Depreciation rate = 0.02 | 0.0301 |
| Depreciation rate = 0.08 | 0.0322 |
| Reference period used for extrapolation = 1960–1975 | 0.0307 |
| Reference period used for extrapolation = 1960–1965 | 0.0303 |
| Estimation period = 1980–1990 | 0.0320 |
| Estimation period = 1970–1990 | 0.0281 |
| Estimation period = 1965–1990 | 0.0292 |
| Estimation period = 1960–1990 | 0.0269 |
| Estimation period = 1970–1985 | 0.0204 |
| Beginning of capital accumulation = 1950 | 0.0304 |
| α = 0.45 and estimation period = 1970–1985 | 0.0100 |
The main results of the sensitivity analysis in Table 1 are:
- Some of the parameters (the depreciation rate, the reference period used for extrapolation and the beginning of capital accumulation) do not affect the results in any significant way.
- The two parameters that do have a significant effect on the results are α and the specific estimation period.
It is interesting to note that the findings reported by Young (1994a), regarding the low productivity growth in the Four Tigers, were obtained by using a relatively high value for α (0.45) and a specific estimation period (1970–85). According to Table 1, each one of these choices yields a significantly lower estimate of productivity growth for the economies of Hong Kong, Korea, Taiwan and Singapore. The last line of Table 1 shows the results that are obtained in case both changes (for α and for the estimation period) are made simultaneously. Compared with the baseline calculation, the results are fundamentally different. Instead of obtaining an impressive average productivity growth of 0.0308, the growth-accounting exercise now yields a meagre productivity growth of only 0.0100! No wonder Young (1994a, p. 973) concludes that ‘[i]n general, rapid factor accumulation, of both capital and labour, explains the lion's share of the East Asian growth miracle’.
4. The Role of Public Policy and of Selective Interventions
Lucas (1988, p. 5) asked: ‘Is there some action a government of India could take that would lead the Indian economy to grow like Indonesia's or Egypt's? If so, what, exactly?’. The importance of this question could hardly be exaggerated. A positive answer would be the academic equivalent of possessing a magic ability to transform everything into pure gold. Accordingly, the strongest ambition of the economists who examine the East-Asian success is to identify a set of public policies that promote economic growth.
This section examines three views on public policy and selective interventions by the government, and their roles in the East-Asian growth experience. The first view emphasises the positive role of free markets; it requires the government only to ‘get the basics right’, but opposes any kind of selective government intervention. The second view emphasises the problems associated with free markets, especially in developing countries; it fully embraces the idea that the government should get the basics right, but, in addition to that, it also advocates selective interventionist policies. The third view questions the legitimacy of any conclusions about effects of public policy and of selective interventions on economic growth.
4.1 The ‘Good’: The Neoclassical View
For a long time, this was by far the most popular view among professional economists, especially in the West. It is based mainly on the neoclassical approach to economics in general, and to economic growth in particular, but it also contains some ideological elements of an underlying belief in classical liberalism. The production possibilities of any economy, in this view, are limited at any point in time by the availability of physical resources and by the available technology. The rate of growth in the long run is determined by the rate of technological progress, which is usually viewed as an exogenous phenomenon, or as a natural outcome of the fierce competition in the laissez faire economic system. The markets are considered to be generally efficient. In this view, the role of the government in the process of economic development is important, but limited. The government should only concentrate on providing public goods and on ‘getting the basics right’, both in the microeconomic and in the macroeconomic domains. Except for this limited and well-defined role, the government should stay out of the way and abstain from any further interventions in private markets.
In the microeconomic aspects, the government should ensure property rights, law and order, enforcement of contracts and adequate provision of public goods, such as defence, infrastructure, and perhaps basic education and health care. It should avoid high tax rates, price controls, or any other significant distortion of relative prices. On the macroeconomic side, the government should ensure stable and low inflation, avoid excessive budget deficits, promote the integrity of the financial and banking systems, and ensure open markets, as well as stable and realistic exchange rates.
The advocates of this view see the success of East Asia as the natural outcome of these conservative policies. The World Bank (1993, p. 5) report on the East-Asian miracle, for example, points out that:
Macroeconomic management was unusually good, providing the stable environment essential for private investment. Policies to increase the integrity of the banking system, and to make it more accessible to nontraditional savers, increased the levels of financial savings. Education policies that focused on primary and secondary schooling generated rapid increases in labour force skills. Agricultural policies stressed productivity change and did not tax the rural economy excessively. Governments either actively encouraged family planning or, at the minimum, did not restrict family planning choices. Finally, all the high-performing East Asian economies kept price distortions within reasonable bounds and were open to foreign ideas and technology, policies that, along with other fundamentals, facilitated efficient allocation and helped to set the stage for high productivity growth.
4.2 The ‘Bad’: The Revisionist View
The revisionist view does not share the neoclassical belief in the efficiency of the markets. It asserts that, especially in poorer countries, there are many market imperfections (such as externalities in production, credit constraints, monopolies, unfair trade practices by multinationals and foreign firms, and a general lack of access to many markets). Accordingly, the government should play a central role in helping to acquire technology, allocate funds for key projects, and guide the development of the economy. Not surprisingly, the advocates of this view also see the success of East Asia as confirming their conviction. The revisionist view is summarised by De Long and Summers (1991, p. 448) in their claim that:
it is often alleged that a number of countries have succeeded in growing rapidly by pursuing a government-led “developmental state” approach to development. The rationale for this policy is that countries which adopt the price and quantity structure of more affluent nations are more likely to grow than those that possess the structure of poorer countries. The government should jump-start the industrialisation process by transforming economic structure faster than private entrepreneurs would.
The revisionist view represents a pragmatic approach to policy. It recognises that sometimes the government has to choose interventions that are firm-specific, highly complex and non-uniform. In extreme contradiction to the neoclassical ‘doctrine’, it allows (and sometimes even recommends) the active use of tax policy with the explicit aim of affecting the relative prices in the economy. Pai (1991, p. 47), for example, describes the tax policy in Taiwan during the past 40 years, from his perspective as the Chairman of the Board of the Export-Import Bank and claims that ‘… the remarkable economic development has not been achieved without effort. The hard work of the people and the effective development strategies of the government deserve much of the credit for the achievement. But tax policy also has played an important role in our development and contributed much to the progress we have enjoyed’. After describing the various tax measures that were adopted by the government during the past forty years, he concludes: ‘It is very clear that the tax incentives described above were aimed at promoting investment in productive enterprises, stimulating export sales, and encouraging saving. […] Though it is difficult to quantify the contribution of tax incentives to the outstanding performance of the economy, it is generally acknowledged that sound tax policies and their timely adoption deserve part of the credit’ (Pai 1991, pp. 49, 53).
Even the World Bank (1993, p. 5) report, after emphasising the ‘getting the basics right’ policies in East Asia, concedes that ‘… these fundamental policies do not tell the entire story. In each of these economies the government also intervened to foster development, often systematically and through multiple channels. Policy interventions took many forms: targeted and subsidised credit to selected industries, low deposit rates and ceilings on borrowing rates to increase profits and retained earnings, protection of domestic import substitutes, subsidies to declining industries, the establishment and financial support of government banks, public investment in applied research, firm- and industry-specific export targets, development of export marketing institutions, and wide sharing of information between public and private sectors’.
4.3 The ‘Ugly’: We Cannot Say Anything Meaningful About Selective Interventions
In addition to the neoclassical and the revisionist positions, a third powerful argument about public policy can be made, changing the nature of the neoclassical-revisionist debate. This third position essentially claims that we cannot say anything meaningful about selective interventions, because we cannot properly identify the role that such policies play in the determination of economic growth. There are at least four reasons for this intellectual pessimism.
First, in analysing the ‘successful’ policies, there is a clear selection bias. As argued by the World Bank, ‘[w]ere some selective interventions, in fact, good for growth? In addressing this question we face a central methodological problem. Since we chose the high-performing Asian economies for their unusual rapid growth, we know before we begin analysis that their interventions did not inhibit growth’ (World Bank 1993, p. 6). Easterly (1995, p. 268) makes the same point when he says that ‘… economists find it much more appealing to study what the successes did right than what failures did wrong: from 1969 to the present there have been 717 articles on Singapore in economics journals. On the Central African Republic, a country of similar population size but opposite performance, the number of articles over this period was: 1. It is not really clear why large positive outliers should contain more information than large negative outliers’.
Second (and this point is related to the first), in most cases it is impossible to offer a realistic counterfactual scenario. In other words, in analysing specific policy actions and selective interventions, we cannot address the most (and perhaps the only) relevant question: what growth rate would have been observed if these policies had not been in place?
Third, public policy in the successful East-Asian economies is far from homogenous. There is also a large variation in the specific sectors and industries that were targeted for selective interventions across different countries. Indeed, the more one examines the policies pursued by the different countries, the more evident it becomes how different, and sometimes contradictory, these policies were. Rodrik (1994, p. 37), for example, remarks that ‘[o]ne of the most useful features of the [World Bank (1993)] report is its documentation of the variety of policies and institutions that comprise ‘the East-Asian model’. The model encompasses highly interventionist strategies (Japan and Korea) as well as non-interventionist ones (Hong Kong and Thailand); explicitly redistributive policies (Malaysia) as well as distributionally neutral ones (most of the rest); clientelism (Indonesia and Thailand) as well as strong, autonomous states (Korea, Japan and Singapore); emphasis on large conglomerates (Korea) as well as on small, entrepreneurial firms (Taiwan). This range of strategies, all followed more or less successfully, suggests that the search for a parsimonious explanation of the East-Asian miracle may well be futile’. A similar argument is made by Easterly (1995, p. 267) who argues that the performance of the Four Tigers has been used to support each development school's ‘favourite prescriptions’, ranging from free-market policies to encourage outward orientation to aggressive trade intervention.
Finally, there is a severe problem of determining the correct direction of causality. Many variables related to public policy (such as the fiscal balance of the government or the accumulation of education) are found in many studies to be positively correlated with growth. As a result, economists often consider these policies as promoting economic growth. The problem, however, is that observing a specific variable to be positively correlated with growth does not necessarily constitute a proof that this variable generates growth; it can be the other way around. For example, it is much easier for a government to maintain a healthy fiscal position and not to run budget deficits when the economy grows at a rapid pace and tax revenues are constantly increasing, than when the economy does not grow and there is a big demand for social expenditures and fiscal stimulus.
The same argument can be made about other variables, such as political stability, military expenditures as a per cent of GDP, the rate of increase in the level of education and the rate of industrialisation: when an economy is booming, people are much happier with their leaders and the country enjoys political stability; the economy can afford to decrease the share of GDP devoted to national defence (in the face of a constant external threat); it also can afford to subsidise education, causing a significant increase in the enrolment rate at all school levels.
In the important case of education and growth, two additional arguments regarding an inverse causality between the two variables can be made, addressing the demand side. First, because education is a normal good (or perhaps even a luxury good at the higher education levels), the demand for education increases significantly when the economy grows and the population becomes richer. Second, the process of rapid growth is accompanied by a rapid technological change. When the economy faces such a rapid technological change, the advantage of educated workers (over non-educated workers) is greater than when the economy and technology are stagnant. Therefore, there will be an increase in the demand for education of each individual, in order to compete with other individuals in the economy. In this case, the increased level of education will constitute a microeconomic advantage for the specific individual (relative to other individuals in the economy), but will not necessarily improve the macroeconomic prospects of the economy.
All these examples do not attempt to prove that policies are not important. Rather, they try to make the modest point that we still understand very little about the relationship between public policy and the miraculous growth rates of the East-Asian economies. Other countries should be careful in trying to imitate the East-Asian policies. Not understanding the causality between growth and industrialisation, in particular, proved to be a very costly mistake for many poor countries that pushed for a rapid industrialisation in a futile effort to boost economic growth.
5. Are Investment and Exports the Engines of Growth?
Among the many suggested determinants of growth in East Asia, the investment rate and export orientation, in particular, are held in very high esteem. Frequently, they are called the ‘engines of growth’, meaning that these activities are considered not only to contribute directly to growth, but also to generate spill-over effects to the rest of the economy. The policy implication of these views is obvious: if some sectors in the economy contribute to economic growth, while others do not, then the government should increase the growth rate by promoting these ‘good’ sectors. Therefore, it should promote investment and exports, using policy instruments such as direct subsidies or preferential allocation of credit. Because of the central role played by investment and exports in the attempts to explain the East-Asian growth, and because of the direct policy implications of this central role, this issue deserves special consideration.
5.1 The Main Arguments
The view of investment and/or exports as the engines of growth is based mainly on one empirical argument and on one theoretical argument. The empirical argument is simple: most East-Asian countries that experience phenomenal growth rates also experience impressive exports (and imports) and investment rates. The theoretical argument in the case of investment is that a high investment rate increases the capital stock, and some endogenous growth theories predict that this can permanently increase the growth rate (usually through increasing returns to scale or through externalities). In the case of exports, the theoretical argument is that export orientation increases the openness of the economy and exposes it to foreign technology (and, perhaps more importantly, to foreign competition), thus provoking a rapid rate of technological progress.
5.2 What is the Direction of Causality?
A previous section in this study argued that a positive correlation between two variables does not prove a direction of causality. Thus, in the case of export orientation and technological progress, the causality can run from the later to the former. Suppose that some industries significantly improve their technology (for example, by copying foreign technology) while other industries do not. Then, it is only natural that those industries with the more advanced technology can compete in the international markets and can increase their quantity of exports. In this case, the data will reveal a strong correlation between the export performance and the rate of technological progress across industries. A similar argument can be made in the case of a positive exports-technology correlation across countries: developing countries that are better in learning and applying advanced foreign technologies will enjoy an important advantage in the world markets and will be able to achieve a strong export performance.
The case of strong positive correlation between investment rates (or, equivalently, saving rates) and growth rates seems to be more promising. Nevertheless, a strong argument of reversed causality can be made even in this case. Such an argument was made, for example, by Carroll and Weil (1994). They examined the relationship between growth and saving using both cross-country and household data, and attempted to determine the direction of causality (in the Granger sense). They found that, at the aggregate level, growth causes saving but saving does not cause growth. Using household data, they found that households with predictably higher income growth save more than households with predictably lower growth. These findings represent a powerful reinterpretation of the growth-saving relationship. Carroll and Weil also offer a theoretical model that explains these findings. In their model, people have a high degree of habit formation. In the face of higher growth rates, they will only slowly and gradually adjust their consumption levels. In this case, increased saving rates are caused by increased growth rates, and not vice versa.
5.3 Period Averages Versus Initial Conditions
The main empirical argument for the importance of export orientation and a high investment rate as determinants of growth is the strong positive correlation between these two variables and the rates of growth found in cross-country studies. In particular, the best performing East-Asian economies, such as the Four Tigers, display exceptional investment rates and an extremely high degree of openness (defined as the amount of exports and imports relative to the size of the economy). The problem is that in most studies, the observed correlation is between the period averages of these variables and the period averages of the growth rates. The previous section, however, stressed the problem of possible reverse causality between growth and those other variables. This problem greatly reduces the potential of such comparisons of cross-country period averages to identify specific variables as the main determinants of growth.
The problem of reverse causality is a difficult one in growth regressions. There are no simple or perfect solutions to this problem. But one simple partial solution is to observe the values of the explanatory variables at the beginning of the period, rather than to take their average values during the period. Finding, for example, that economies with high growth rates during the period 1960–90 also had high investment rates or a significant export orientation around 1960, would go a long way towards solving the potential problem of reverse causality.
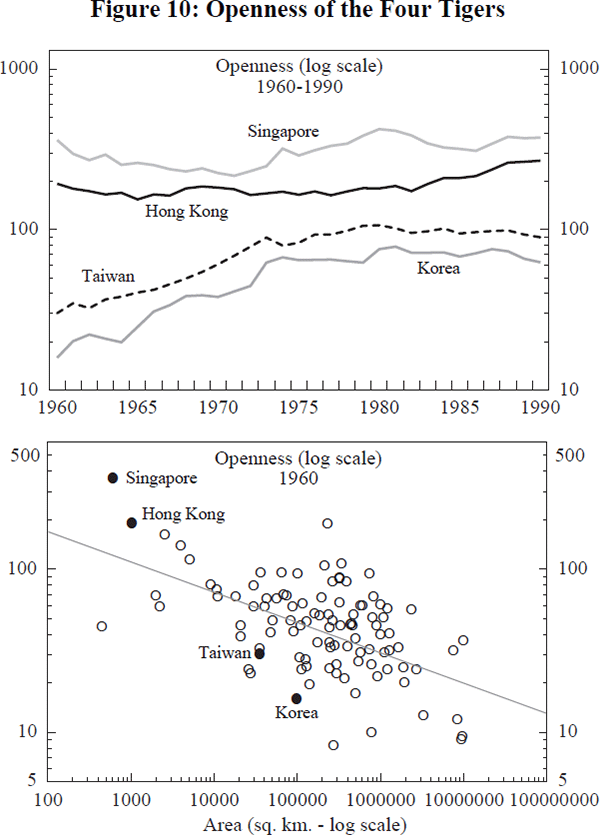
This section looks at the dynamics of the investment rate and of the openness of the economies of Hong Kong, Korea, Taiwan and Singapore, and compares the 1960 levels of these variables in the Four Tigers with those in other countries. The results of these comparisons are based on the PWT database and are presented in Figures 9 and 10. Unfortunately, the evidence presented in these figures does not offer much support for the views of exports orientation or high investment rate as engines of growth.
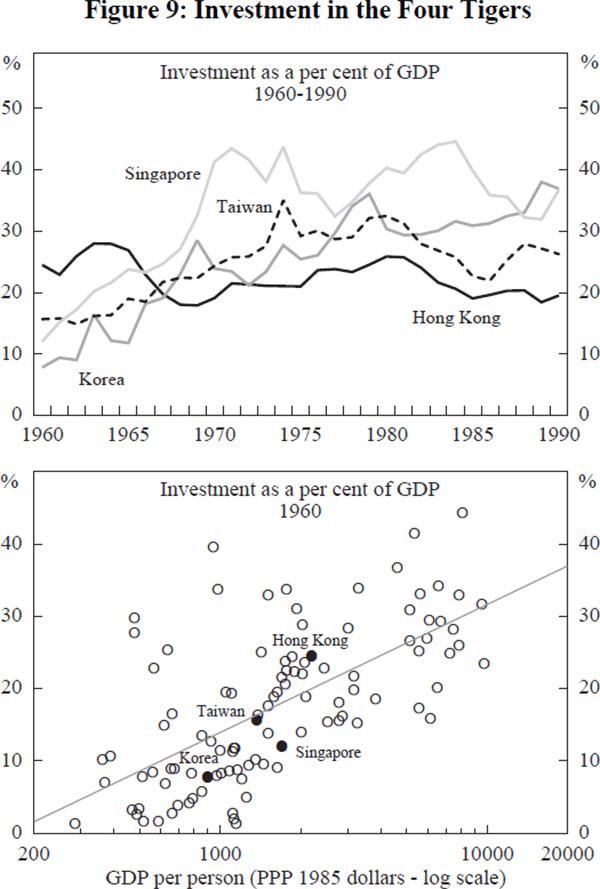
The first panel of Figure 9 shows the investment rate of the Four Tigers during the period 1960–90. The figure makes clear that the investment rates of Korea, Taiwan and Singapore increased dramatically during this 30-year period. Only Hong Kong had a roughly stable investment rate during this period. The second panel of Figure 9 compares the 1960 investment rates of the four countries to the 1960 investment rates of 100 other economies. The horizontal axis represents the level of output per person in 1960, and the solid line is the result of an OLS regression. This panel clearly rejects the view that investment rates were high in the Four Tigers in 1960. Not only were the investment rates in these economies not high in absolute values, but they were very modest even when compared to other countries with a comparable level of income. This finding is especially obvious in the case of Korea and Singapore.
Figure 10 repeats the same exercise for openness, defined as the log of the sum of exports and imports (as a percentage of GDP). The horizontal axis in the second panel of this figure represents the geographical area of the country, a variable that clearly affects the degree of openness of an economy. In the case of Hong Kong and Singapore, the first panel of Figure 10 shows a high degree of openness, both during the 1960–90 period and at the beginning of this period. The second panel of the same figure, however, demonstrates that the small size of these economies can explain a significant part of this high degree of openness. In the case of Taiwan and Korea, the figure shows that they were not particularly open in 1960, neither in absolute terms nor relative to other countries of a comparable size.
Figures 9 and 10 demonstrate that high investment rates and a large degree of openness were certainly not a general feature of the Four Tigers in 1960. The case of Korea, the best growth performer in the period 1960–1990, is particularly striking. This country is found to have a low-investment inward-oriented economy in 1960. The high investment rates (in the case of Korea, Taiwan and Singapore) and the high degree of openness (in the case of Korea and Taiwan) were economic features that evolved in these economies only gradually, accompanying rather than preceding the process of economic growth. The view that these activities are ‘engines’ of growth does not find much support in the data.
6. Some Positive Evidence Regarding Initial Conditions
This section continues the examination of initial conditions, as a partial remedy to the problem of causality. It attempts to determine which variables (if any) characterised the initial conditions in the East-Asian countries, and their contribution to the subsequent growth of these economies. In contrast to the negative results presented in the previous section, we find some impressive positive empirical evidence regarding the presence and the role of initial conditions. The main arguments and all the tables presented in this section are taken from the study conducted by Rodrik (1994), who argues that the ‘first place to look’ for an explanation of the East-Asian miracle is the set of initial conditions that preceded the economic take-off. First, he discusses the general importance of initial conditions in the process of economic growth. Then, he examines the initial conditions in the East-Asian countries around 1960 and finds that, in some important respects, they were very different from what one would expect, given the income level of these countries. Finally, he demonstrates that the initial conditions in the East-Asian economies can explain a large fraction of their growth performance.
6.1 Cross-Country Evidence on the Importance of Initial Conditions
Table 2 reports the results of regressing average growth of income per person in the period 1960–85 on some initial conditions in 1960. This is a cross country regression, in the spirit of Barro (1991) and other empirical studies of economic growth.
| Estimated coefficient | t-statistics | |
|---|---|---|
| Constant | 6.22 | 4.69 |
| Per capita GDP (1960) | −0.38 | −3.25 |
| Primary enrolment | 2.66 | 2.66 |
| Gini coeff. (land) | −5.22 | −4.38 |
| Gini coeff. (income) | −3.47 | −1.82 |
| Notes: (a) The number of observations is 41 (the number of countries for
which data on all the initial conditions were available). (b) Adjusted R2 is 0.53. |
||
As can be seen, a small set of initial conditions can ‘explain’ a large fraction of the growth rates in the following period. The table demonstrates that, ceteris paribus, countries that were poorer, had good primary education, and had less inequality of income and of land distribution around 1960, enjoyed significantly higher rates of growth in the period 1960–85.
6.2 Did East-Asian Economies Have Unusual Initial Conditions?
Table 3 compares the actual data on education and demographics in eight East-Asian countries with the predicted values that we would expect, given their initial income. The predicted values (the numbers in parentheses) were obtained from a cross-country regression run on a 118-country sample, with per capita GDP in 1960 and its square used as independent variables.
| Primary enrolment 1960 % |
Secondary enrolment 1960 % |
Literacy rate 1960 % |
Fertility rate 1965 | Mortality rate 1965 | ||||||
|---|---|---|---|---|---|---|---|---|---|---|
| Hong Kong | 87 | (83) | 24 | (23) | 70 | (59) | 4.5 | (5.2) | 3 | (8) |
| Indonesia | 67 | (51) | 6 | (7) | 39 | (25) | 5.5 | (6.5) | 14 | (14) |
| Japan | 103 | (92) | 74 | (29) | 98 | (70) | 2.0 | (4.8) | 2 | (7) |
| Korea | 94 | (57) | 27 | (10) | 71 | (31) | 4.8 | (6.3) | 6 | (13) |
| Malaysia | 96 | (68) | 19 | (15) | 53 | (43) | 6.3 | (5.8) | 6 | (11) |
| Singapore | 111 | (78) | 32 | (21) | 50 | (54) | 4.7 | (5.4) | 3 | (9) |
| Taiwan | 96 | (62) | 28 | (12) | 54 | (36) | 4.8 | (6.1) | 2 | (12) |
| Thailand | 83 | (57) | 12 | (10) | 68 | (31) | 6.3 | (6.3) | 9 | (13) |
Table 4 compares the inequality of income and land (around 1960) of the same eight East-Asian economies with other developing countries at a comparable income level.
| Gini coeff. (income) | Gini coeff. (land) | Gini coeff. (income) | Gini coeff. (land) | ||
|---|---|---|---|---|---|
| Hong Kong | 0.49 | n.a. | Argentina | 0.44 | 0.87 |
| Indonesia | 0.33 | n.a. | Brazil | 0.53 | 0.85 |
| Japan | 0.40 | 0.47 | Egypt | 0.42 | 0.67 |
| Korea | 0.34 | 0.39 | India | 0.42 | 0.52 |
| Malaysia | 0.42 | 0.47 | Kenya | 0.64 | 0.69 |
| Singapore | 0.40 | n.a. | Mexico | 0.53 | 0.69 |
| Taiwan | 0.31 | 0.46 | Philippines | 0.45 | 0.53 |
| Thailand | 0.41 | 0.46 | Turkey | 0.56 | 0.59 |
| Unweighted average | 0.39 | 0.45 | Unweighted average | 0.50 | 0.68 |
Tables 3 and 4 present strong evidence that the eight East-Asian countries had initial conditions, in terms of education, demographics and inequality, that were significantly different (and better) than those in other countries with a similar level of income.
6.3 Can the Initial Conditions Explain the East Asian Miracle?
Table 2 points to a set of initial conditions that are beneficial for growth, while Tables 3 and 4 show that these initial conditions (equality of land and income, school enrolment, high life expectancy and low fertility rates) prevailed in the East-Asian countries around 1960. These findings raise the possibility (but do not prove) that these initial conditions may explain the phenomenal growth rates we observed in East Asia after 1960. Not surprisingly, the next question Rodrik asks is how much of the actual growth of the high-performing Asian economies can be explained by the initial levels of school enrolment and equality? His answer is ‘quite a lot of it’. Table 5 compares the actual growth rates of five East-Asian countries (for which data on the Gini coefficient for land were available) to the growth rates that are predicted by the regression described in Table 2.[3]
| Actual growth | Predicted growth | % explained | |
|---|---|---|---|
| Japan | 5.76 | 4.26 | 74 |
| Korea | 5.95 | 5.24 | 88 |
| Malaysia | 4.52 | 4.44 | 98 |
| Taiwan | 5.68 | 4.96 | 87 |
| Thailand | 4.06 | 4.34 | 107 |
| Unweighted average | 5.19 | 4.65 | 90 |
The empirical evidence presented by Rodrik, regarding the importance of initial conditions in economic growth and their power to explain the East-Asian miracle, is quite impressive. Nevertheless, this evidence should be accepted only if accompanied by a large dose of caution. The main reason for this caution is the small number of observations that support these conclusions. Data on initial conditions in 1960, especially for developing countries, are extremely rare and their quality is questionable. While Rodrik's results suggest a possible explanation for the East-Asian miracle, they are not robust enough to rule out other possibilities.
Furthermore, it is not clear what are the normative implications of these findings. For example, suppose that land equality is indeed very beneficial for economic growth. Does that mean that land redistribution is a good policy to promote growth? The answer, obviously, is: not necessarily. The redistribution itself may be extremely damaging, by having a negative impact on property rights, political stability, or other factors that may be important for growth. The same argument is true in the case of low fertility rates: lowering fertility ‘by decree’ may be bad for growth, even if low fertility rates are found to be good for growth.
7. Concluding Remarks
The recent literature on the East-Asian growth experience has produced a very intense intellectual debate. This study attempted to critically review the main arguments in this debate, covering some of its most important dimensions. Whilst challenging existing paradigms, the study does not offer clear and conclusive results which form an alternative explanation of growth. Nor does it make clear policy recommendations. Its main judgment is that, from a positive point of view, a promising avenue for the explanation of growth performance is the examination of initial conditions. But, from a normative point of view, it is far from clear what specific policies governments should pursue, beyond the standard set of policies aimed at ‘getting the basics right’.
Footnotes
The author would like to thank Palle Andersen, Michael Kremer and Bart Turtelboom for helpful comments. The views expressed in this study are those of the author and do not necessarily represent those of the International Monetary Fund. The term ‘country’, as used in this study, may not refer to a territorial entity that is a state as understood by international law and practice; the term may also cover some territorial entities that are not states but for which statistical data are maintained and provided internationally on a separate and independent basis. In order to be concise, this study refers to Taiwan Province of China as ‘Taiwan’ and to Republic of Korea as ‘Korea’. [*]
For example, it is beyond the scope of this study to consider the importance of geographic locations on the process of growth, or to address the promising theories about the non-monotonic dynamics of economic growth (suggested by Sarel (1994) and Ito (1995)), in which middle-income countries can ‘take-off’ and grow faster than either rich or poor countries. [1]
For the reasons described above, we do not attempt the estimation for the period 1960–75. [2]
In fact, despite the obvious geographical concentration of growth success, there is little evidence to suggest that geographical factors play an important role, once one controls for other factors, such as initial conditions (or government policies). [3]
References
Barro, R.J. (1991), ‘Economic Growth in a Cross Section of Countries’, Quarterly Journal of Economics, 106(2), pp. 407–443.
Bercuson, K. (ed.) (1995), ‘Singapore: A Case Study in Rapid Development’, IMF Occasional Paper No. 119.
Carroll, C.D. and D.N. Weil (1994), ‘Saving and Growth: A Reinterpretation’, Carnegie-Rochester Conference Series on Public Policy, 40(June), pp. 133–192.
De Long, J.B. and L.H. Summers (1991), ‘Equipment Investment and Economic Growth’, Quarterly Journal of Economics, 106(2), pp. 445–502.
Easterly, W. and S. Fischer (1994), ‘What We Can Learn from the Soviet Collapse’, Finance and Development, 31(4), pp. 2–5.
Easterly, W. (1995), ‘Explaining Miracles: Growth Regressions Meet the Gang of Four’, in T. Ito and A.O. Krueger (eds), Growth Theories in Light of the East Asian Experience, The University of Chicago Press, Chicago, pp. 298–299.
Ito, T. (1995), ‘Comment’, in T. Ito and A.O. Krueger (eds), Growth Theories in Light of the East Asian Experience, The University of Chicago and London, Chicago Press, pp. 291–298.
Kim, J. and L.J. Lau (1994), ‘The Sources of Economic Growth of the East Asian Newly Industrialised Countries’, Journal of the Japanese and International Economies, 8(3), pp. 235–271.
Krugman, P.R. (1994), ‘The Myth of Asia's Miracle’, Foreign Affairs, 73(6), pp. 62–78.
Lucas, R.E. (1988), ‘On the Mechanics of Economic Development’, Journal of Monetary Economics, 22(1), pp. 3–42.
Lucas, R.E. (1993), ‘Making a Miracle’, Econometrica, 61(2), pp. 251–272.
Pai, P.P. (1991), ‘Tax Policy and Economic Development in the Republic of China’, Industry of Free China, 76(6), pp. 47–56.
Rodrik, D. (1994), ‘King Kong Meets Godzilla: The World Bank and The East Asian Miracle’, in A. Fishlow et al. (eds), Miracle or Design? Lessons from the East Asian Experience, Overseas Development Council, Washington, DC.
Sarel, M. (1994), ‘On the Dynamics of Economic Growth’, IMF Working Paper WP/94/138.
Solow, R.M. (1956), ‘A Contribution to the Theory of Economic Growth’, Quarterly Journal of Economics, 70(1), pp. 65–94.
Summers, R. and A. Heston (1991), ‘The Penn World Table (Mark 5): An Expanded Set of International Comparisons, 1950–1988’, Quarterly Journal of Economics, 106(2), pp. 327–368.
Vogel, E.F. (1991), The Four Little Dragons: The Spread of Industrialisation in East Asia, Harvard University Press, Cambridge and London.
Washington Post (1995), ‘Who Gets Rich’, The Washington Post, p. A26, April 7.
World Bank (1993), The East Asian Miracle: Economic Growth and Public Policy, Oxford University Press, New York.
Young, A. (1992), ‘Tale of Two Cities: Factor Accumulation and Technical Change in Hong Kong and Singapore’, NBER Macroeconomics Annual 1992, The MIT Press, pp. 13–54.
Young, A. (1994a), ‘Lessons from the East Asian NICS: A Contrarian View’, European Economic Review 38(3/4), pp. 964–73.
Young, A. (1994b), ‘The Tyranny of Numbers: Confronting the Statistical Realities of the East Asian Growth Experience’, NBER Working Paper No. 4680.