RBA Annual Conference – 1995 Labour-Productivity Growth and Relative Wages: 1978–1994 Philip Lowe[*]
1. Introduction
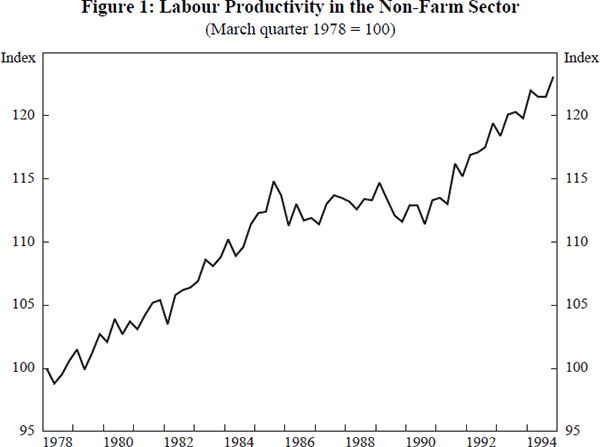
During much of the 1980s, labour-productivity growth in Australia was unusually slow (see Figure 1). Between March 1983 and June 1991 (which are equivalent points in the business cycle), output per hour worked in the non-farm economy increased at an annual rate of just 0.68 per cent per year. This compares with average annual labour-productivity growth of 1.34 per cent over the previous five years, and 2.51 per cent growth over the subsequent three years. This period of slow labour-productivity growth occurred at the same time that employment was growing rapidly. The most frequently offered explanation for this combination of favourable labour-market outcomes but low productivity growth is that the Prices and Incomes Accord held down real wages and led to a substitution of labour for capital.[1] The growth of the service sector and measurement problems are also sometimes cited as explanations for the 1980's productivity slowdown.
This paper uses industry-level productivity and wages data in an attempt to improve our understanding of labour-productivity outcomes over the period since 1978. It does not contradict the explanation based on changes in the relative price of labour, but argues that the story is richer than that suggested by the simple factor-substitution explanation. The paper pays particular attention to the slowdown in labour-productivity growth over the second half of the 1980s. Over that period, four industries – construction, wholesale and retail trade, finance, property and business services and recreation, personal and other services – experienced declines in the level of labour productivity. The paper examines possible reasons for these declines and examines the contribution of these industries to the aggregate productivity slowdown.
The industry data raise a number of interesting issues. Foremost amongst these is the issue of how to measure output in the service industries. This problem is graphically illustrated by the wholesale and retail trade industry. Despite the adoption of new technologies and rationalisation within the industry, the measured level of labour productivity fell over the second half of the 1980s. To a significant extent this fall was the result of the deregulation of shopping hours, which led to an increase in opening hours and employment. While deregulation is unlikely to have led to more goods being processed through the checkout (the standard measure of output), it certainly made shopping more convenient. While statisticians attempt to make adjustments for improvements in the quality of goods, no adjustments are made for improvements in the quality of services. The result of this is that deregulation of shopping hours led to a reduction in measured output per hour worked, but to an increase in many people's living standards. As the service sector continues to expand, contradictions of this sort will become more frequent.
While measurement problems in other service industries adversely affect the measured level of real output, they can only explain the productivity slowdown if the service sector's share of total employment increased substantially or, somehow, the measurement problems became worse in the 1980s. There is some evidence that measurement problems did in fact become more severe in the finance, property and business services sector and, in particular, in the wholesale and retail trade industry. Measurement problems appear to have played a much smaller role in explaining the slowdown in productivity growth in the recreation, personal and other services sector. In this sector, compositional shifts appear to have been important. In addition, declines in real product wages allowed rapid employment growth, despite the fact that the average level of labour productivity of the new workers was less than the average level of the existing workers.
Outside the service sector, the construction industry, and to a lesser extent the manufacturing industry, also made significant contributions to the 1980s slowdown. Working in the other direction, faster rates of productivity growth in electricity, gas and water, communications and transport and storage acted to push up productivity growth. These favourable effects were, however, more than offset by developments in other sectors.
The industry data also provide some insight into the relationships between relative productivity performance and wage outcomes. Under enterprise bargaining arrangements, wage increases for individual enterprises and industries are increasingly justified in terms of the individual firm's or industry's productivity performance. Such a relationship between productivity growth and wages has an obvious appeal. Ultimately, however, differential rates of productivity growth between industries do not appear to lead to substantially different rates of increases in wages across industries. Instead, differences in productivity growth affect relative prices; slow productivity growth in hairdressing does not lead to stagnant real wages for hairdressers, but instead to an increase in the relative price of a haircut. The examination of the wage data also suggests that real output growth in the finance, property and business services sector has been significantly underestimated.
The remainder of the paper is structured as follows. Section 2 examines trends in labour-productivity growth over the period from March 1978 to June 1994 and the contribution of various industries to changes in labour-productivity growth.[2] Section 3 then analyses productivity trends in the wholesale and retail trade, recreation, personal and other services and construction sectors. Section 4 follows with an examination of the interactions among wages, productivity and prices using industry-level data. Finally, Section 5 provides a summary and concluding remarks.
2. Trends in Labour-Productivity Growth
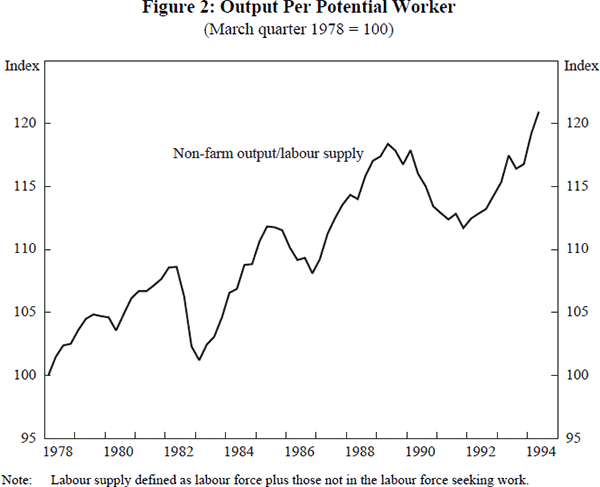
In analysing trends in labour-productivity growth, the traditional measure of labour input is hours worked. While this is the appropriate measure for assessing the average output produced per hour worked, it ignores the fact that unemployed workers are producing no measured output. If these unemployed workers find jobs, this is likely to slow productivity growth as, on average, the new workers will be producing less output than the existing workers. In contrast, output per potential worker may be growing quite strongly. This appears to have been the case in the second half of the 1980s. Figure 2 shows an index of output per potential worker (where the potential workforce is equal to the labour supply). This labour-productivity series is more volatile than the one presented in Figure 1 as it does not adjust for the decline in labour input in recessions. More importantly, this series also shows a much better productivity performance between 1982 and 1989. While declining unemployment contributed to the slowdown in growth in the standard measure of labour productivity, the slowdown does not necessarily imply a decline in the rate at which average living standards were improving.
While swings in the business cycle have a pronounced effect on output per potential worker, they also affect the standard measure of output per hour worked. In recessions, labour productivity tends to decline as firms are reluctant to lose workers who have firm-specific knowledge. In the recovery, this ‘labour hoarding’ means that labour productivity can increase quite quickly. The existence of increasing returns to scale may accentuate this cyclical influence. While taking account of these cyclical influences is important, there is no standard method by which this is done. The approach adopted here is to use the recession troughs as the break dates for splitting the sample into three sub-periods. At best, this is only a partial solution as neither the starting nor end points of the entire sample are recession troughs. Even if they were, differences in the nature of recessions may lead to differences in productivity performance over different business cycles.
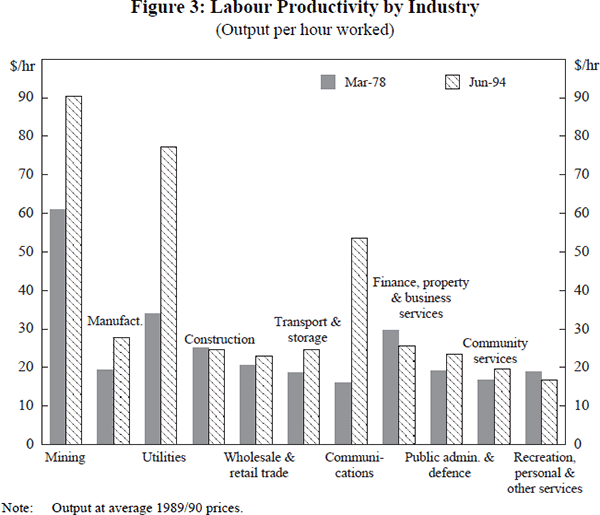
Table 1 presents labour-productivity growth rates for each industry over the various sub-periods and Figure 3 shows the level of labour productivity in the March quarter of 1978 and the June quarter of 1994. The ASIC industry classifications are used.[3]
| 1978:1–1983:1 | 1983:1–1991:2 | 1991:2–1994:2 | 1978:1–1994:2 | |
|---|---|---|---|---|
| Mining | −3.01 | 6.44 | 1.42 | 2.52 |
| Manufacturing | 2.41 | 1.89 | 2.53 | 2.16 |
| Utilities | 1.00 | 7.68 | 5.19 | 5.13 |
| Construction | 2.70 | −1.45 | −0.98 | −0.10 |
| Wholesale and retail trade | 1.01 | −0.10 | 2.31 | 0.68 |
| Transport and storage | −0.55 | 1.81 | 5.63 | 1.77 |
| Communications | 6.07 | 6.96 | 12.89 | 7.76 |
| Finance, property and business services | 0.02 | −1.37 | −0.97 | −0.87 |
| Public administration and defence | 0.70 | 1.31 | 2.17 | 1.28 |
| Community services | 0.64 | 0.45 | 2.89 | 0.96 |
| Recreation, personal and other services | −0.50 | −1.83 | 1.49 | −0.81 |
| Non-farm sector | 1.34 | 0.68 | 2.51 | 1.21 |
Data on hours worked by industry are obtained from the Labour Force Survey.[4] This is a survey of individuals and provides industry-level hours worked data from 1978 onwards. Data from a similar survey of firms (the Survey of Employment and Earnings) were first published in September 1983. At least for data on total employment, the Labour Force Survey is preferred by the ABS.[5] While the general trends in the two surveys are similar, the Survey of Employment and Earnings has shown weaker employment growth over recent years. At the industry level, differences between the two surveys can help explain some of the anomalies in the industry labour-productivity data (see below).
There are clearly large differences across industries in both growth rates and levels of labour productivity. In the communications sector, labour productivity increased at nearly 8 per cent per year between 1978 and 1994, while labour productivity fell at almost 1 per cent per year in the finance, property and business services and the recreation, personal and other services sectors. In terms of levels, in the June quarter of 1994, labour productivity in the mining industry (the sector with the highest level of labour productivity) was almost 5.5 times that in the recreation, personal and other services industry (the sector with the lowest level of labour productivity).
In a number of industries there is an important issue concerning the measurement of output and thus productivity. The most frequently cited measurement problems are in the non-market sectors – public administration and defence, finance, property and business services and community services – where it is difficult to obtain the direct market value of output. In public administration and defence, annual estimates are derived by extrapolating base year output by the sum of deflated estimates of wages, salaries and supplements and constant price estimates of consumption of fixed capital.[6] With public service average wages rising more quickly than public service pay rates (due to an increase in the average classification level of public servants) measured labour-productivity growth has been positive. To the extent that a higher average classification represents a higher average skill level, it is consistent with rising labour productivity. More problematic is the notion that an increase in the pay rate of a particular classification represents an increase in the ‘price’ of the output, rather than an increase in output produced per hour worked. Similar issues arise in the community services industry.
In the finance, property and business services sector, output in the base year is extrapolated using data on hours worked.[7] This is based on the assumption that there is zero labour-productivity growth. Despite this, on the measure presented above, labour productivity does change in these industries. While compositional effects play some role in explaining this change, differences in the Labour Force Survey (LFS) and the Survey of Employment and Earnings (SEE) are also important.
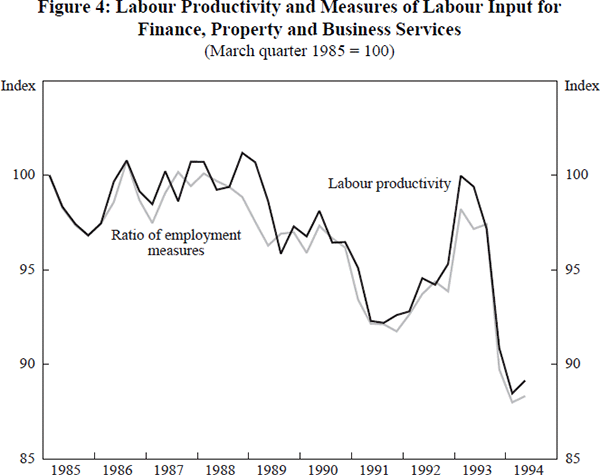
Since September 1983, the ABS have used the SEE to extrapolate output in this sector. Figure 4 shows the ratio of finance, property and business services sector employment, as measured by the SEE, to employment as measured by the LFS.[8] It shows that changes in labour productivity, as measured in this paper, are almost entirely explained by changes in this ratio. Thus if the SEE measure of labour input is used in the productivity calculations, there is no decline in productivity. While in the medium term, the two measures of labour input might be expected to behave similarly, substantial deviations appear to persist for some time. In analysing the differences in the two measures, the ABS states that in the upswing of the employment cycle the (aggregate) SEE series will lag the LFS series due to delays in updating the business register. The increasing use of contract labour in the finance, property and business services sector may also be contributing to the differences.
Other measurement problems, particularly in service industries, arise due to the difficulty in measuring the quality of output. While the statistician makes adjustments to price indices for the improvement in the quality of goods, such adjustments are typically not made for improvements in the quality of services. Whether or not such adjustments should be made is a matter for debate. For example, if shops are open longer hours, providing an increased level of convenience, should some adjustment be made to the price deflator for the retail industry? Should adjustments be made for improvements in quality of service in hotels and restaurants? There are no clear, easily implementable answers to these questions. However, these issues do suggest a deal of caution in concluding that a slowdown in measured labour-productivity growth necessarily implies a slowdown in the march forward of living standards.
Notwithstanding these measurement problems, we now turn to examining the role that particular industries play in driving the aggregate productivity numbers. The aggregate level of labour productivity can be expressed as a weighted average of productivity in each industry, where the weight for a particular industry is that industry's share of total employment. That is:

where Y is aggregate output, L is aggregate labour input and Yi and Li are output and labour input in industry i.
Given equation (1), the change in aggregate labour productivity can be expressed as:

The first component measures the contribution to the change in aggregate labour productivity made by productivity improvements within each industry. The second component measures the contribution made by workers shifting between industries. One weakness of this accounting approach is that the two components may not be independent. A sector that has a higher than average level of labour productivity may further increase labour productivity by firing any workers with low marginal product. This would be recorded as an increase in within-sector productivity, as well as a decrease caused by the movement of labour out of an industry with a high average level of productivity. The problem arises because the marginal product of the average and marginal workers may be quite different. This hints at a second and related problem – while average labour-productivity levels differ considerably across sectors, the differences in labour productivity of the marginal worker are likely to be much smaller. Thus, the relatively small compositional effects identified below are likely to be upper estimates of the true size of compositional effects at least at this level of aggregation.
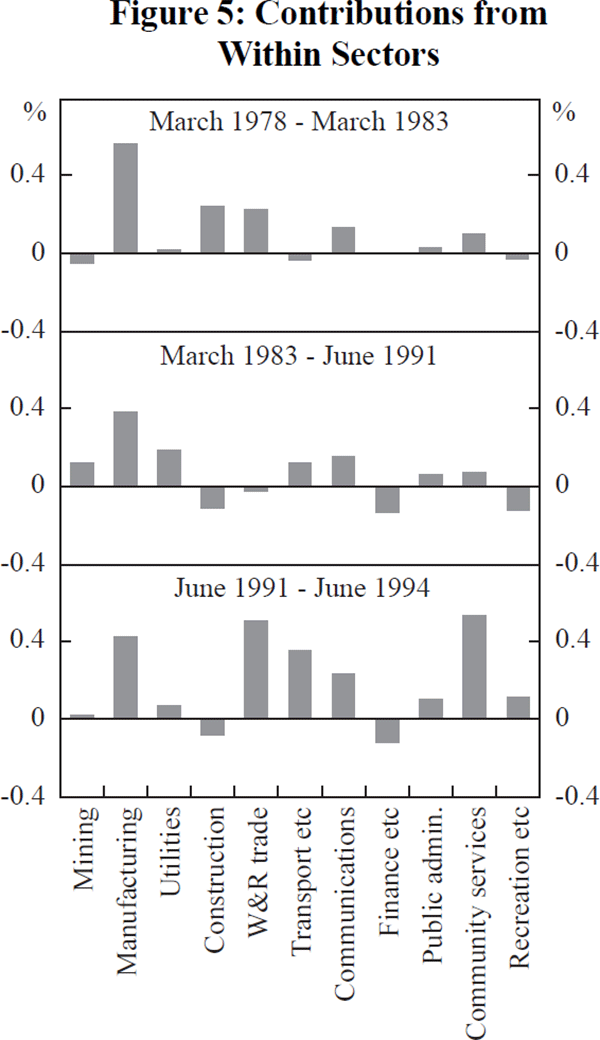
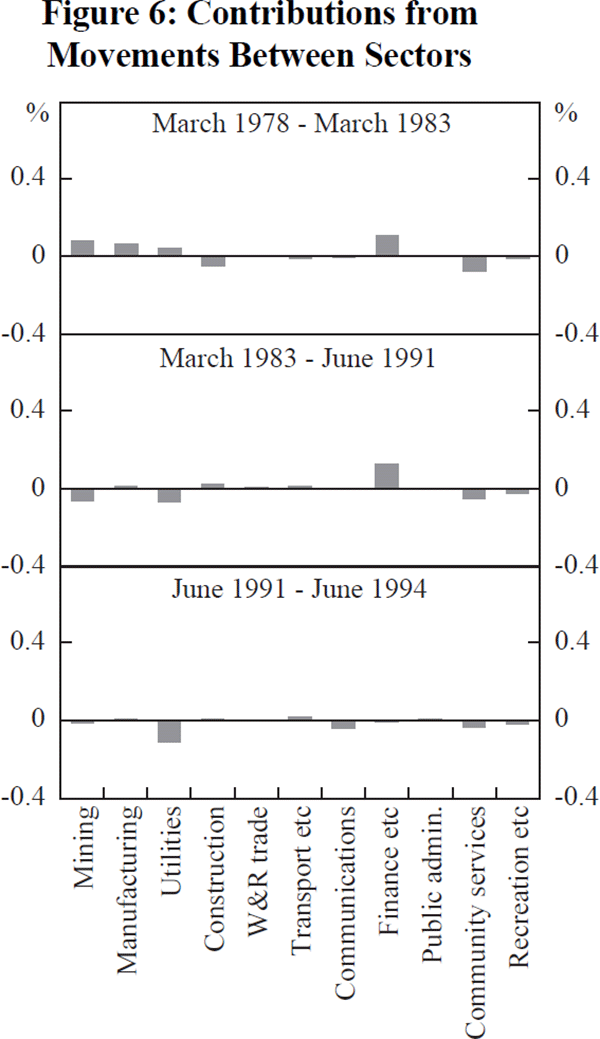
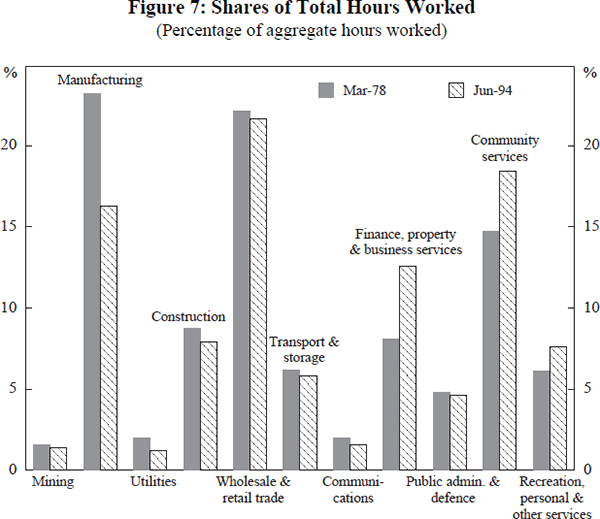
We now turn to the decomposition suggested by equation (2), and examine the contributions to aggregate labour-productivity growth made by various industries in each of the three periods defined in Table 1. For each period, Figure 5 shows the annual change in labour productivity in each sector, multiplied by the sector's share in total employment – the first component of equation (2). Figure 6 shows the second component of equation (2) – the contribution to productivity growth from the movement of labour between sectors. Figure 7 shows the share of total hours worked in each of the industries in March 1978 and June 1994. The biggest changes have been an increase in the employment shares of finance, property and business services and community services and a decline in manufacturing's share.
2.1 The Slowdown in Labour-Productivity Growth From 1983
After growing at an annual rate of 1.34 per cent between March 1978 and March 1983, labour productivity in the non-farm sector grew at just 0.68 per cent per annum between March 1983 and June 1991. Figure 5 and Table 1 show that this slowdown did not occur in all industries, with a number of industries increasing their contribution to aggregate labour-productivity growth. Most notable amongst these was the mining sector, with labour-productivity growth increasing from −3 per cent per annum, to around 6½ per cent per annum; this added 0.16 of a percentage point to annual aggregate productivity growth.
Of the industries contributing to the slowdown, the construction industry made the largest contribution. Had productivity growth in this industry been maintained at the rate that was achieved between March 1978 and March 1983, annual aggregate labour-productivity growth would have been 0.35 of a percentage point faster in the 1983–91 period. The slowdown in labour-productivity growth in manufacturing contributed a further 0.18 of a percentage point to the aggregate slowdown. In total, the slowdown in measured productivity growth in the five service sectors contributed 0.45 of a percentage point.
Within the service sector, wholesale and retail trade made the largest contribution. The slowdown in this sector, from an already slow growth rate, took around one-quarter of a percentage point off aggregate labour-productivity growth, relative to the 1978–83 period. After experiencing average labour-productivity growth of around 1 per cent per annum between March 1978 and March 1983, the wholesale and retail trade sector actually recorded negative productivity growth over the following eight years. By March 1991, the level of labour productivity in the sector had fallen nearly 11 per cent from its peak reached in March 1984.
The finance, property and business services sector contributed around 0.13 of a percentage point to the aggregate slowdown. As discussed above, the negative productivity growth in this sector reflects differences in the Labour Force Survey and the Survey of Employment and Earnings. Between 1983 and 1991, the level of labour productivity also fell in the recreation, personal and other services sector. In fact, this sector experienced the largest fall of any industry; the level of labour productivity falling over 14 per cent between March 1983 and June 1991. The deterioration in the productivity performance in this sector contributed almost 0.1 of a percentage point per annum to the overall slowdown.
As noted above, the slowdown in productivity growth in the mid 1980s did not occur in all industries – in addition to the mining sector, the utilities, transport and storage and communications industries all made larger contributions to aggregate labour-productivity growth in the 1983–91 period than they had done in the 1978–83 period. Labour-productivity growth in utilities was 7.7 per cent per year between March 1983 and June 1991 (1.0 per cent in the earlier period), while labour-productivity growth in communications was 7.0 per cent (6.1 per cent), and in transport and storage it was 1.8 per cent (−0.6 per cent).
In part, the faster productivity growth in these industries reflected the microeconomic reforms that were taking place.[9] To some degree, the low productivity growth in the manufacturing, construction and wholesale and retail trade industries has hidden the macroeconomic benefits of these microeconomic reforms. Not only has the improved performance of sectors that provide important inputs made an indirect impact on the competitiveness of Australian business, but it has also made a significant direct contribution to aggregate labour-productivity growth. Had the productivity growth of these sectors (utilities, communications and transport and storage) been unchanged from the rate that was achieved between March 1978 and March 1983, aggregate labour-productivity growth between 1983 and 1991 would have been at least 0.3 of a percentage point slower than the already low level that was actually experienced.
Finally, an examination of Figure 6 suggests that at the level of aggregation used in this section of the paper, the movement of labour between sectors played only a very small role in explaining the productivity growth slowdown. In the period between March 1978 and March 1983, the movement of labour between sectors added just over 0.1 of a percentage point to annual labour-productivity growth. This compares with a zero contribution over the period from March 1983 to June 1991. In both periods, the growth of employment in the relatively low-productivity community services industry acted to retard aggregate labour-productivity growth. This was offset by the employment growth in the relatively high-productivity finance, property and business service sector. The impact of these effects was, however, quite small. The major difference between the two periods is the decline in the latter period in the employment shares of the mining and utilities industries which have relatively high labour productivity.
2.2 The Pick-up in Labour-Productivity Growth Since 1991
Since mid 1991, the growth rate of labour productivity has increased considerably – averaging 2.5 per cent per annum between June 1991 and June 1994. This improvement has been widespread, with most industries experiencing a pick-up in productivity growth. While in the construction and the finance, property and business services sectors, labour productivity has continued to decline, it has done so at a slower pace. In contrast, the levels of labour productivity in wholesale and retail trade and recreation, personal and other services industries have risen over recent years.
The sector that has made the largest contribution to the turn-around in aggregate productivity performance is the wholesale and retail trade sector – it accounts for around half of a percentage point of the increase in the growth rate. Together, the transport and storage and communications industries have contributed a further 0.3 of a percentage point to the pick-up in aggregate labour-productivity growth. A considerable contribution has also been made by the community services industry (0.45 of a percentage point).
While the movement of labour between sectors has had a larger impact on productivity growth than was previously the case, the role remains relatively small (see Figure 6). The declines in employment shares of the high-productivity utilities and communications industries have contributed negatively to aggregate labour-productivity growth. In total, the effect of the movement of labour between sectors has been to subtract nearly 0.2 of a percentage point per annum from aggregate labour-productivity growth (compared with zero, in the previous period). However, as mentioned earlier, the within-sector productivity contributions may not be independent of the contribution made by movements of labour between sectors. In particular, while in an accounting sense, the fall in relative employment in the high-productivity utilities industry has resulted in a direct decline in overall productivity, the fall in employment was probably important in generating the rapid increases in labour productivity within the sector.
Does the increase in labour-productivity growth represent a fundamental change from the 1980s experience or is it just a one-time adjustment in productivity levels and/or the result of a cyclical upswing?
The top panel of Figure 8 presents indices of labour productivity for the non-farm sector around the time of the recessions of the early 1980s and early 1990s.[10] The zero point on the time line represents the trough of the recession. The bottom panel shows analogous indices for real non-farm GDP. For the first two years of recovery, labour-productivity growth is similar in the two episodes – increasing at nearly 3 per cent per year. This is despite the fact that in the most recent episode, output growth was considerably slower. In terms of productivity growth, the real difference appears in the third year. In the episode of the early 1980s, labour productivity reached its peak ten quarters after the trough of the recession and then was basically flat for seven years. In the current recovery, labour productivity has continued to increase and, in relative terms, is now considerably above where it was at the same time in the previous cycle. In contrast, non-farm output has not yet increased to the same extent as was the case in the early 1980s.
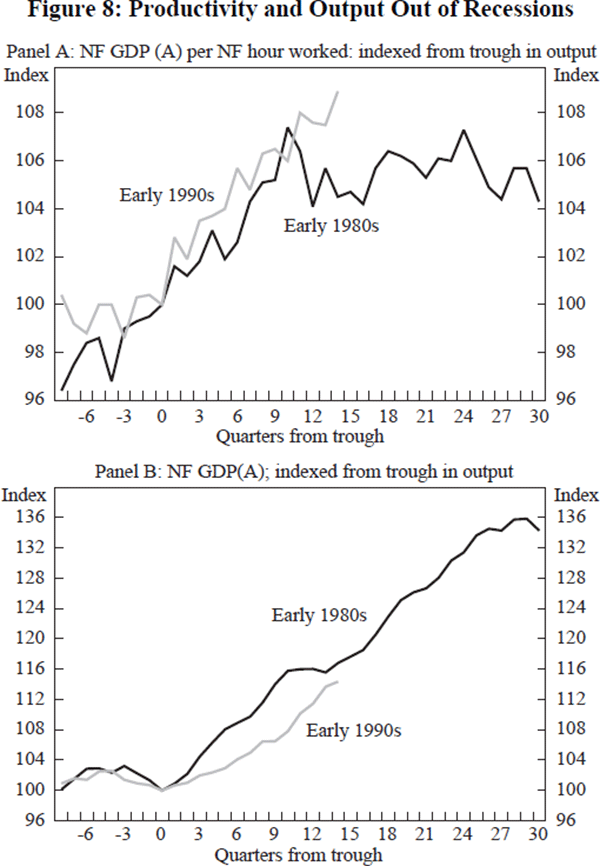
It is tempting to cite this recent difference in productivity growth as the first sign of a structural change in the underlying rate of productivity growth. However, it is clearly too early to make a definitive judgment on whether such a change has occurred. Explaining, let alone predicting, changes in productivity trends is notoriously difficult. There are, however, a number of factors that give cause for optimism. First, ongoing microeconomic reform and the competitive pressures induced by the increased internationalisation of the economy should help deliver continuing productivity improvements.[11] The implementation of the Hilmer reforms, which the Industry Commission estimate will add around 5½ per cent per annum to real GDP, is also a positive factor for future productivity growth.
Second, real wages should not need to fall as they did after the wages push of the early 1980s. To some extent, the early-1980s recession was the result of an unsustainably large increase in real wages – this was not the case in the early-1990s recession. An implication of this is that as demand increases, real wages, productivity and employment should all increase. As the cycle progresses, declining unemployment rates may well be associated with declining productivity growth, but with real wages growing, a repeat of the stagnant productivity of the second half of the 1980s experience is unlikely.
Third, as the following discussion argues, the measured performance of the wholesale and retail trade industry should be considerably better than in the 1980s. Most of the adjustment to the deregulation of shopping hours has been completed, so that the adoption of new technologies and more efficient forms of retailing should contribute to aggregate productivity growth.
Fourth, as Baily (1993) argues, the electronics revolution of the past decade has soaked up a lot of resources, as companies have computerised their workplaces and come to grips with the new technology. We may now be on the verge of reaping more fully the gains from this investment. David (1990) argues that the small productivity gains that western countries have so far seen from computerisation are analogous to the small initial gains from the invention of the electric dynamo at the end of the previous century. In that case, large productivity gains were not realised until new industrial facilities, organisational structures and complementary technologies were developed. In the current context, it is difficult to predict exactly when, and to what extent, the benefits of the recent investment in computers and information technology will show up in the productivity numbers. Nevertheless, it is probable that in the next five years substantial benefits will accrue.
While the magnitude and timing of these various factors is uncertain, collectively they provide a basis for believing that labour productivity growth will continue at a reasonable pace for the remainder of the current decade. As growth in GDP slows, some slowing of productivity growth is inevitable, but a return to the stagnant levels of labour-productivity experienced in the second half of the 1980s seems unlikely.
3. Labour-Productivity Growth in Specific Industries
Over the business cycle that ran from March 1983 to June 1991, four industries experienced a decline in the measured level of labour productivity. In the finance, property and business services sector this decline can largely be explained by problems with the measurement of labour input (see previous section). This section analyses productivity outcomes in the other three sectors: two service industries – wholesale and retail trade and recreation, personal and other services – and the construction industry.
3.1 The Wholesale and Retail Trade Industry
The wholesale and retail trade industry is the largest industry in Australia. In 1994, it accounted for nearly 18 per cent of total output in the non-farm economy (nearly 20 per cent if the ownership of dwellings, import duties and imported bank service charges are excluded) and for about 22 per cent of total hours worked.
Figure 9 shows output per hour worked in the industry over the period from March 1978 to June 1994. Labour productivity is clearly pro-cyclical; falling in recessions and increasing in booms. Perhaps more importantly, the trend rate of productivity growth appeared to change in the mid 1980s. After output per hour worked increased by around 1 per cent a year from 1978 to 1983, it fell, on average, by around 0.1 per cent a year over the following eight years.[12] More recently, labour-productivity growth has again been positive. Despite the recent rise, labour productivity in June 1994 had still not reached its previous peak in March 1984.
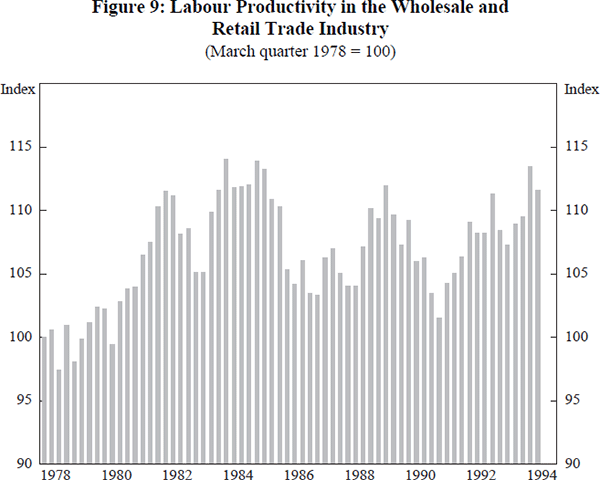
While comparable data for other countries are scarce, the low productivity growth in the wholesale and retail trade industry appears to be unusual by international standards.[13] The OECD publishes data on total-factor productivity for different sectors for member countries (Meyer Zu Schlochtern and Meyer Zu Schlochtern 1994). Unfortunately, the data for wholesale and retail trade also include the output of the hotels and restaurants sector (which under the ASIC classification system is included in the recreation, personal and other services sector). The data show that between 1970 and 1989, total-factor-productivity growth in this sector in Australia was −0.34 per cent per annum. This performance was worse than that in any other country for which data are published – on average, across the 13 countries, total productivity growth in the sector was 0.8 per cent per annum.[14]
In light of the international experience, and given the perception that there has been substantial technological innovation in the distributive trades over the past decade, the fall in labour productivity is surprising. The use of scanning devices and computer-operated stock control systems have become common place. Stores have become larger and many firms have rationalised their operations. Despite these changes, the average worker in June 1994 was processing slightly fewer goods per working hour than a worker ten years ago. We now examine why this is so.
3.1.1 Measurement issues
Firms in the distribution industry provide three core outputs: (i) distribution of goods; (ii) product information; and (iii) convenience or the minimising of transaction costs. (Some might argue that they also provide entertainment.)[15] In obtaining an estimate of the growth rate of output for the industry, statistical agencies typically only consider the first of these outputs. In Australia, in the wholesale industry, base-year output for six industry groups is extrapolated by constant price estimates of wholesalers' sales in each industry group. In the retail industry, base-year output for 16 industry groups is extrapolated by constant price estimates of industry retail turnover. This methodology assumes that output is a fixed proportion of turnover for each industry group. As such, it only takes account of the ‘distribution’ output of the sector, ignoring the supply of product information and the provision of convenience. Given current measurement practices, changes in the quality of service, opening hours, the extent of product information and the quality of the shopping environment do not lead to changes in output.
There are two principal sources of data on measured output and labour input for the wholesale and retail trade industries. The first is the periodic censuses of the retail industry and surveys of the wholesale industry carried out by the ABS. For retail trade, a census has been conducted every five or so years since 1948.[16] For wholesale trade, the most recent surveys were conducted in 1981/82 and 1991/92. The second source is that used above for the calculation of industry labour-productivity indices – that is, quarterly output data from the national accounts and labour input from the Labour Force Survey. The census/survey data provide comprehensive snap-shots at particular points in time, while the national accounts provide time-series data.
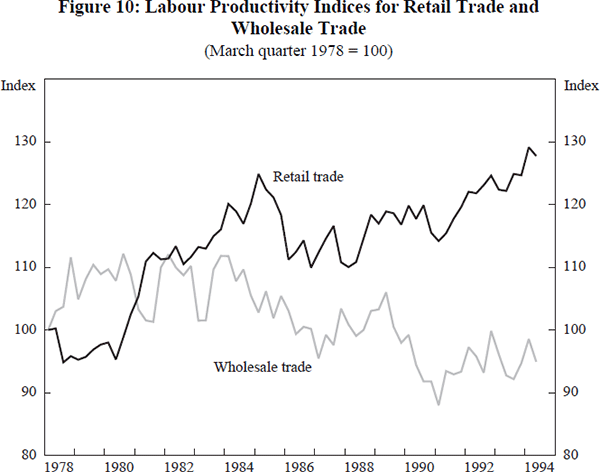
Unfortunately, the two sources present quite different pictures. The quarterly data show that in the second half of the 1980s, labour productivity fell in both the wholesale and retail industries, with the fall being more pronounced in the wholesale industry (see Figure 10). This is at odds with the results from the Wholesale Industry Surveys and the Retail Censuses. Data from the survey of wholesalers show that real turnover increased by 19 per cent between 1981/82 and 1991/92, while employment fell by 4 per cent; implying an increase in turnover per person of some 23 per cent. Over the same time period, the national accounts data show an increase in output in the wholesale sector of around 8 per cent, and the Labour Force Survey shows an increase in employment of 19 per cent (and an increase in hours worked of 23 per cent). This implies a fall in output per person of 15 per cent between 1981/82 and 1991/92.[17] In retailing the contrast is less marked. The census data appear to show slightly slower productivity growth than do the national accounts/labour force survey data, although a complete assessment is made difficult due to changes in industry definitions brought about by the switch from ASIC to ANZSIC classifications.
3.1.2 The wholesale industry
If the survey data are correct, then labour-productivity growth in wholesaling was considerably higher than that suggested by Figure 10. Table 2 presents employment and turnover data from the Wholesale Industry Survey for various sub-categories of wholesale trade. It shows that in 1991/92, almost two-thirds of total employment in wholesaling was in sub-sectors that supply investment goods (the first four categories). This explains much of the cyclicality of the industry. In all sub-sectors, with the exception of machinery and equipment, employment actually fell over the ten years to June 1992. Perhaps more importantly, the data show that in all but one sub-sector, real turnover per person increased between 1981/82 and 1991/92. The increase was particularly large in minerals, metals and chemicals, where labour productivity increased by 70 per cent over the ten year period. Given the widespread gains in labour productivity throughout the industry, it seems unlikely that labour productivity in the industry as a whole could have declined.
| Type of wholesaler | Employment | Turnover $m | % change in employment 1981/82–1991/92 | % change in turnover per person 1981/82–1991/92 |
|---|---|---|---|---|
| Builders hardware dealers | 44,155 | 6,408 | −19.7 | 20.8 |
| Machinery and equipment | 102,677 | 17,616 | 4.9 | 23.5 |
| Minerals, metals and chemicals | 31,012 | 24,438 | −20.7 | 70.7 |
| Farm properties and produce | 19,565 | 7,954 | −14.9 | −6.1 |
| Food, drink and tobacco | 43,466 | 14,516 | −14.8 | 3.1 |
| Textile and clothing | 14,875 | 3,076 | −9.3 | 6.7 |
| Household goods | 12,977 | 3,235 | −26.3 | 28.6 |
| Other specialists | 39,524 | 7,874 | −0.1 | 34.2 |
|
Notes: (a) Nominal turnover data have been deflated by the implicit price
deflator for the wholesale industry. Source: ABS Cat. No. 8638.0, 1981/82 and 1991/92. |
||||
3.1.3 The retail industry
Stores selling food account for the largest share of employment in the retail industry (see Table 3). Food stores have also been the source of the fastest jobs growth within retailing, with the number of jobs increasing by 22 per cent between 1986 and 1992. Employment in stores selling bread and cakes grew particularly strongly, increasing nearly 140 per cent over the six year period, while the number of establishments increased by nearly 90 per cent.[18] Employment growth was also very rapid in takeaway food retailing (up 41 per cent). Outside the food industry, employment grew quickly in stores selling domestic hardware and housewares (up 43 per cent) and in stores selling newspapers, books and stationary (up 28 per cent) (see Appendix A).
| Employment | Square metres per location | Turnover per square metre | Turnover per employee | |||||
|---|---|---|---|---|---|---|---|---|
| Type of store | 1991/92 | % change from 1985/86 | 1991/92 | % change from 1985/86 | 1991/92 $ | % change from 1985/86 | 1991/92 $ | % change from 1985/86 |
| Supermarket and grocery |
179,619 | 6.6 | 560 | 23.3 | 4,918 | 5.4 | 145,269 | 8.9 |
| Specialised food | 238,028 | 37.0 | 105 | 11.2 | 3,294 | −5.0 | 63,581 | −18.7 |
| Total food | 417,647 | 22.0 | 186 | 10.9 | 4,164 | 1.0 | 98,713 | −6.2 |
| Department stores | 86,576 | −9.7 | 9,084 | 3.1 | 2,508 | −10.5 | 113,172 | 3.5 |
| Clothing and soft goods |
91,653 | 8.9 | 152 | 12.0 | 2,597 | −5.0 | 94,891 | −1.3 |
| Furniture, housewares appliances |
72,503 | 23.7 | 401 | 20.2 | 2,072 | −8.8 | 163,869 | 0.2 |
| Recreational goods | 56,297 | 17.8 | 155 | 4.6 | 3,323 | 1.6 | 113,168 | −6.0 |
| Other personal and household goods |
111,026 | 39.4 | 169 | 8.8 | 1,955 | 1.5 | 82,909 | 4.1 |
| Total personal and household goods |
427,688 | 14.2 | 248 | 8.4 | 2,331 | −7.1 | 108,626 | −0.1 |
| Motor vehicle retailing and services |
215,198 | n.a. | n.a. | n.a. | n.a. | n.a. | 203,040 | n.a. |
|
Note: Turnover is in average 1989/90 prices. Source: ABS Cat. No. 8623.1. |
||||||||
Value added per employee tends to be highest in those sub-sectors selling high-value goods such as furniture and motor vehicles. According to data published from the 1985/86 Retail Census, value added per employee in these sub-sectors is about three times that in the sub-sector with the lowest value added per employee (milk bars and take away stores). While large differences exist in the level of labour productivity between sectors, international evidence suggests that large differences also exist within sub-sectors.
In general, one of the most significant determinants of the level of labour productivity for a given class of store is the size of the store. In a comprehensive comparison of retailing productivity in Britain, the United States and Germany, Smith and Hitchens (1985) conclude that, in all three countries, labour productivity increases with shop size, where size is measured by turnover. They attribute much of the superiority of retail productivity in the US to the larger size of shops in that country. A similar conclusion is reached by Baily (1993) who attributes the large size of shops in the United States to relatively weak zoning regulation, few restrictions on shopping hours and a well-developed private transport system. An OECD study into the distribution systems of a variety of countries (OECD 1992) concludes that average sales per employee tend to be 50 to 80 per cent higher in the largest class of stores than the smallest, with value added per employee being as much as 100 per cent higher. The study also reports work by Noyelle (1990) which concludes that in France, the shift to larger stores between 1980 and 1986 contributed over 1 per cent per annum to labour-productivity growth in retailing (out of a total labour-productivity growth in the sector of 2.4 per cent per annum).
As Table 3 shows, this shift to larger stores has also occurred in Australia. The increases have been particularly pronounced for supermarkets and stores selling furniture, housewares and appliances. In both cases, the average sizes of stores increased by over 20 per cent between 1986 and 1992. In most cases, real turnover has not increased as quickly, so that turnover per square metre has fallen.
Not only has the physical size of stores increased, but so too has the number of employees per store. In 1980, on average, 5.5 people worked at each retail location. By 1992, this had increased to 6.2 people. In part, this increase is due to the growth of part-time employment, with the number of full-time employees per location actually falling. The increase in the size of businesses can also be seen in the number of ‘small’ and ‘large’ businesses (small businesses are those that employ fewer than 20 people); between 1980 and 1992 the number of small businesses increased by 18 per cent, while the number of large businesses rose by 32 per cent (Kiel and Haberkern 1994).
Despite the increase in store size and the adoption of new technologies, measured labour productivity in the retail industry has fallen.[19] As is the case for the economy as a whole, changes in labour productivity within a particular sector can, theoretically, be decomposed into changes due to compositional shifts and changes due to increases in labour productivity within sub-sectors. Unfortunately, detailed data on output and hours worked by sub-sector of retailing are not published. In their place, data from the 1985/86 and 1991/92 Retail Census can be used to obtain a rough estimate of the effect of compositional shifts. These data suggest that had the employment structure that existed at the time of the 1991/92 Census existed in 1985/86, value added per employee in 1985/86 would have been up to 2 percentage points lower.
The single most important contributor to this negative compositional effect is the expansion of the fast food industry (milk bars and take-away stores); over the six years between the Retail Censuses, the share of total hours (in food and personal and household good retailing) worked in this sub-sector increased by about 5 percentage points to around 17 per cent. With value added per hour worked in this sub-sector (in 1985/86) being roughly 60 per cent of the average, this change of 5 percentage points in employment shares contributed almost 2 percentage points to the decline in retail industry productivity. An additional 1 percentage point was contributed by the contraction of hours worked in department stores, as these stores tend to have higher than average levels of labour productivity. The rapid expansion of relatively low-productivity bread stores also contributed to the slowdown.
While compositional effects may explain part of the poor productivity outcomes, they can provide no more than a partial explanation, as labour productivity appears to have fallen in a wide range of different types of stores. A comparison of the 1985/86 and 1991/92 Retail Censuses, shows that in 15 out of the 25 sub-sectors for which comparative data are available, turnover per employee fell; the largest falls being recorded in retail stores selling marine equipment, takeaway food, bread and cakes, liquor and floor coverings (see Appendix 1). A similar picture emerges when disaggregated quarterly retail trade turnover data are examined.
Why did turnover per employee fall in such a wide range of retail stores in the second half of the 1980s? One possible answer is the spread of part-time employment – workers who work fewer hours process fewer goods through the check-out. Certainly, the share of part-time employment did increase more quickly in the second half of the 1980s than it did over the first half of the decade. Over the 1980s as a whole, the ratio of employment to hours worked in the industry increased by about 4 per cent. This suggests that even if an adjustment is made to take account of a reduction in average hours, labour productivity in a variety of stores would still have fallen.
The strongest candidate for explaining the slow labour-productivity growth in retailing is the deregulation of trading hours. While deregulation has occurred at different rates in different States, stores in all states are now open for longer hours than was the case in 1980. For the 30 years following World War II, shopping hours were heavily regulated with most shops opening for around 48 hours per week. By the end of the 1970s, all States had introduced late night shopping on one or two nights per week. This had the effect of increasing average opening hours a little, to just over 50 hours per week in 1980. Nevertheless, opening hours still remained heavily regulated.
In New South Wales, the regulations began to be eroded in late 1984 when shops were permitted to trade on Friday nights and Saturday afternoons. The success of these longer hours saw increasing pressure for further deregulation, which finally came in 1989 when unrestricted trading hours on Monday to Saturday were introduced. While regulations concerning Sunday trading remain, they are in large part ineffective. Deregulation has also occurred in other states, but in most cases the process has been slower. For example, in Victoria and South Australia, the extension of Saturday trading to 5:00 p.m. took place in 1987.
Kiel and Haberkern (1994) estimate that deregulation has led to an increase in average opening hours in Australia from 52 hours per week in the early 1980s, to 56 hours in 1986 and to 61 in 1992. In New South Wales and the ACT, where deregulation has been more extensive, they estimate that shops were open for an average of 66 hours in 1992 – 15 hours a week more than in 1980. These changes represent an increase of almost 30 per cent in the hours that the average retail store is open in NSW, and an increase of almost 20 per cent Australia wide.
While unpublished data from the ABS show a slightly smaller increase in average shopping hours, the increase is nevertheless significant; the data show that in 1992, the average retail store was open 57 hours. On average, supermarkets were open 75 hours per week; a 12 per cent increase since 1986. Since 1992, hours of operation of many supermarkets have been extended further with a number of supermarkets now open 24 hours a day. With the exception of household appliance stores, all categories of stores recorded longer shopping hours in the 1991/92 Retail Census than in the 1985/86 Retail Census.
Longer shopping hours have increased shopper convenience and thus have led to an increase in the broad concept of output of the retail sector. However, it is unlikely that they have had any substantial effect on the standard measure of output, as opening stores for longer hours is unlikely to change savings-consumption decisions. On the other hand, it would be surprising if an increase of nearly 20 per cent in average opening hours did not require an increase in the number of hours worked. As a result, longer shopping hours imply a reduction in the average level of labour productivity. Longer hours may have also contributed to the negative compositional effects. A good example is bread shops where deregulation of baking hours has led to a proliferation of specialist bread shops which tend to have low levels of labour productivity. Working in the opposite direction is the idea that deregulation of shopping hours has encouraged the move to larger stores with higher levels of labour productivity.[20]
The ‘shopping-hours’ explanation is supported by state-based data on turnover per person employed in food stores. The data suggest that labour-productivity growth was slower in those states that undertook the most extensive deregulation of shopping hours. The shopping hours explanation is further supported by the fact that the largest declines in labour productivity in the retail sector took place at the same time that employment was expanding rapidly. Further support is suggested by the work of Baily and Gordon (1988) who provide a ‘back-of-the-envelope calculation’ of the effect of regulation of shopping hours on labour productivity. They estimate that if German shopping-hours regulations were applied to the United States, total GDP might be 5 per cent higher (assuming that the workers ‘released’ from the retail sector are employed elsewhere in the economy). While this estimate is almost surely on the high side, Baily and Gordon argue that, at least conceptually, making a reasonable adjustment for the output of ‘convenience’ might offset all of the productivity slowdown in US retailing. In reality, however, the extension of shopping hours in the US considerably predates the productivity slowdown. This is not the case in Australia.
If this interpretation of events is correct, then measured productivity in the sector would be increased by re-regulation of shopping hours. This would, however, be an absurd reaction. Once shopping hours were deregulated, many retailers moved quickly to extend their hours of operation. Such a move was in response to a clear public demand for greater flexibility in the timing of shopping.[21] This raises an important issue. Normally slower productivity growth is associated with a slower rate of increase in conventionally measured living standards. However in this case, the link between growth and welfare has been weakened. While an evaluation of the benefits that households received from longer shopping hours is beyond the scope of this paper, revealed preference says that these benefits may be quite significant. By not making an adjustment to the quality of the output of the retail sector, the statistician may have underestimated output and overestimated the price of that output. On the positive side, given that hours deregulation has already occurred on a widespread scale, the magnitude of this measurement problem should not grow any further.
3.2 The Recreation, Personal and Other Services Industry
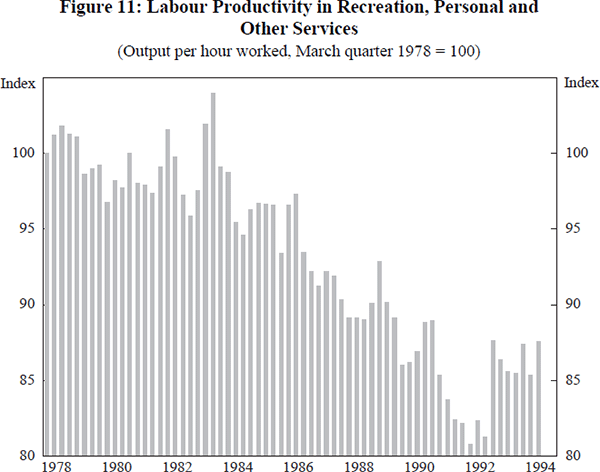
The recreation, personal and other services sector plays only a small role in explaining changes in aggregate labour-productivity growth, but the large fall in the level of labour productivity makes it an interesting case for study. In 1992, the level of labour productivity in the industry was only about 80 per cent of the level in 1978. As can be seen from Figure 11, the bulk of this fall occurred between 1984 and 1991. This was also a period of very rapid employment growth. Over this seven year period, total hours worked in the sector increased by 40 per cent.
Using the ASIC data, the industry has three main sub-sectors:
- entertainment and recreation services;
- restaurants, hotels and accommodation services (the ‘hospitality’ sub-sector); and
- personal and other services.
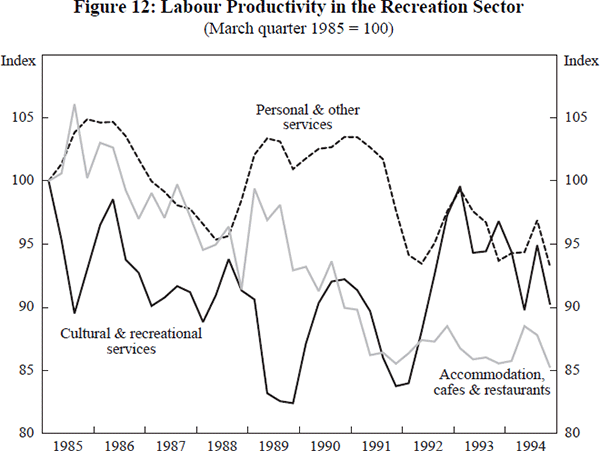
In 1993, the hospitality industry accounted for 54.8 per cent of total industry employment (up 3 percentage points over the past ten years) while entertainment and recreation services and personal and other services accounted for 23.4 and 21.9 per cent respectively (up 0.2 and down 3.1 percentage points respectively). Separate output data are not published for all three sub-sectors, but output and hours worked data are available for similar ANZSIC categories since the mid 1980s. Figure 12 shows indices of labour productivity for the relevant categories. In both cultural and recreational services and accommodation, cafes and restaurants, the level of labour productivity fell significantly through the second half of the 1980s.
In assessing the industry's overall performance, developments in the hospitality sector are particularly important, as this sector accounts for over half of the industry's employment. The hospitality sector (using the ASIC classification) has four principal components: accommodation; pubs, bars and taverns; cafes and restaurants; and licensed clubs. An indication of the importance of these various sub-sectors and the relative levels of labour productivity can be obtained from the ABS's 1991/92 Survey of Hospitality Industries. Similar surveys were also conducted in 1979/80 and 1986/87.
Table 4 shows the share of part-time and full-time hospitality employment accounted for by each of these sub-sectors in 1986/87 and 1991/92. It also shows nominal gross industry product per full-time equivalent worker. Unfortunately, deflators for the different sub-sectors are not published.
| Share of full-time employment | Share of part-time employment | Productivity level ($ per full-time equivalent worker) | ||||
|---|---|---|---|---|---|---|
| 1986/87 | 1991/92 | 1986/87 | 1991/92 | 1986/87 | 1991/92 | |
| Accommodation | 25.6 | 30.8 | 15.8 | 16.2 | 24,882 | 28,412 |
| Pubs, bars and taverns | 26.0 | 18.7 | 32.0 | 25.2 | 22,543 | 29,146 |
| Cafes and restaurants | 30.7 | 32.7 | 31.6 | 39.8 | 15,616 | 20,108 |
| Licensed clubs | 17.7 | 17.9 | 20.7 | 18.8 | 29,284 | 35,081 |
| Total | 100.0 | 100.0 | 100.0 | 100.0 | 22,440 | 26,830 |
|
Notes: (a) Full-time equivalent employment is calculated as full-time employment
plus half of part-time employment. Source: ABS Cat. No. 8674.0. |
||||||
In terms of employment, the accommodation and restaurant sub-sectors have clearly been the fastest growing. Cafes and restaurants have increased their share of part-time employment in the hospitality industry from 31.7 per cent to 39.8 per cent and their share of full-time employment by two percentage points to 32.7 per cent. Between 1980 and 1992, the number of businesses operating cafes and restaurants increased by 73 per cent to 8,741 while employment rose by 202 per cent. The accommodation sector also enjoyed strong employment growth, with the number of jobs increasing 92 per cent over this 12-year period. Table 4 suggests that many of these jobs were full-time jobs, with accommodation's share of total full-time employment in the hospitality sector increasing from 25.6 to 30.8 per cent over the period from June 1987 to June 1992.
There are quite large differences in the level of productivity between the various parts of the hospitality sub-sector. Licensed clubs have the highest level of labour productivity, with cafes and restaurants having the lowest level. Using the data for 1991/92, the level of labour productivity in restaurants and cafes is equal to three-quarters of the level of labour productivity for the hospitality industry and 57 per cent of the level of labour productivity in licensed clubs. As a whole, the level of labour productivity in the hospitality sector is lower than the average for the entire recreation, personal and other services sector.
At this level of aggregation, differences in productivity levels, together with changes in the structure of employment appear to have led to relatively large compositional effects on the sector's productivity performance. Within the hospitality industry, the sub-sector with the fastest employment growth has been the lowest labour productivity sector. If the employment shares that existed in 1991/92 had applied in 1986/87, then the level of labour productivity in the hospitality industry in 1986/87 would have been around 2½ per cent lower than was actually the case. While this calculation only provides a rough estimate of the impact of compositional effects, it does suggest that, at least in this component of the industry, these effects may be important.
While the growth of relatively low-labour-productivity industries may have contributed to low productivity growth for the industry as a whole, it is again unlikely that compositional effects provide the full explanation. In a number of the industry's sub-sectors, the available data suggest that there has been relatively limited productivity growth. The data in Table 4 suggest that nominal labour productivity in cafes and restaurants increased by 28.8 per cent over the period 1986/87 to 1991/92. Over this same time period the ‘meals-out’ component of the CPI increased by 30.2 per cent. Similarly, nominal productivity in pubs, bars and taverns increased by 29.3 per cent, while the prices of alcoholic beverages increased by 34.1 per cent.
Low productivity growth of these sectors is also suggested by a comparison of the results from the 1986/87 Services Industry Survey and the 1979/80 Census of Retail and Selected Services Industry. These surveys provide estimates of real turnover (in 1986/87 prices) per employee. These estimates are shown in Table 5 as a percentage of turnover-per-employee in the cafes and restaurant sub-sector in 1979/80.
| 1979/80 | 1986/87 | |
|---|---|---|
| Accommodation | 116.2 | 123.8 |
| Hotels (drinking places) | 190.8 | 178.4 |
| Cafes and restaurants | 100.0 | 91.8 |
| Licensed clubs | 163.1 | 154.3 |
| Hairdressers and beauty salons | 60.6 | 61.0 |
| Laundries and dry cleaners | 91.8 | 97.9 |
| Motion picture theatres | 148.8 | 175.7 |
|
Note: Real turnover (in 1986/87 prices) per employee is given as a percentage of real turnover per employee in cafes and restaurants in 1979/80. Source: ABS Cat. No. 8650.0. |
||
In cafes and restaurants, real turnover per employee fell by 8.2 per cent over the seven years to 1987. This fall is partly due to an increase in part-time employment, but turnover per full-time equivalent worker has also declined. A similar picture emerges for hotels and licensed clubs. Productivity improvements in hairdressing also appear to be extremely small, with real turnover per employee barely increasing over the seven years. Laundries and drycleaners, and especially movie theatres, appear to have done considerably better.
The evidence suggests that many of the sub-sectors of the industry have not experienced significant improvements in productivity. In large part, this reflects the highly labour-intensive and service-oriented nature of these sub-sectors – it is difficult to make hairdressing a more capital-intensive activity and it is difficult to substitute capital equipment for waiters in a restaurant. Perhaps, the greatest scope for ‘technical progress’ in many of these industries is the provision of better quality service with the same labour input. As in the case of retailing, such improvements are difficult to capture in the measure of output used in the national accounts.
While the above data do not provide a complete picture, they do suggest that the declining level of labour productivity in the recreation, personal and other services sector is the result of both compositional effects and stagnant or declining average productivity levels in a number of important sub-sectors. This has occurred at the same time that employment in the sector has grown rapidly – in fact, the periods of most rapid decline in labour productivity have coincided with the periods of most rapid employment growth. One explanation for this combination of low productivity growth and strong employment growth is a decline in the sector's real product wage; this allowed firms to employ more workers even though the new workers were reducing the average level of labour productivity in the industry. We return to this issue in Section 4.
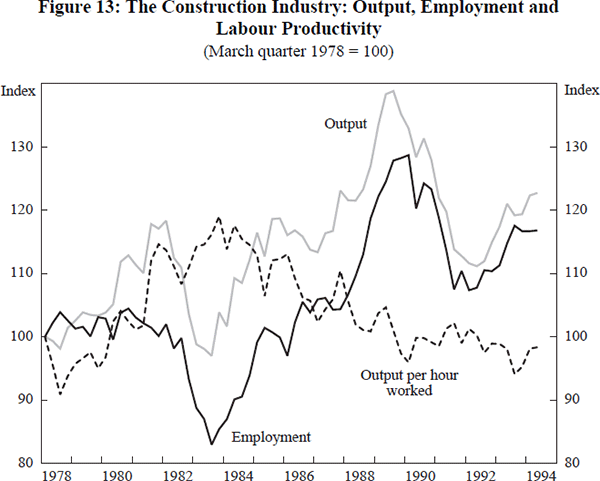
3.3 The Construction Industry
Between March 1983 and June 1991, output per hour worked in the construction industry declined at a rate of almost 1½ per cent per year. This deterioration followed a long period of relatively solid productivity growth and occurred at the same time that employment and output were growing particularly rapidly (see Figure 13). While the decline in productivity is apparent for both private and public construction, it is more pronounced in public construction; between March 1983 and June 1991, output per person in private sector construction fell by 5.4 per cent, while in the public sector, labour productivity fell by 17.7 per cent.
The fall in productivity in public sector construction can be explained, in part, by compositional effects. After 1984/85 there was a sharp decline in public sector gross fixed capital expenditure, with the fall in State government expenditure in the electricity sector being particularly pronounced (see Australian Treasury (1994)). While we know of no data that provide estimates of value-added for various sub-sectors of government construction, it is reasonable to assume that value-added in electricity construction was relatively high, so that the decline in this type of construction made a direct negative contribution to productivity growth (this is, of course, not a bad thing). While compositional effects are important for government construction, they are not the complete answer to the declining productivity in the construction sector, as the level of productivity in the private sector also fell.
The extent of the deterioration in private sector construction is surprising and is at odds with data obtained from the Construction Industry Surveys. A comparison of results from the 1984/85 and 1988/89 surveys shows that over this period, value added per employee in the private sector increased by around 16 per cent, with increases experienced in most sub-sectors (see Table 6). The survey data also suggest that compositional effects within the private sector play only a small role in explaining the outcomes. While the share of the non-building construction sector in total employment fell, the share in another high productivity sub-sector – non-residential building – rose. The biggest fall was in the employment share of residential building construction which has a relatively low level of productivity. In summary, if the 1984/85 employment weights are applied to the 1988/89 productivity data, the level of labour productivity in 1988/89 would have been higher by slightly more than 1 per cent.
| Type of construction | Share of value added | Share of employment | Value added/employment | ||||
|---|---|---|---|---|---|---|---|
| $'000 | % change | ||||||
| 1984/85 | 1988/89 | 1984/85 | 1988/89 | 1984/85 | 1988/89 | ||
| Residential | 15.8 | 13.8 | 16.1 | 12.9 | 29.3 | 30.0 | 2.4 |
| Non-residential | 15.3 | 19.2 | 9.8 | 12.0 | 37.9 | 45.2 | 19.3 |
| Total building | 31.1 | 33.0 | 25.9 | 24.9 | 29.2 | 37.3 | 27.9 |
| Road and bridge | 6.5 | 5.8 | 3.7 | 3.0 | 42.8 | 53.7 | 25.5 |
| Other non-building | 10.1 | 7.5 | 7.0 | 6.3 | 35.2 | 33.5 | −4.8 |
| Total non-building | 16.7 | 13.3 | 10.7 | 9.4 | 37.9 | 40.1 | 5.8 |
| Trades | 52.2 | 53.7 | 63.4 | 65.9 | 20.0 | 23.0 | 15.0 |
| Total | 100.0 | 100.0 | 100.0 | 100.0 | 24.3 | 28.2 | 16.0 |
|
Note: Value added is at average 1984/85 prices. Source: ABS Cat. No. 8771.0. |
|||||||
In contrast to the survey data, the national accounts shows a decline in private sector labour productivity of 2.3 per cent between 1984/85 and 1988/89. This difference stems largely from different rates of increase in output, rather than labour input. To obtain quarterly estimates of private-sector construction output, the statistician extrapolates base-year output by various components of gross fixed capital expenditure on construction by the private sector. This approach assumes that input prices increase at the same rate as output prices. This approach also means that any biases in the deflators for gross fixed capital expenditure on construction will also affect the measurement of output of the construction sector. It is difficult to determine to what extent biases exist. Certainly studies in the United States suggest that the deflators for residential construction are biased upwards due to the inadequate measurement of improvement of building quality. Baily and Gordon (1988) estimate that in the US, the residential construction deflator has been upward biased by at least 1 per cent per year for the past 30 years. This is reflected in a pronounced trend decline in productivity in the construction sector. However, it is unlikely that this provides an explanation for the Australian data, since it would require that the systematic mismeasurement of quality became worse in the mid 1980s. There is no obvious reason to believe that this was the case.
There is nevertheless, a question mark over the residential construction deflator, especially in the second half of the 1980s. Historically, this deflator has increased at roughly the same rate as the price index for materials used in housing construction; over the 16 years to September 1986, the dwelling deflator increased at an average rate of 9.6 per cent per year, while the input price index increased at an average rate of 9.5 per cent. In contrast, over the three years to September 1989, the output deflator increased more rapidly than the input price index; 11.3 per cent compared with 8.7 per cent. The rise in the dwelling deflator also exceeded the rise in the non-residential building deflator and the engineering construction deflator (7.5 per cent and 6.1 per cent per annum respectively) and the rise in the household repairs and maintenance component of the CPI (6.0 per cent per annum).
Why did the dwelling deflator increase so quickly? One clue lies in the close correspondence between the dwelling deflator and the Australia-wide price series for new project homes. This series is available from June 1986, and over that period it tracks movements in the deflator quite closely. The project home series is derived from surveys of project home builders, with the ABS asking respondents to exclude land costs. Despite this, there is some circumstantial evidence that the price series may be capturing something other than construction costs. The State-based data show unusually large differences in price increases across States; over the five years following June 1986, the price of a project home rose by more than 60 per cent in Sydney and Brisbane, but only by a little more than 20 per cent in Adelaide and by just over 30 per cent in Perth and Hobart. Such differences are striking, especially when the inputs that go into a house are traded in an essentially national market, and their prices increased at very similar rates in all states. In Sydney – which experienced the country's fastest increases in project home prices in the late 1980s – the pattern of prices changes corresponds quite closely to the general increase in established house prices.
While the builders of project homes may have substantial pricing power in individual markets, the size of the increase in prices, and the variation across States, at least raises the possibility that the dwelling deflator may have been overestimated in the late 1980s. A more comprehensive analysis, however, awaits further research. In any case, even if the dwelling deflator had increased at the same rate as input prices, this would still not fully explain the decline in labour productivity in private-sector construction. A further possible explanation for the slowdown is that the rapid employment and output growth in the construction industry was associated with a reduction in the average skill levels of workers in the industry and to less efficient construction practices. This explanation, however, still has to confront the evidence from the Construction Industry Survey which shows solid productivity growth.
4. Wages and Productivity
One of the most frequently given explanations for the slowdown in aggregate productivity growth in the second half of the 1980s is that wages fell relative to the cost of capital and that this led firms to substitute labour for capital. Certainly after 1982/83, there was a significant decline in the share of GDP going to labour as real wages and real unit labour costs fell. Over recent times, analysis of the links between productivity and wages has often stopped with the observation that aggregate wage restraint led to a slower rate of increase in the capital-labour ratio and thus to slower labour-productivity growth. However, just as changes in output at the industry level can offer insights into the productivity issue, so too can sectoral changes in prices and wages.
The form of the links between wages, prices and productivity growth have long been debated in Australia. Discussion of the wage decisions made by the Commonwealth Conciliation and Arbitration Commission in the 1950s and 1960s was often centred on the relationship between average productivity growth and the increase in the aggregate nominal wage.[22] At the industry level, analysis of the various linkages is made difficult by the fact that there is no dominant model in which to analyse outcomes. In general equilibrium, nominal wages (adjusted for skill differentials) should be the same in each industry. An increase in productivity, even if just in one industry, should lead to an increase in wages throughout the entire economy and, as a result, a change in relative prices and a reallocation of labour and capital. In practice, the labour market is rarely in equilibrium and changes in the level of productivity in one sector may influence both the sector's relative wage and the ability of the sector to attract resources from other parts of the economy.
The long time taken to re-establish equilibrium makes it difficult to formulate strong testable propositions. This difficulty is compounded by Australia's historically relatively centralised wage-fixation system, which created the possibility that, at least for a period of time, real wage increases were not directly tied to labour-productivity growth. This was particularly important in the 1980s. Over this period, real wages fell in a number of industries. This was not solely an outcome of the productivity performance of those sectors, but also reflected a decision by policy makers to achieve employment growth by reducing real wages; using the industry data, there is quite a strong negative correlation between productivity growth and growth in hours worked.
Even if the labour market was always in equilibrium, there are still no definitive predictions about changes in the sectoral allocation of labour and capital in response to productivity improvements in a particular sector. If one sector has an improvement in its technology, it may attract more workers and more capital, but it is also possible for that sector to lose both capital and labour. The loss of jobs in an industry undergoing relatively rapid productivity improvements is more likely if the underlying technical change is biased against labour, demand growth is weak and there are limited opportunities to substitute labour for capital. However, in general equilibrium, any labour made redundant by technological change is re-employed elsewhere in the economy in response to a change in relative factor costs. As discussed above, this equilibrium might be a long time in coming. A more difficult issue is what happens when technological change reduces the demand for a certain type of worker. If real wages for these workers fall, the level of employment in general equilibrium may well be lower if the new wage is below the workers' reservation wage.
In the following discussion an eclectic view is taken and it is argued that the evidence suggests that the links between wages and productivity have worked in both directions. Relatively high labour-productivity growth in some sectors has resulted in nominal wage increases in those sectors greater than average wage increases. In contrast, in other industries, the real wage restraint of the 1980s substantially reduced real product wages, and this allowed firms to take on more workers than would have otherwise been the case. On average, these workers produced less output than the existing workers and this reduced labour-productivity growth. This is particularly important in the recreation, personal and other services sector, and to a lesser extent in the wholesale and retail trade and construction sectors.
4.1 Productivity, Wages, Prices and the Mismeasurement of Output Growth
To discuss the relationship between measured productivity growth, wages and prices we start with a simple economy-wide production function. Real output, Y, is produced with capital, K, and labour, L, using the following constant returns to scale technology:

With fixed capital and labour, the rate of increase in real output equals the rate of technological progress:

where ^ denotes percentage change.
The rate of increase in nominal output can be decomposed into the rate of increase in real output and prices. Further, if real wages increase at the same rate as real output, the following holds:

where P represents prices and w represents real wages.
Given that  is known, if the statistician underestimates
 , then the rate of price increase is overstated.
In the extreme case, if technological progress is occurring but is assumed
to be zero, the increase in nominal output is treated as inflation. It also
means that measured real wages growth is zero, when in fact real wages are
increasing.
, then the rate of price increase is overstated.
In the extreme case, if technological progress is occurring but is assumed
to be zero, the increase in nominal output is treated as inflation. It also
means that measured real wages growth is zero, when in fact real wages are
increasing.
We now move to partial equilibrium, assuming that labour does not move, or at least moves slowly, between sectors. In this case, an industry with relatively fast productivity growth should experience an increase in its relative nominal wage (because the relative marginal product of labour has increased) and a reduction in the relative price of its output (because relative marginal cost has declined). Therefore:

where W denotes the nominal wage and subscript i represents industry i.
This relationship implies that in the industry with relatively fast productivity growth, not only does the nominal wage increase relatively quickly, but so too does the relative product wage. Now consider what happens when the statistician incorrectly assumes that there is zero productivity growth in this industry. In this case, the increase in nominal output is interpreted as an increase in price, and thus the following relationships may apply:

While the nominal wage in the high-productivity-growth industry is still likely to increase faster than in the economy as a whole, the same is now also true for prices, so that the real product wage in the industry increases by a smaller amount than when there are no measurement problems. In the extreme case, if all sectors suffered the same measurement problems, those sectors with the fastest productivity growth would experience increases, rather than decreases, in their relative prices. Thus changes in relative prices and real product wages may give misleading signals as to relative rates of productivity growth. On the other hand, changes in nominal wages are likely to be subject to fewer measurement problems and, as a result, the behaviour of nominal wages might help provide insight into productivity outcomes at the industry level.
Suppose a sector shows negative productivity growth and a relatively fast increase in its implicit price deflator, but also a relatively large increase in its relative wage and its share of the economy's resources. This suggests that productivity growth in the sector is being mismeasured – a low-productivity-growth sector should not be able to attract an increasing share of resources and at the same time, pay those resources more than they are being paid elsewhere.
This analysis assumes that wages are determined by the marginal product of labour and that marginal products are not quickly equalised across sectors. Both assumptions are subject to question. If wages are set exogenously (at least for a period of time) and the economy is at less than full employment, a decline in real product wages will generate increased employment. Unless there is an improvement in technology, this increased employment will cause a decline in labour-productivity growth (that is, there will be a movement along the demand curve as opposed to a technology-induced shift of the curve). The other caveat is that in general equilibrium, nominal wages (adjusted for skill) in all sectors increase at the same rate, irrespective of industry productivity performance. Despite these qualifications, data on nominal wages may be useful in interpreting the industry productivity outcomes.
4.2 Productivity and Relative Nominal Wages
We now turn to the data on sectoral relative earnings and productivity growth. We have data on average weekly earnings of managerial and non-managerial workers in each of the 11 sectors. Figure 14 shows the relationship between labour-productivity growth and the change in relative earnings. The vertical axis shows the change in the log of labour productivity between March 1978 and June 1994; the faster an industry's productivity growth, the higher is the industry on the vertical scale. The horizontal axis shows, for the same period, the change in the ratio of average weekly earnings in the sector to economy-wide average weekly earnings; industries to the right of the vertical line at zero have experienced larger than average percentage increases in earnings. The top panel uses earnings of managerial workers and the bottom panel uses earnings of non-managerial wages.[23]
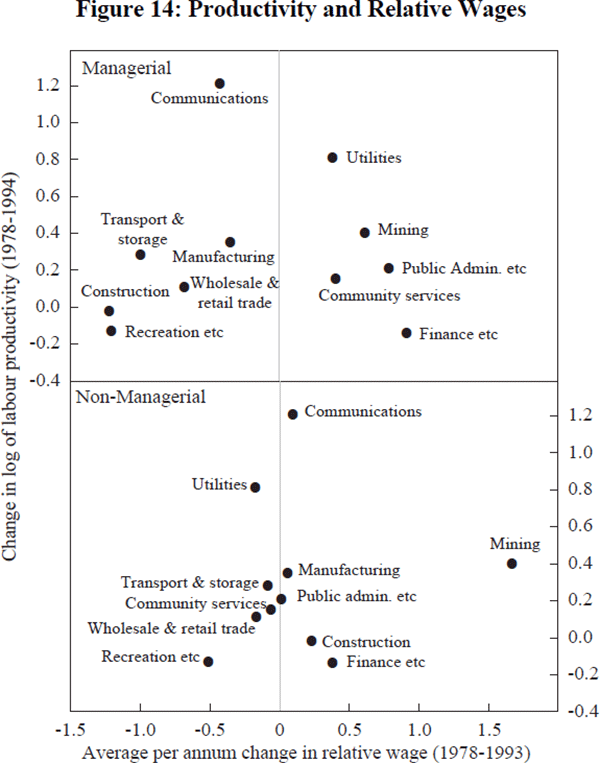
If relatively fast labour-productivity growth in one sector leads to an increase in the relative nominal earnings paid in that sector, the observations in these graphs should lie around an upward sloping line. While the relationship between relative productivity growth and relative earnings is quite weak, it does appear that in the wholesale and retail trade and recreation, personal and other services sectors, relative earnings for both managerial and non-managerial workers have declined.[24] In contrast, workers in the high-productivity-growth mining sector experienced increases in their relative earnings. The data also suggest that in the utilities industry, the high productivity growth has been reflected in the wages of managerial workers, but not in the wages of the non-managerial workers. One possible explanation of this difference is that the technological change that has taken place in this industry is biased against relatively unskilled labour. It is also possible that the rather weak relationship between relative wages and relative labour productivity growth may reflect the fact that the 16-year time period is long enough for the general equilibrium results to establish themselves.
The finance, property and business services industry appears to be an outlier. Non-managerial workers in this industry have gained larger increases in earnings than workers in any other industry, with the exception of the mining industry. Further, the increases paid to managerial workers were the highest in any sector. At the same time that the finance sector was paying relatively large wage increases it was increasing its share of total hours worked; the share rose from 8.2 per cent in March 1978 to 12.7 per cent in June 1994.
Despite these changes, the data show a fall in the level of labour productivity in the finance sector over this 16 year period. Even if we abstract from the problems caused by the differences in the Survey of Employment and Earnings and the Labour Force Survey, measured labour-productivity growth in the industry was essentially zero. As the above discussion indicated, it is difficult to reconcile zero productivity growth with rising relative wages and a rising employment share. This suggests that the assumption of zero labour-productivity growth in the finance industry is inappropriate. In fact, the increasing relative wages in this sector is suggestive of substantial productivity improvement.
4.3 Productivity and Real Product Wages
Employment decisions are made on the basis of real product wages not real consumption wages. Over long periods of time the price deflators in different industries can move quite differently. Over the period from 1978/79 to 1992/93, the average annual increase in the implicit price deflator for the mining industry was 4.2 per cent, while the deflators for the recreation, personal and other services and finance, property and business services industries increased at annual rates of over 8.5 per cent. Such differences, cumulated over a long period of time can make large differences to the real product wages paid in the various sectors of the economy. Provided there are no measurement problems, sectors that experience relatively rapid productivity growth should experience increases in their real product wages, as the productivity improvements tend to put upward pressure on the sector's nominal wage and downward pressure on the price of the sector's output. Conversely, sectors with relatively low productivity growth should have declining product wages. As discussed above, this can also occur when there is excess supply in the labour market; in this case declining product wages ‘cause’ a decline in productivity by allowing less productive labour to be employed.[25]
Figure 15 is similar to Figure 14 but now the horizontal axis shows the percentage change in real product wages over the period 1978 to 1993. Here, the observations tend to lie much more clearly around an upward sloping line. This implies that the faster is a sector's labour-productivity growth, relative to the economy as whole, the larger is the increase in the sector's real product wage. That is, differences in productivity growth tend to show up in relative prices, rather than relative wages. This positive (negative) correlation between productivity growth and real product wages (relative prices) is an enduring one. In examining wage and price outcomes in Australian manufacturing in the 1950s, Whitehead (1963, p. 189) found that approximately 70 per cent of changes in relative prices were associated with differential productivity movements. A similar conclusion was reached by Salter (1960) is his study of UK manufacturing.
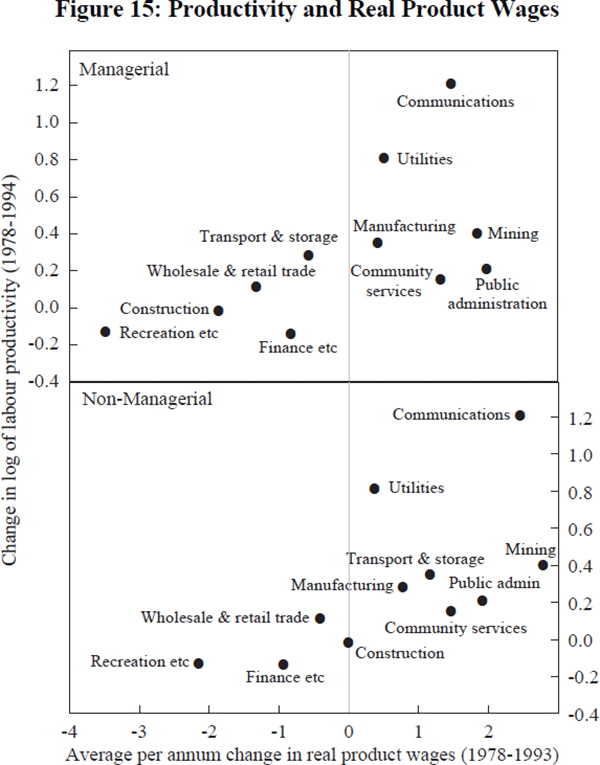
This positive association between productivity growth and real product wages it well illustrated by the recreation, personal and other services sector; it experienced the poorest productivity performance and it has also experienced the largest decline in its product wage. This decline reflects both relatively low nominal wage increases and a relatively rapid increase in the sector's price deflator. Apart from the difficulty of capturing changes in the quality of service provided, the measurement of real output in this sector is not plagued with serious problems. The low nominal wage increases suggest that the sector's overall productivity performance has indeed been relatively poor and, as a result, the relative price of the sector's output has increased. A similar picture emerges for the construction and the wholesale and retail trade sectors.
Together, wholesale and retail trade and recreation, personal and other services accounted for 31 per cent of the additional hours worked between March 1983 and December 1989. Workers in these industries tend, on average, to be less highly skilled than workers in the economy as a whole, and have weaker job tenure. Through holding down their real wages and allowing greater flexibility in work arrangements, firms found it profitable to take on workers, even though there was relatively little productivity growth in these sectors. Almost by definition, these new workers had lower levels of labour productivity than the existing workers, as firms were only willing to employ them at lower real product wages. In simple terms, a reduction in relative product wages was required to generate the jobs in sectors in which productivity growth was less than average; this reduction was brought about through wage restraint, but an increase in the relative price of the sectors' output also played an important role.
Measured real product wages have also fallen in finance, property and business services, but unlike the recreation sector, relative nominal wages have risen. The fall in product wages in this sector, is driven solely by the increase in the relative price of the sector's output. As discussed above, if a sector experiences productivity growth, but no growth is recorded, the measured price of the sector's output will increase. This appears to be what has happened in the finance industry, particularly in the period following the deregulation of the financial system. To a large extent, the increasing relative nominal wages in the sector reflect productivity growth, but this increase in wages is offset by an overstated increase in the price of the sector's output. The problems induced by this distortion are likely to increase through time, as the finance, property and business service sector is accounting for an increasing share of hours worked.
5. Summary and Conclusions
The past decade and half has seen considerable liberalisation of the Australian economy and extensive microeconomic reform. While these reforms promised a faster rate of labour-productivity growth, it is only over the past few years that we have any signs in the published data that this is being delivered. In fact, there was virtually no increase in the measured level of labour-productivity over the second half of the 1980s. In part, this reflects a number of measurement problems together with the fact that an increasing share of the work-force was finding jobs. While some of the recent pick-up in productivity growth is related to the business cycle, a number of fundamental factors, in combination with a lessening of measurement problems, gives cause for optimism that Australia's trend rate of productivity growth is now higher than that of the 1980s.
The reasons for changes in productivity growth have long presented a puzzle for economists. This paper attempts to find, and to put together, just a few pieces of the puzzle. These pieces are found in the industry-based data. These data provide insights into the industries driving the aggregate results and, combined with data on wages, raise some important measurement issues. They also provide insight into the links between industry labour-productivity growth and industry relative wages.
While measurement problems are an unfortunate fact of life in decomposing nominal output into its price and quantity components, the problems appear to have been particularly pronounced over the second half of the 1980s. In the retail industry, the extension of shopping hours increased employment and the provision of ‘convenience’, but this was not captured in the output statistics. In the finance, property and business services sector, the rapid employment growth over the second half of the 1980s appears to have been underestimated by the series that is used to extrapolate output growth. In the construction industry, output may have been underestimated due to the unusually rapid increase in the dwelling construction deflator.
While compositional effects also play some role in explaining the low productivity growth of the 1980s, the role is relatively minor. However, one area where they may have been important is in recreation, personal and other services industry. Within this sector, there was strong growth in employment in restaurants which, according to the published statistics, tend to have relatively low levels of labour productivity. Thus, as this sector expands, measured labour-productivity growth is retarded, although to date, this effect has been relatively small.
These compositional effects raise an important issue. As income levels continue to increase, activities that were once undertaken in the home (for example, preparing food) are increasingly being undertaken in the market sector. While such a move tends to increase people's living standards, it slows the increase in conventional measures of average living standards. As the service sector continues to grow, given current measurement practices, the relationship between improvements in actual living standards and the amount of output produced per hour worked may weaken further. Only by moving to some other broader concept of output – which includes convenience – might trends in labour productivity more closely match trends in living standards.
Not all industries experienced a slowdown in labour productivity growth over the second half of the 1980s. The utilities, mining, communications and transport and storage industries all recorded faster labour-productivity growth between March 1983 and June 1991 than in the previous five years. To some extent this improvement in performance reflected the reforms taking place in these industries. The macroeconomic benefits of these reforms, however, were masked by developments in other industries.
Notwithstanding the particulars of individual industries, the decline in real wages between 1983 and 1989 played an important role in underpinning the productivity growth slowdown in the 1980s. Falling real wages allowed firms to take on additional workers – whether it be in retail stores, community services, or in the hospitality sector – despite the fact that the extra output produced by a new worker was less than that produced, on average, by existing workers. This employment-induced decline in labour productivity should not be seen as a bad outcome, as unemployed workers went from producing no measured output, to contributing positively to measured national income. In doing so, they contributed to rising living standards, if not rising labour productivity.
In the longer term, the causation between wages and productivity clearly runs the other way, with increases in economy-wide labour productivity generating higher aggregate real wages. At the industry level, the picture is a little more complicated. In the short term, higher productivity growth in one industry may generate higher wages in that industry. Eventually, however, labour is mobile between industries, so that differences in wages across industries (adjusted for skill) cannot increase without bound. In the long run, even those sectors with no productivity growth must pay higher wages and thus differences in productivity growth tend to show up in relative prices, and not relative wages.
Looking forward, a critical question is whether the increase in labour productivity seen over the past three years represents a cyclical rebound or the start of a period of continuing strong productivity growth. If it is just cyclical, or a one-time level adjustment, and the pattern of the 1980s is to be repeated, then the level of labour productivity is unlikely to increase much before the end of the decade. This would have serious implications for the sort of wage increases that are consistent with maintaining a low-inflation environment.
While some slowing of the recent pick-up in labour productivity growth is inevitable, there are some tentative signs that productivity growth over the 1990s is going to exceed that in the 1980s. Labour productivity is still increasing solidly three and a half years after the trough of the recession. At the equivalent point in the mid-1980s recovery, labour productivity growth had ceased. In terms of the fundamentals, the increasing competition brought about by the Hilmer Reforms and the internationalisation of the economy should have positive influences on labour-productivity growth. The dividend from past and continuing investments in computerisation and information technologies should also help underpin productivity growth. While it is difficult to predict future measurement problems, it is quite possible that they will be less severe over the second half of the 1990s, than they were over the second half of the 1980s. This is clearest in the retail industry, where much of the adjustment to deregulation of hours has been completed. In coming years, continuing improvements in technology and the move to larger stores should allow this industry to contribute positively to measured aggregate labour-productivity growth.
While picking changes in the trend rate of labour-productivity growth is a difficult task and is subject to considerable uncertainty, there is little evidence to suggest that the experience of the 1980s is the right benchmark. While the evidence is still unclear, the signs appear to be emerging of a faster rate of trend labour-productivity growth. Such an outcome is essential if both employment and real wages are to increase in a sustainable way.
| Square metres/location | Turnover/square metres | Turnover/employee ($; 1989/90 prices) | |||||||||
|---|---|---|---|---|---|---|---|---|---|---|---|
| Type of store | Locations | Employment | Turnover $m | 91/92 | % change | 91/92 | % change | 91/92 | % change | ||
| Supermarket and grocery | 9,476 | 179,619 | 26,093 | 560 | 23.3 | 4,918 | 5.4 | 145,269 | 8.9 | ||
| Meat, fish and poultry | 7,337 | 28,324 | 2,772 | 97 | −2.0 | 3,899 | 8.6 | 97,868 | −7.8 | ||
| Fruit and vegetables | 3,650 | 18,032 | 1,871 | 170 | 31.6 | 3,008 | −3.9 | 103,760 | 3.8 | ||
| Liquor | 1,882 | 8,786 | 2,130 | 213 | −10.2 | 5,312 | 2.4 | 242,431 | −13.1 | ||
| Bread and cakes | 4,755 | 29,715 | 1,165 | 108 | 21.1 | 2,267 | −11.3 | 39,206 | −16.1 | ||
| Takeaway food | 20,334 | 131,126 | 5,299 | 92 | 7.4 | 2,832 | 4.3 | 40,412 | −17.2 | ||
| Specialised food n.e.c. | 5,773 | 22,045 | 1,898 | 82 | 23.3 | 3,996 | 5.4 | 86,097 | 8.9 | ||
| Total specialised food | 43,731 | 238,028 | 15,134 | 105 | 11.2 | 3,294 | −5.0 | 63,581 | −18.7 | ||
| Total food retailing | 53,207 | 417,647 | 41,227 | 186 | 10.9 | 4,164 | 1.0 | 98,713 | −6.2 | ||
| Department stores | 430 | 86,576 | 9,798 | 9,084 | 3.1 | 2,508 | −10.5 | 113,172 | 3.5 | ||
| Clothing | 15,564 | 64,537 | 6,314 | 150 | 13.6 | 2,696 | −5.7 | 97,835 | −1.6 | ||
| Footwear | 3,188 | 13,897 | 1,303 | 132 | −6.2 | 3,088 | 3.7 | 93,761 | −2.0 | ||
| Fabrics and other soft goods | 3,309 | 13,219 | 1,080 | 177 | 24.0 | 1,846 | −12.3 | 81,701 | −2.5 | ||
| Total clothing and soft goods | 22,061 | 91,653 | 8,697 | 152 | 12.0 | 2,597 | −5.0 | 94,891 | −1.3 | ||
| Furniture | 3,032 | 14,401 | 2,507 | 670 | 17.3 | 1,234 | −18.8 | 174,085 | −10.5 | ||
| Floor covering | 1,361 | 5,413 | 978 | 348 | −9.8 | 2,063 | −10.1 | 180,676 | −14.6 | ||
| Domestic hardware and housewares | 5,036 | 28,781 | 3,506 | 393 | 40.8 | 1,771 | −4.4 | 121,816 | 12.8 | ||
| Domestic appliances | 4,045 | 20,555 | 4,446 | 287 | 15.1 | 3,829 | −3.3 | 216,298 | 8.8 | ||
| Recorded music retailing | 838 | 3,353 | 444 | 105 | 11.3 | 5,045 | 10.9 | 132,419 | 9.0 | ||
| Total furniture, houseware, appliances | 14,312 | 72,503 | 11,881 | 401 | 20.2 | 2,072 | −8.8 | 163,869 | 0.2 | ||
| Sport and camping equipment | 3,356 | 11,568 | 1,186 | 180 | 16.8 | 1,960 | −6.9 | 102,524 | −0.2 | ||
| Toys and games | 989 | 3,884 | 391 | 190 | 16.8 | 2,080 | −6.9 | 100,669 | −0.2 | ||
| Newspapers, books and stationery | 6,928 | 35,860 | 4,014 | 138 | −18.6 | 4,199 | 29.7 | 111,935 | −6.1 | ||
| Photographic equipment | 428 | 2,225 | 343 | 110 | 38.8 | 7,298 | 32.5 | 154,157 | 27.0 | ||
| Marine equipment retailing | 644 | 2,760 | 437 | 186 | 22.0 | 3,642 | −36.0 | 158,333 | −22.7 | ||
| Total recreational goods | 12,345 | 56,297 | 6,371 | 155 | 4.6 | 3,323 | 1.6 | 113,168 | −6.0 | ||
| Pharmaceutical, cosmetics and toiletries | 5,646 | 38,932 | 4,084 | 136 | 9.2 | 5,325 | 15.0 | 104,901 | 7.8 | ||
| Antiques and used goods | 4,268 | 10,111 | 637 | 186 | 24.7 | 803 | −16.4 | 63,001 | −4.5 | ||
| Garden supplies | 2,420 | 9,430 | 626 | 662 | 17.7 | 391 | −7.3 | 66,384 | 2.4 | ||
| Flowers | 2,567 | 7,079 | 341 | 65 | 17.2 | 2,042 | −7.3 | 48,171 | 2.2 | ||
| Watches and jewellery | 3,512 | 16,073 | 1,451 | 80 | −2.8 | 5,182 | 49.4 | 90,276 | 31.3 | ||
| Retailing n.e.c. | 9,513 | 29,401 | 2,066 | 116 | −3.1 | 1,876 | 15.3 | 70,270 | −7.6 | ||
| Total other personal and household goods retailing | 27,926 | 111,026 | 9,205 | 169 | 8.8 | 1,955 | 1.5 | 82,909 | 4.1 | ||
| Total household equipment repair services | 3,258 | 9,633 | 506 | 95 | n.a. | 1,627 | n.a. | 52,528 | n.a. | ||
| Total personal and household goods | 80,332 | 427,688 | 46,458 | 248 | 8.4 | 2,331 | −7.1 | 108,626 | −1.0 | ||
| Note: Percentage changes are from 1985/86 to 1991/92. Source: ABS Cat. No. 8623.1. |
|||||||||||
Footnotes
I am indebted to Palle Andersen, Guy Debelle, Jacqui Dwyer, David Gruen and participants at this Conference and at the Reserve Bank of Australia Research Seminar for helpful comments and discussion. I am also grateful to Ben Brown and Lynne Cockerell who provided invaluable research assistance. [*]
See EPAC (1989), Dowrick (1990), Dixon and McDonald (1992) and Phipps, Sheen and Wilkins (1992). [1]
The choice of time period is governed by the availability of data on hours worked by industry. [2]
In August 1994, the Australian Bureau of Statistics (ABS) switched from the Australian Standard Industrial Classification (ASIC) to the Australian and New Zealand Standard Industrial Classification (ANZSIC) system. This change has led to some alterations in the definition of industries. Since at the time of writing, historical data under the ANZSIC definitions are only available from December 1984, this paper predominantly uses data based on the ASIC industry definitions. In some cases in the industry studies, ASIC data are used in conjunction with ANZSIC data. Attempts have been made to ensure that the data are as comparable as possible. [3]
Hours-worked data are calculated by multiplying employment by average hours worked. The employment data are seasonally adjusted by the ABS. The hours-worked data are seasonally adjusted using the X11 procedure and then a centred (Henderson) moving average is applied to the seasonally-adjusted data. [4]
See ABS Cat. No. 6248.0. [5]
Quarterly estimates are derived by interpolating the annual estimates with estimates of hours worked (see ABS Cat. No. 5243.0). [6]
This procedure was also used for the 1984/85 base-year estimate for public administration and defence. [7]
The ratio has been rebased to 100 in March 1985. The ABS state that ‘if the incidence of multiple job-holding, labour turnover and part-time working remains fixed over time, the estimates of movement in employment provided by the two series are, in concept, the same.’ (ABS Cat. No. 5211.0, 1989/90, p. 18:33). [8]
For a discussion of the impact of recent microeconomic reforms on productivity see Filmer and Dao (1994). [9]
The GDP(A) series is used here. The data period has been extended to include the December quarter 1994. [10]
See Ergas and Wright (1994) for evidence that internationalisation has affected the performance of firms in the manufacturing industry. [11]
Between 1966/67 and 1978/79 output per person employed in the industry increased at around 1.6 per cent per year. [12]
One source is OECD (1992). This report examines the change in the structure of the distribution industry in seven OECD countries (Australia is not included). [13]
A series of reports published by the OECD suggest that, in a range of countries, labour-productivity growth in the distributive trades was between 1 and 2 per cent in the 1980s (see Betancourt (1993), Dawson (1993), Lachner, Tager and Weitzel (1993), Maruyama (1993), Messerlin (1993), Pellegrini and Cardani (1993) and Wibe(1993)). For the United States, both the Bureau of Labour Studies and the Bureau of Economic Activity estimate that output per hour worked in retailing increased by more than 1 per cent per year between 1977 and 1986. However, over this period labour productivity in food stores fell by 7 per cent (see Baily and Gordon (1988)). [14]
Oi (1992) argues that retail firms also engage in repackaging and supply ancillary services such as delivery and credit. [15]
The 1991/92 census, which is known as the Retail and Services Census, also included certain service industries. In the present paper, this census is simply referred to as the Retail Census. [16]
In part, this difference may reflect the fact that the 1991/92 Wholesale Industry Survey sought data on ‘management units’, while the earlier survey sought data on ‘establishments’. In the latter survey, businesses whose primary activity was not wholesaling were excluded. [17]
In part, this growth stems from the deregulation of baking hours in the mid 1980s. [18]
The fall is less pronounced when data from the 1984/85 base-year national accounts are used. The ABS attributes the difference in the 1984/85 and 1989/90 base-year accounts to a change in the method used to calculate value added of truck retailers (see ABS Cat. No. 5243.0). [19]
See Morrison and Newman (1983) for Canadian evidence that shopping hours regulation favours small stores. [20]
Not everybody perceived this public demand. In 1983, in one of many reports into the regulation of shopping hours, Justice Macken wrote: ‘It is blind fantasy to assume that in the Sydney Metropolitan area there are a significant number of people eager to shop on Saturday afternoons or on Sundays with respect to goods available to them through the week’ (Macken 1983, p. 53 as cited in Kiel and Haberkern (1994)). [21]
See the debate between Russell (1965) and Whitehead (1963, 1966). I am indebted to Glenn Withers for this historical perspective. [22]
For managerial workers, the 1978 observations are for private-sector, full-time male workers. The 1993, observations are for total (private and government), full-time male workers. For non-managerial workers the data for both time periods are for total (private and government) full-time workers. The data are from ABS Cat. Nos 6304.0 and 6305.0. [23]
The growth of part-time employment in these industries also has a role to play in explaining relative changes in average weekly earnings. More generally, changes in the relative education and skill levels of workers in different industries may influence the relationship between productivity growth and wages as well. [24]
This discussion ignores the impact of demand-side factors on product wages. This reflects the notion that an increase in demand should not permanently affect wages and prices, independently of its impact on the supply side; if marginal cost is constant, higher demand might drive up prices temporarily, but competition should eventually bid away any excess returns. There is, however, a role for the demand side to have a permanent effect of prices if the industry is subject to diminishing returns; if higher demand draws in more resources and reduces the marginal product then relative prices may increase. [25]
References
Australian Treasury (1994), Budget Statements 1994–95: Budget Paper No. 1, AGPS, Canberra.
Baily, M. (1993), ‘Competition, Regulation and Efficiency in Service Industries’, Brookings Papers on Economic Activity, 2, pp. 71–130.
Baily, M. and R. Gordon (1988), ‘The Productivity Slowdown, Measurement Issues, and the Explosion of Computer Power’, Brookings Papers on Economic Activity, 2, pp. 347–420.
Betancourt, R. (1993), ‘An Analysis of the U.S. Distribution System’, OECD Economics Department Working Paper No. 135.
David, P. (1990), ‘The Dynamo and the Computer: An Historical Perspective on the Modern Productivity Paradox’, American Economic Review, 80(2), pp. 355–361.
Dawson, J.A. (1993), ‘The Distribution Sector in the United Kingdom’, OECD Economics Department Working Paper No. 140.
Dixon, P. and D. McDonald (1992), ‘A Decomposition of Changes in Labour Productivity in Australia: 1970–71 to 1989–90’, Economic Record, 68(201), pp. 105–117.
Dowrick, S. (1990), ‘Explaining the Labour Productivity Slowdown of the 1980s’, Australian Bulletin of Labour, 16(3), pp. 174–198.
EPAC (1989), Productivity in Australia: Results of Recent Studies, Council Paper No. 39.
Ergas, H. and M. Wright (1994), ‘Internationalisation, Firm Conduct and Productivity’, in P. Lowe and J. Dwyer (eds), International Integration of the Australian Economy, Reserve Bank of Australia, Sydney, pp. 51–106.
Filmer, R. and D. Dao (1994), ‘Economic Effects of Microeconomic Reform’, EPAC Background Paper No. 38.
Kiel, G. and G. Haberkern (1994), The Impact of the Deregulation of Retail Trading Hours in Australia, Marketshare, Brisbane.
Lachner, J., U.C. Tager and G. Weitzel (1993), ‘The German Distribution System’, OECD Economics Department Working Paper No. 137.
Macken, J. (1983), Report to the Minister for Industrial Relations. In the Matter of the Opening and Closing Hours of Shops, Report No. 1074 of 1982, Sydney.
Maruyama, M. (1993), ‘A Study of The Distribution System in Japan’, OECD Economics Department Working Paper No. 136.
Messerlin, P.A. (1993), ‘The French Distribution Industry and the Openness of the French Economy’, OECD Economics Department Working Paper No. 138.
Meyer Zu Schlochtern, F. and J. Meyer Zu Schlochtern (1994), ‘An International Sectoral Database for Fourteen OECD Countries (Second Edition)’, OECD Economics Department Working Paper No. 57.
Morrison, S. and R. Newman (1983), ‘Hours of Operation Restrictions and Competition Among Retail Firms’, Economic Inquiry, XXI(1), pp. 107–114.
Noyelle, G. (1990), ‘Productivity in the Services: Preliminary Findings From a Comparative Study of France and the United States’, Bard College, Annandale-on-Hudson.
OECD (1992), ‘Structure and Change in Distribution Systems: An Analysis of Seven OECD Member Countries’, Working Party No. 1 of the Economic Policy Committee.
Oi, W. (1992), ‘Productivity in the Distributive Trades: The Shopper and the Economies of Massed Reserves’, in Z. Griliches (ed.), Output Measurement in the Service Sectors, The University of Chicago Press, Chicago, pp. 161–191.
Pellegrini, L. and A.M. Cardani (1993), ‘The Italian Distribution System’, OECD Economics Department Working Paper No. 139.
Phipps, A., J. Sheen and C. Wilkins (1992), ‘The Slowdown in Australian Productivity Growth: Some Aggregated and Disaggregated Evidence’, Sydney University Department of Economics Working Paper No. 175.
Russell, E. (1965), ‘Wages Policy in Australia’, Australian Economic Papers, 4(June-December), pp. 1–26.
Salter, W. (1960), Productivity and Technical Change, Cambridge University Press, Cambridge.
Smith, A. and D. Hitchens (1985), Productivity in the Distributive Trades, Cambridge University Press, Cambridge.
Wibe, S. (1993), ‘The Distribution System in Sweden’, OECD Economics Department Working Paper No. 141.
Whitehead, D. (1963), ‘Price-Cutting and Wages Policy’, Economic Record, 39(86), pp. 187–195.
Whitehead, D. (1966), ‘Professor Russell on Wages Policy: A Comment’, Australian Economic Papers, 5(December), pp. 224–229.