RDP 8303: The 1930's and the 1980's: Some Facts Attachment 1: Employment by Industry
September 1983
- Download the Paper 1.57MB
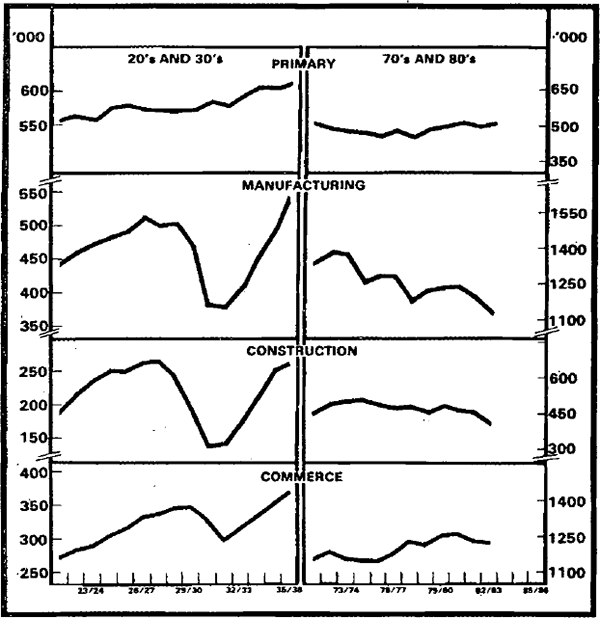
The attached graphs show the level of employment for five sectors of the economy:
- primary;
- manufacturing;
- commerce;
- construction; and
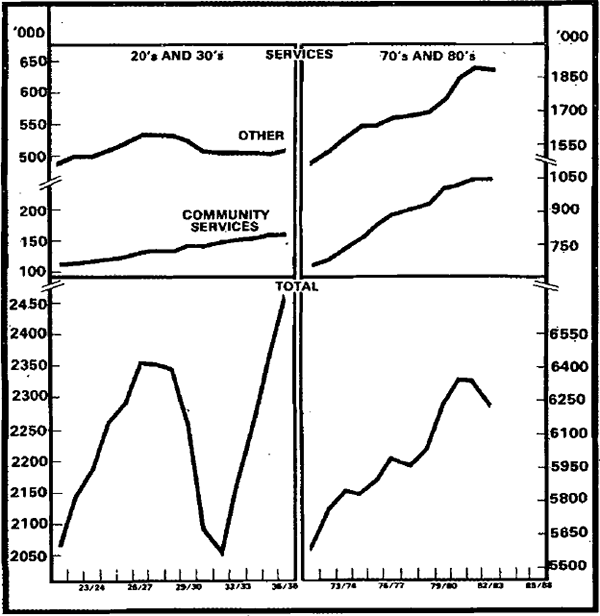
- services and other industries including, for example, community services, financial and property services, public administration, transport, storage and communication.
In 1922, a 1 per cent rise in employment implied about 21,000 extra jobs while a 1 per cent rise in 1972 would imply an additional 56,000 jobs. (These benchmarks have been used for scaling the graphs.)
The fluctuations in employment which occurred in the 20s and 30s were much larger than those in the 70s and 80s. From a peak in 1926/27, total employment declined by almost 300,000 persons or 13 per cent over the next five years. The job loss was recovered within three years and by 1935/36 employment was about 4 per cent above its previous peak.
The drop in employment in the late 20s commenced when manufacturing employment turned down in 1927/28. Employment in construction turned down in the following year. For both sectors, the big shake-out occurred in 1929/30 and 1930/31 – manufacturing employment declined by 7 per cent and 18 per cent respectively while employment in construction declined by 21 per cent and 28 per cent in these years.
In the five years to 1931/32, manufacturing employment suffered the largest absolute decline of 131,000 persons or 26 per cent. In relative terms, however, employment in construction, which was cut almost in half, fared much worse. The other main loss of employment occurred in commerce. These three industries accounted for 97 per cent of the drop in employment. During the upturn to the mid-30s, these industries were also the major areas of growth in employment. From 1931/32 to 1935/36, employment increased by 162,000 (43 per cent) in manufacturing, 123,000 (87 per cent) in construction and 71,000 (24 per cent) in commerce.
Employment in primary industries actually increased during the shake-out to 1931/32 and continued to rise during the upturn to the mid-30s. Experience in the service industries was diverse. Community services grew over the entire period (with the exception of an insignificant decline in 1930/31); public administration remained fairly static during the depression years and then grew as the economy expanded; while others (for example, gas, electricity and water and finance and property services) tended to move cyclically.
Relative to the 20s and 30s, growth of employment in the 70s and 80s has been much steadier. The outstanding feature of the latter period has been the growth of the service industries. The “cyclically-responsive” industries are still manufacturing, construction and commerce.
Total employment declined in 1974/75 due to a fall of around 8 per cent in manufacturing and around 1 per cent in commerce. A large fall in manufacturing employment was more than sufficient to explain the overall fall in employment in 1977/78. In the last year or so the fall in employment has again been concentrated in manufacturing and construction. Ry mid-1983[*], employment in manufacturing was about 18 per cent below its peak level of 1973; over the same period, employment in construction has dropped by 17 per cent. For commerce, employment has tended to rise in line with activity.
Over the last ten years, employment in services has grown from 38 per cent of the total in 1971/72 to 46 per cent in 1981/82. With the further decline in employment in manufacturing and construction over the last year, this proportion has increased further (to over 47 per cent). Industries, within this sector cover a wide range of activities and have shown quite diverse patterns of growth. Community services (for example, health and education services) have made the dominant contribution' in this group, having provided almost 400,000 new jobs over the last ten years. Other industries in this group (for example, financial and property services, public administration and electricity, gas and water) have grown fairly quickly during periods of expansion and remained static or declined somewhat in economic downturns.


Footnote
Figures for May 1983 have been adjusted to make them comparable with the August data used for previous years. If the seasonally adjusted level of employment did not change from May 1983 to August 1983, the actual level would be approximately 35,000 lower in August relative to May. [*]