RDP 8303: The 1930's and the 1980's: Some Facts 2. Main Economic Indicators
September 1983
- Download the Paper 1.57MB
Share prices are one of the most general economic indicators, with particular relevance for the health of the corporate sector. Graph 2 shows indices of share prices in the United States and Australia in the 1920's and 1930's and the 1970's and 1980's.
SHARE PRICES
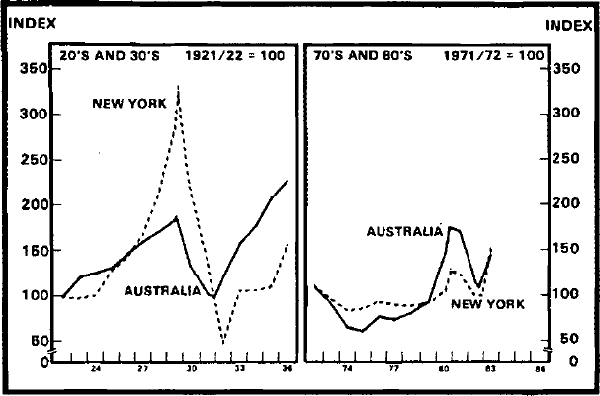
In both countries share prices generally rose through the 1920's. The rise and subsequent fall was much greater in the United States.[3] Movements in share prices have been generally much smaller in the 1970's and the 1980's.[4] Share prices generally fell in the early 1970's. There was a strong rise in Australia in the late 1970's with a peak in November 1980. Share prices in New York have risen by about 50 per cent from their trough in August 1982 to their value in mid August of this year.
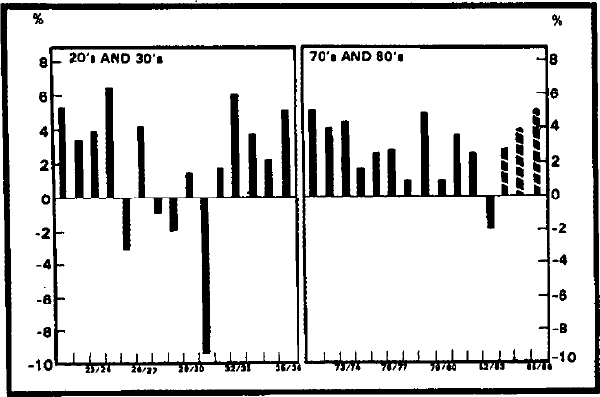
Graph 3 shows growth in real GDP and Table 1 shows a break-down into major components.
GROWTH IN REAL GDP
| private consumption | private investment | government spending | |
|---|---|---|---|
| 1921/22 – 25/26 | 6.1 | 8.2 | 4.8 |
| 1926/27 – 30/31 | −3.0 | −13.5 | −3.7 |
| 1931/32 – 35/36 | 4.4 | 11.7 | 5.4 |
| 1971/72 – 75/76 | 4.2 | −0.6 | 5.4 |
| 1976/77 – 80/81 | 2.5 | 5.3 | 2.2 |
| 1981/82 | 3.6 | 8.3 | 2.6 |
| 1982/83 | 0.8 | −17.1 | 3.5 |
| exports | imports | Total GDP | |
| 1921/22 – 25/26 | 4.2 | −(7.8) | 3.2 |
| 1926/27 – 30/31 | 3.5 | −(−11.5) | −1.4 |
| 1931/32 – 35/36 | 1.8 | −(11.4) | 3.7 |
| 1971/72 – 75/76 | 3.3 | −(4.0) | 3.5 |
| 1976/77 – 80/81 | 3.5 | −(4.3) | 2.7 |
| 1981/82 | 1.0 | −(12.1) | 2.5 |
| 1982/83 | 1.4 | −(−10.3) | −2.0 |
For the first half of the 1920's growth of real GDP was, except in one year, fairly strong. Domestic demand grew at a high rate (note the high growth rates of consumption and imports). In the second half of the decade Australia's growth performance deteriorated considerably. Boehm (1971) attributes the slow-down in the late 1920's to a conjunction of events including a sharp fall in the price and value of exports and a big reduction in capital formation financed by overseas borrowing. The big drop in export receipts reflected the disastrous reduction in world trade and the associated drops in commodity prices which are examined below. The falling away in capital inflow was partly due to a tightening in overseas financial markets, and partly due to the increasing concern of overseas lenders about the financial situation in Australia.
According to the estimates used in graph 3, real GDP fell by almost 10 per cent in 1930/31. Subsequently growth of real GDP resumed, albeit from a very low base.
Growth of real GDP was strong in the first three years of the 1970's, with private consumption and government spending both growing quickly. Performance for the rest of the decade was, in general, more subdued. There was a pick-up in real growth at the start of the 1980's, followed by a very sharp slow-down – at least by post-War standards. In 1982/83, real GDP fell by 2 per cent. The Treasurer indicated in his Budget speech that growth of around 3 per cent in 1983/84 might be achievable. Scenario A in the Economic Summit projected growth of 3.9 per cent and 4.8 per cent respectively in 1984/85 and 1985/86.
Table 2 sets out average rates of growth of population, the workforce and employment.
| Population | Workforce | Employment | Unemployment Rate | |
|---|---|---|---|---|
| 1921/22–25/26 | 1.0 | 2.3 | 3.0 | 5.4 |
| 1926/27–30/31 | 1.6 | 1.2 | −2.5 | 8.7 |
| 1931/32–35/36 | 0.7 | 1.7 | 4.0 | 15.9 |
| 1971/72–75/76 | 1.5 | 2.3 | 1.6 | 4.0 |
| 1976/77–80/81 | 1.2 | 1.5 | 1.3 | 5.9 |
| 1981/82 | 1.7 | 1.6 | 1.2 | 6.2 |
| 1982/83 | .. | 1.6 | −1.4 | 9.0 |
In the 1920's and 1930's population growth was generally low. In the first half of the 1920's, the participation rate increased strongly but the workforce nevertheless grew less quickly than total employment. The second half of the 1920's saw a big drop of employment, falling participation and generally rising unemployment. In the three years from 1929/30 to 1931/32, employment fell disastrously (by 17 per cent from the 1928/29 level). Then there was a period of strong employment growth (again from a very low base).[5]
Growth of population, the workforce and employment were all much steadier in the 1970's. The participation rate generally increased. Employment fell by about 1–1/2 per cent in 1982/83.
Graph 4 compares three measures of inflation in the two periods.
GROWTH IN PRICES AND WAGES
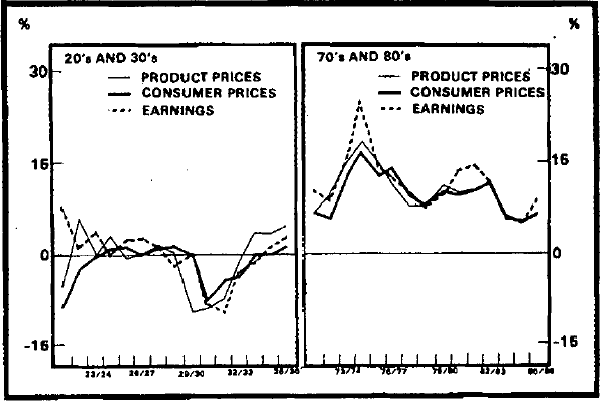
The solid lines show growth in consumer prices, the thin lines growth in a measure of product prices, and the striped lines growth in average weekly earnings.[6] There was a large rise in real wage incomes early in the 1920's, but thereafter wages and consumer prices moved fairly closely together until the cut in real wages in 1931/32 (reflecting the January 1931 decision by the Arbitration Commission to reduce wages by more than the fall in consumer prices).
The general tendency of the GDP deflator to rise in the early 1920's meant that wages as a cost to the employer rose more slowly than real wage incomes. In 1929/30, however, a big fall in product prices, reflecting the large decline in export prices, preceded the fall in consumer prices and earnings. Real labour costs, therefore, increased sharply; they rose a bit more in 1930/31 before declining in subsequent years.
The 1970's and 1980's, of course, have experienced strong inflationary pressures. For the period shown in the right-hand panel of graph 4 (including the projections for the next three years), the average rate of increase in consumer prices was 10 per cent, and the maximum (in 1974/75) was 16.7 per cent.
Early in the 1970's, growth in wages outstripped that of prices. Real wages were then fairly flat until the early 1980's, when real wages once again grew strongly. Scenario A does not foresee any significant reduction of real wages in the next three years.
Graph 5 shows real GDP, employment and a measure of productivity.
OUTPUT, EMPLOYMENT AND PRODUCTIVITY
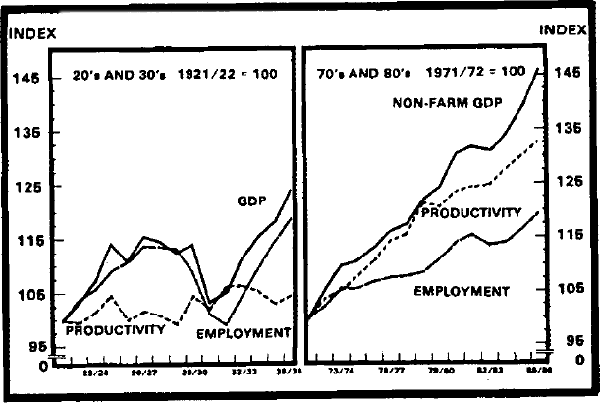
GDP grew quickly in the first half of the 1920's, while slightly slower growth in employment implied a modest rise in productivity. In the middle of the decade, productivity tended to decline as GDP grew more slowly than employment. Through the depression years, productivity generally rose as employment fell faster than GDP. But over the 15 year period as a whole, productivity did not show much growth.
Experience in the 1970's and 1980's has been very different. Productivity showed relatively strong growth throughout, with both real non-farm GDP and employment generally increasing. This experience is projected in Scenario A to continue after the downturn of 1982/83.
The indices in graph 6 attempt to measure real unit labour costs.[7] They show real labour costs (measured as nominal wages deflated by the GDP deflator) and adjusted for movements in labour productivity from graph 5.
COMPONENTS OF REAL UNIT LABOUR COSTS
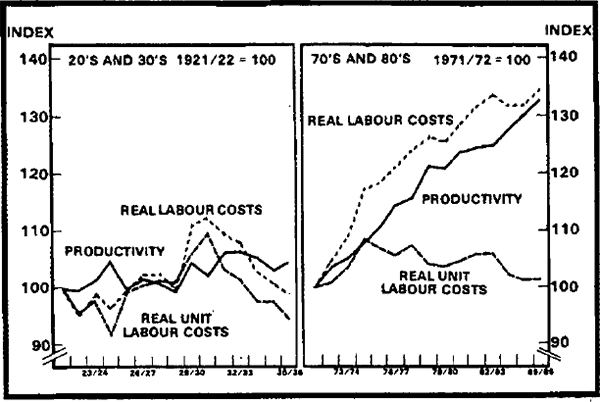
Real unit labour costs fell in the early 1920's as a result of strong productivity gains. They then rose sharply with the cut in productivity in 1925/26, then more gradually until 1929/30, when the GDP deflator fell by 10 per cent while average weekly earnings were about unchanged. By 1930/31, real unit labour costs were 10 per cent above the 1921/22 level. In that year, real GDP dropped by almost 10 per cent and unemployment rose from around 10 per cent to 16 per cent. The effect on real labour costs of the 10 per cent drop in real wages implemented by the Arbitration Commission at the start of 1931 is illustrated fairly clearly.[8] With some increases in productivity, and further falls in real wages, unit labour costs declined more or less continuously from 1930/31 to the mid-1930's. By 1935/36, real unit labour costs were more or less back to their level at the start of the 1920's. As this implies, the share of profits in national income had also been restored to its level of the early 1920's.
In contrast to experience in the early 1920's, real labour costs and real unit labour costs rose sharply in the early 1970's. On the measure used in this graph real unit labour costs peaked in 1974/75 around 8 per cent above the level at the start of the decade. Then there was a gradual net fall of around 5 per cent over the next five years (as productivity rose more quickly than real labour costs), followed by another rise around the turn of the decade. By 1982/83 unit labour costs were about 6 per cent above the level at the start of the 1970's. Scenario A implies that unit labour costs will decline to the 1970/71 level over the next three years, basically as a result of increases in productivity.
Footnotes
Figures for June in each year are given, with figures for other months given as required to indicate peaks and troughs. [3]
In 1971/72 the Australian index was 15 times above its level in 1921/22 while the New York index was 17 times its 1921/22 level. Over the same period Australian consumer prices rose 3.7 times while U.S. prices rose 2½ times. [4]
Attachment 1 examines the composition of employment in each episode. Employment in manufacturing and construction was most volatile in both episodes, with much greater fluctuations in the 1920's and 1930's. [5]
Deflation of earnings by consumer prices gives information about spending power, while deflation by product prices is relevant for calculations of labour as a cost of production. [6]
Real unit labour costs are calculated by dividing average earnings by product prices and productivity (output per employed worker). In theory, this equals the wage share of output. In practice, differences in methods of measurement and the existence of taxes make this only approximately true. The series graphed here for the 1980's incorporates payroll tax as a cost to the employer. For further discussion of these issues see “The Measurement of Real Unit Labour Costs” in a Supplement to the Treasury Round-up of Economic Statistics, September 1978. [7]
“Great and increasing unemployment is strongly symptomatic of a wage level too high for our present capacity. The national loss of spending power synchronizes with the recent aggravated increase of unemployment; after analysis of other suggested causes elsewhere in this judgement, the conclusion is unavoidable that the present wage level is above that which can be supported by the marketable productivity of the Commonwealth and that a lowering of that level is one of the essential means of checking a further increase of unemployment, of gradually restoring employment and of restoring a proper economic balance.”
[8]