RDP 8303: The 1930's and the 1980's: Some Facts 3. External Influences
September 1983
- Download the Paper 1.57MB
Graph 7 shows indices of the prices of commodities of particular importance to Australia. For the early experience, prices (in Australian pounds) of wool, wheat and gold are given. For the later episode, prices of wool and wheat are again given but an index of the price of metals replaces that of gold.
COMMODITY PRICE INDICES
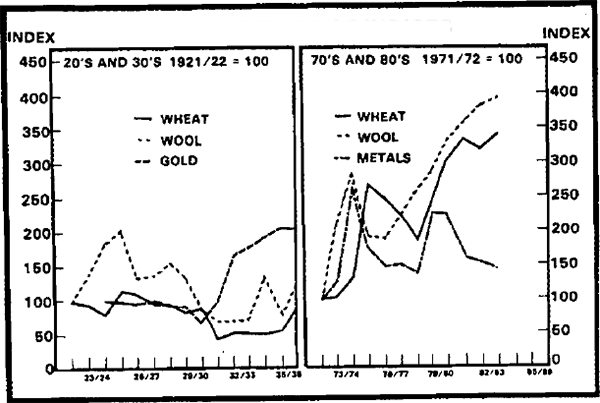
The 1920's were periods of generally falling prices. Wool prices rose strongly in the early 1920's, but then declined over the rest of the decade. The price of wheat also declined over the second half of the decade, with a very sharp drop in 1930/31. The price of gold was more stable, although this too declined slightly during the 1920's. During the recovery period of the mid-1930's, the prices of gold and, to a lesser extent, wool rose. The price of wheat did not rise appreciably until later in the decade.
The 1970's and the 1980's have been periods of generally rising prices. After a sharp rise in the years from 1972 to 1974, commodity prices declined as the world's economies moved into recession. The prices of wool and wheat are now almost double that at their respective troughs in 1975/76 and 1978/79. Metal prices fell sharply in the mid 1970's, rose strongly in 1979 and 1980, but have since fallen, to levels not much above those of the mid-1970's.
IMPORT PRICES
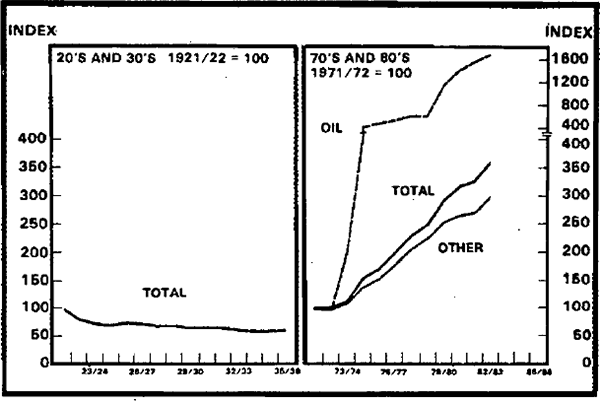
Graph 8 shows indices of the price of imports (for the latter period there is a division into the price of oil and other import prices). A general downward trend is evident for the 1920's and 1930's. Experience in the 1970's has been dominated by the two major hikes in the price of oil. The price of other imports has shown a general upward trend during the 1970's and 1980's.
The implications of these and other price movements for Australia are most simply summarised in the terms of trade, shown in Graph 9. For each period the index is defined as the average price of exports in relation to the average price of imports.
TERMS OF TRADE
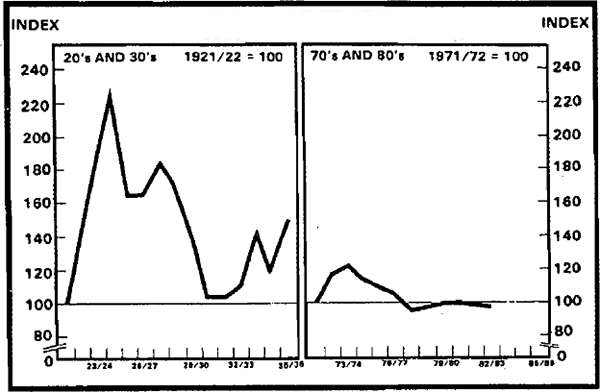
Mainly as a result of an increased price of wool, export prices rose (while import prices fell) in the early 1920's. Beginning with a sharp fall in 1925/26, there was a long period in which export prices generally fell more quickly than import prices. The terms of trade in fact rose by over 100 per cent in the five years to 1924/25 and then fell by 50 per cent in the next six years (bringing the terms of trade by 1930/31 roughly back to the same level as in the early 1920's).
Although recent experience has been qualitatively similar, the magnitudes of the movements have been very much smaller. There was a 20 per cent rise in the terms of trade in the early 1970's and then a fall of similar magnitude in the next three or four years as the average price of imports rose by more than those of exports. Australia's terms of trade have been roughly constant since the late 1970's although there was a 2–1/2 per cent drop in 1982/83.
WORLD TRADE VOLUME
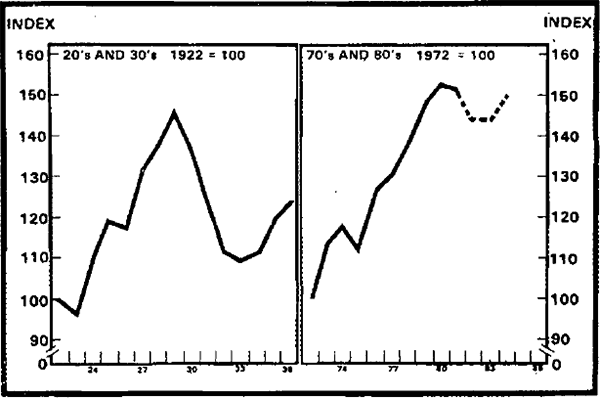
Graph 10 shows indices of world trade. (This graph is in calendar years, reflecting the available data.) The volume of trade expanded strongly through the 1920's, before the sharp slump around the turn of the decade. By 1934, world trade was once again growing. Apart from the sharp set-back in 1975, trade expanded strongly in the seventies. The sizeable declines in 1981 and 1982 went with reduced demand for Australia's exports. Current indications are, however, that some sort of recovery has commenced. (The graph includes the latest OECD forecasts for 1983 and 1984.)
INTEREST RATES: AUSTRALIA AND ABROAD
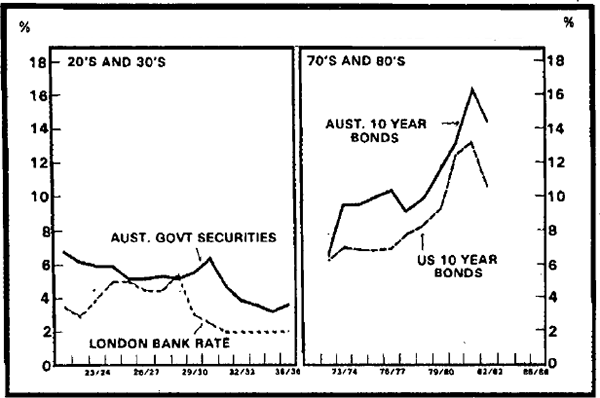
Graph 11 shows interest rates in Australia and in a major overseas centre – London for the 1930's and the United States in the 1980's. The London “Bank rate” peaked in June 1928, and then declined substantially, stabilising at around 2 per cent by the mid-1930's. The rate on Australian government securities rose from the mid-1920's to 1930/31, reflecting, at least towards the end of this period, declining confidence in the solvency of Australian government finance. The lessening of these fears, with the advent of the Premiers' Plan, and the legislated reduction in domestic interest rates associated with that Plan, led to a fall in market yields from late in 1931.
In the 1970's and early 1980's, interest rates around the world generally rose, peaking during 1981/82. This was due to a number of factors, including large budget deficits, high rates of inflation and the use of tough monetary policies to control that inflation. There has since been a slight decline.